. 2022 Mar 8;12(1):3758.
doi: 10.1038/s41598-022-07675-6.

Histone H2AX promotes metastatic progression by preserving glycolysis via hexokinase-2

Affiliations

Histone H2AX promotes metastatic progression by preserving glycolysis via hexokinase-2

Yue Liu et al. Sci Rep. .

Abstract

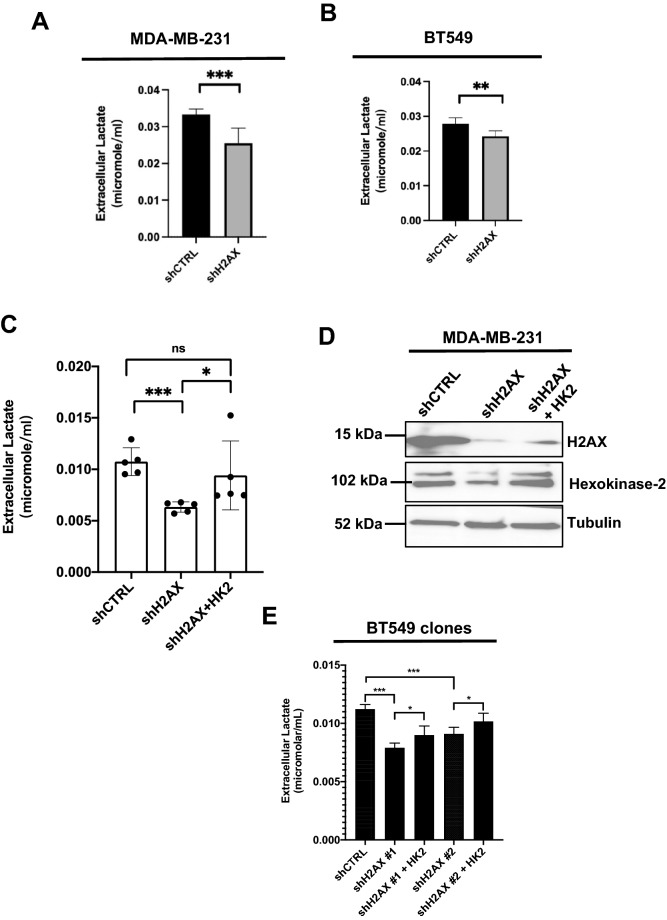
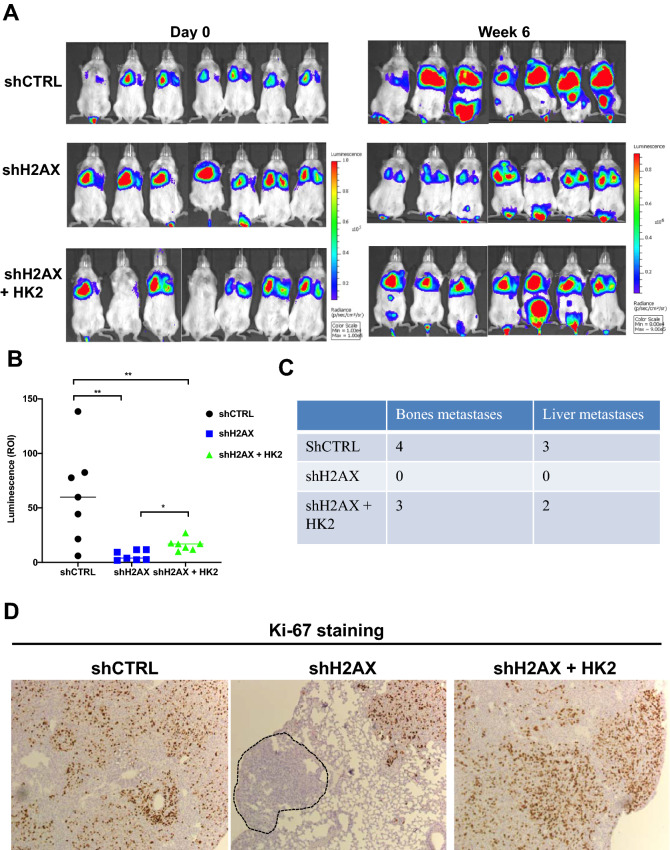
Genomic stability is essential for organismal development, cellular homeostasis, and survival. The DNA double-strand breaks are particularly deleterious, creating an environment prone to cellular transformation and oncogenic activation. The histone variant H2AX is an essential component of the nucleosome responsible for initiating the early steps of the DNA repair process. H2AX maintains genomic stability by initiating a signaling cascade that collectively functions to promote DNA double-strand breaks repair. Recent advances have linked genomic stability to energetic metabolism, and alterations in metabolism were found to interfere with genome maintenance. Utilizing genome-wide transcripts profiling to identify differentially-expressed genes involved in energetic metabolism, we compared control and H2AX-deficient metastatic breast cancer cell lines, and found that H2AX loss leads to the repression of key genes regulating glycolysis, with a prominent effect on hexokinase-2 (HK2). These observations are substantiated by evidence that H2AX loss compromises glycolysis, effect which was reversed by ectopic expression of HK2. Utilizing models of experimental metastasis, we found that H2AX silencing halts progression of metastatic breast cancer cells MDA-MB-231. Most interestingly, ectopic expression of HK2 in H2AX-deficient cells restores their metastatic potential. Using multiple publicly available datasets, we found a significantly strong positive correlation between H2AX expression levels in patients with invasive breast cancer, and levels of glycolysis genes, particularly HK2. These observations are consistent with the evidence that high H2AX expression is associated with shorter distant metastasis-free survival. Our findings reveal a role for histone H2AX in controlling the metastatic ability of breast cancer cells via maintenance of HK2-driven glycolysis.


Conflict of interest statement

The authors declare no competing interests.

Figures

Figure 1
Figure 1
H2AX is a key player in the regulation of glycolysis in triple-negative breast cancer cells. (A) MDA-MB-231 and BT549 cells were transfected with scrambled short hairpin RNA (shCTRL) or with short hairpin RNA against H2AFX (shH2AX), and the resulting cells were used for transcriptomics to generate Differentially Expressed Genes (DEG) between shCTRL and shH2AX. DEG were merged with 2981 metabolic genes to identify genes regulated by H2AX. The output from the overlay between the two genes sets revealed 347 genes commonly shared and consistent in both MDA-MB-231 and BT549 cells. (B,C) Ingenuity Pathway Analysis (IPA) was used to establish cellular pathways in which the 347 metabolic genes are involved. The output revealed enrichment for multiple pathways involved in metabolic reprogramming of cancer cells. Glycolysis pathway is significantly repressed in both cell lines. Blue bars represent repressed pathways, and orange bars represent activated pathways. Grey bars indicate a pathway with fewer molecules and limited enrichment for a prediction. The height of the bar represents the p-value. The yellow line indicates the log (p-value) threshold of significance (1.3), which corresponds to p-value of 0.05. Statistical significance was determined by Fishers Test.
Figure 2
Figure 2
Down-regulation of H2AX promotes repression of key glycolysis genes. (A) Heatmap of the the ten genes found to be enriched in the glycolysis signaling pathway in IPA. Note that nine out of the ten genes were significantly repressed in cells deficient for H2AX, with only Glucose-6-Phosphate Isomerase (GPI) activated upon H2AX silencing. The numbering refers to independent replicates for either shCTRL sample or shH2AX sample. (B) The nine glycolysis genes repressed in H2AX-deficient cells were analyzed for their expression level in the gene expression-based outcome for breast cancer online (GOBO) dataset and compared to that of H2AX in the same patients. H2AX expression is significantly correlated with most glycolysis genes across specimens. (C) Similar comparison was performed in human invasive breast cancer samples available in the Cancer Genome Atlas (TCGA) dataset. (D,E) MDA-MB-231 cells (D) and BT549 cells (E) were transfected with either scrambled short hairpin RNA (shCTRL) or with short hairpin RNA against H2AFX (shH2AX), and transcript levels of HK1 and HK2 was analyzed using real-time PCR. Expression values are relative fold change for gene transcripts normalized to Actin transcript (Gene/Actin ratio). Error bars represent S.E.M. (n = 3). Statistical significance was determined by a two-tailed, unpaired Student’s t-test. (F,G). MDA-MB-231 cells (F) and BT549 cells (G) were transfected with either scrambled short hairpin RNA (shCTRL) or with short hairpin RNA against H2AFX (shH2AX) and cells were used for immunoblot analysis of H2AX and HK2 with tubulin detected as loading control. Statistical significance was determined by a two-tailed, unpaired Student’s t-test. *pvalue < 0.05, **p value ≤ 0.001, ***p value ≤ 0.0001, ns: non-significant.
Figure 3
Figure 3
H2AX silencing leads to reduced glycolysis in invasive breast cancer cells. (A,B) H2AX silencing resulted in a 20% diminution in glycolysis level in both MDA-MB-231 (A) and BT549 cells (B). Level of glycolysis was detected by measurement of extracellular lactate production as described in “Methods” section. Error bars represent S.E.M. (n = 9). (C) Extracellular lactate level in MDA-MB-231 control cells (shCTRL), H2AX-deficient cells (shH2AX), and H2AX-deficient cells in which HK2 expression was reintroduced (shH2AX + HK2). (D) Cells described in (C) were subjected to immunoblot for the detection of protein levels for H2AX, HK2, and tubulin. (E) BT-549 cells were infected with either scrambled short hairpin RNA, or with short hairpin RNA against H2AFX (shH2AX), and cells were selected in the presence of puromycin to establish stable clones (shH2AX #1, and shH2AX #2). These control and H2AX-deficient cells were transfected with either control vector (shCTRL) or with vector expressing HK2 (shH2AX + HK2), and the resulting cells were used for quantification of extracellular lactate level. Statistical significance was determined by a two-tailed, unpaired Student’s t-test. Error bars represent S.E.M. (n = 6). *p value < 0.05, ***p value ≤ 0.0001, ns: non-significant.
Figure 4
Figure 4
HK2 re-expression in H2AX-deficient cells partly restores metastatic colonization in the lung. (A) MDA-MB-231 control cells with empty vector (shCTRL), H2AX-deficient cells with empty vector (shH2AX), and H2AX-deficient in which HK2 was reintroduced (shH2AX + HK2) were inoculated via the tail veins of immunocompromised NOD SCID gamma mice, and animals were used for bioluminescence-based imaging from one week up to six weeks. The extent to which tumor cells exhibit growth and metastatic progression was monitored. Control cells (shCTRL) showed significantly elevated tumor growth in the lung as well as distant metastases to bones and liver, while H2AX-deficient cells showed a 60% reduction in tumor growth with no detectable distant metastases. Ectopic expression of HK2 resulted in a partial restoration of growth and metastastic potential. (B) Quantification of the luminescence detected in the lung. (C) The extent to which tumor cells metastasize outside the lung was analyzed by monitoring the presence of bioluminescence in the body. Note that luminescence was primarily detected in bones and liver specifically when animal were injected with either control cells (shCTRL) or with H2AX-deficient cells ectopically expessing HK2 (shH2AX + HK2). (D) Representative Ki-67-stained lung sections from mice injected with control cells with empty vector (shCTRL), H2AX-deficient cells with empty vector (shH2AX) and H2AX-deficient cells in which HK2 was reexpressed (shH2AX + HK2). Dashed lines indicate tumor regions in mice bearing H2AX-deficient cells with negative Ki-67 staining, implying presence of less aggressive tumor cells. Statistical significance was determined by a two-tailed, unpaired Student’s t-test. Error bars represent S.E.M. (n = 7 per group). *pvalue < 0.05; **p value ≤ 0.001.
Figure 5
Figure 5
H2AX expression is correlated with that of HK2 and with survival rate in patients with invasive breast cancer. (A) Dataset from Cancer Cell line Encyclopedia (CCLE) was utilized to assess level of H2AX transcript comparing cells derived from primary sites with the ones from metastatic sites. CCLE normalized expression data and clinical information were downloaded from cBioportal. Breast (n = 29 primary vs. n = 26 metastasis), colorectal (n = 48 primary vs. n = 11 metastasis), esophagogastric (n = 66 primary vs. n = 27 metastasis), mature B-cell neoplasms (n = 39 primary vs. n = 15 metastasis), melanoma (n = 31 primary vs. n = 25 metastasis), non-small cell lung (n = 75 primary vs. n = 50 metastasis), ovarian (n = 34 primary vs. n = 15 metastasis), pancreatic (n = 26 primary vs. n = 15 metastasis), and small cell lung (n = 18 primary vs. n = 32 metastasis). For breast, **p value = 0.0092; for esophagogastric, *p value = 0.0284; ns, non-significant. (B) Breast cancer microarray raw data and clinical information from GOBO (see “Methods” section) were downloaded. Chin raw data was downloaded from EMBL-EBI. To assess distant metastasis-free survival (DMFS), all specimens were evenly divided into three groups to generate a Kaplan–Meier survival curve using in-house Python script. H2AX expression level was clustered based on the following distribution: low (H2AFX = 4.419–6.69, n = 296 samples; intermediate (H2AFX = 6.694–7.267, n = 296 samples, and high (H2AFX = 7.267 – 9.14, n = 295). (C) Expression level of H2AFX and HK2 were extracted from the GOBO datasets described in (B) including samples without published medical history, and the analysis was performed using Spearman correlation coefficient. (D) Similar analysis was conducted using single-cell RNAseq dataset from GSE176078 and specimens of triple-negative breast cancer (TNBC) were specifically considered for the analysis using Seurat library in R (n = cell number).

Similar articles

Cited by

References

    1. Tam WL, Weinberg RA. The epigenetics of epithelial-mesenchymal plasticity in cancer. Nat. Med. 2013;19(11):1438–1449. - PMC - PubMed
    1. Weyemi U, Redon CE, Choudhuri R, et al. The histone variant H2A.X is a regulator of the epithelial-mesenchymal transition. Nat. Commun. 2016;7:10711. - PMC - PubMed
    1. Wang H, Bierie B, Li AG, et al. BRCA1/FANCD2/BRG1-driven DNA repair stabilizes the differentiation state of human mammary epithelial cells. Mol. Cell. 2016;63(2):277–292. - PMC - PubMed
    1. Yang HD, Kim PJ, Eun JW, et al. Oncogenic potential of histone-variant H2A.Z.1 and its regulatory role in cell cycle and epithelial-mesenchymal transition in liver cancer. Oncotarget. 2016;7(10):11412–11423. - PMC - PubMed
    1. Domaschenz R, Kurscheid S, Nekrasov M, Han S, Tremethick DJ. The histone variant H2A.Z is a master regulator of the epithelial-mesenchymal transition. Cell Rep. 2017;21(4):943–952. - PubMed

Publication types