. 2022 Mar 8;12(1):3710.
doi: 10.1038/s41598-022-07788-y.

Automatic compensation enhances the orientation perception in chronic astigmatism

Affiliations

Automatic compensation enhances the orientation perception in chronic astigmatism

Sangkyu Son et al. Sci Rep. .

Abstract

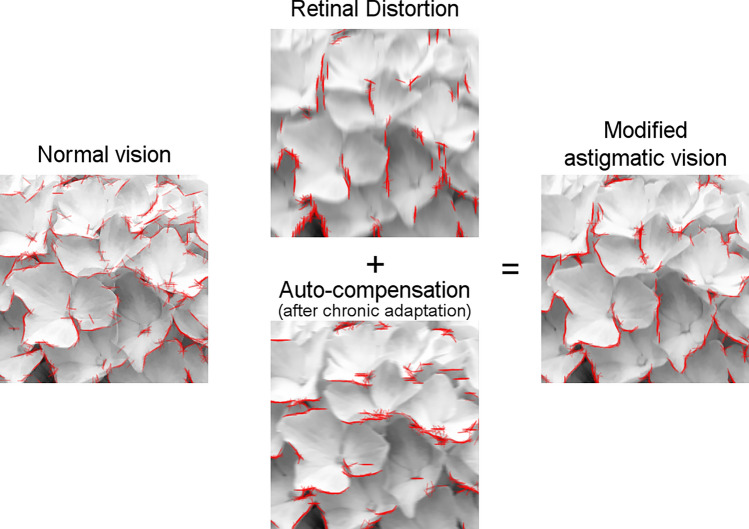
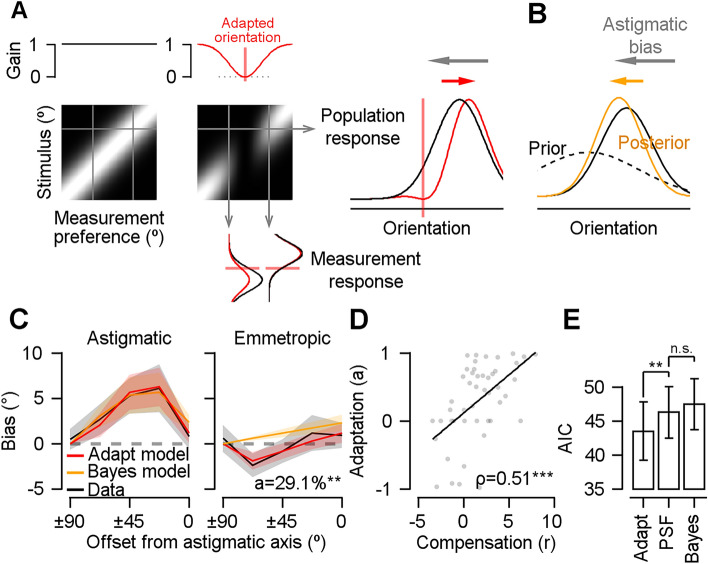
Astigmatism is a prevalent optical problem in which two or more focal points blur the retinal image at a particular meridian. Although many features of astigmatic vision, including orientation perception, are impaired at the retinal image level, the visual system appears to partly restore perceptual impairment after an extended period of astigmatism. However, the mechanism of orientation perception restoration in chronic astigmatism has not yet been clarified. We investigated the notable reduction of perceptual error in chronic astigmatism by comparing the orientation perception of a chronic astigmatism group with the perception of a normal-vision group, in which astigmatism was transiently induced. We found that orientation perception in the chronic group was more accurate than in the normal vision group. Interestingly, the reduction of perceptual errors was automatic; it remained even after the optical refractive errors were fully corrected, and the orientation perception was much more stable across different orientations, despite the uneven noise levels of the retinal images across meridians. We provide here a mechanistic explanation for how the compensation of astigmatic orientation perception occurred, using neural adaptation to the biased distribution of orientations.


Conflict of interest statement

The authors declare no competing interests.

Figures

Figure 1
Figure 1
Simulation of the compensatory effect on chronic astigmatism when an image of a hydrangea is presented. The effect of the astigmatic blur and the automatic compensation were simulated for visualization purposes, according to the mechanisms of the adaptation model described in the Results and Methods sections. The edges of each image were detected with the Sobel operator (red). The edges are intact in the image of normal vision but severely biased vertically in the astigmatic retinal image. After being counterbalanced by the inversely biased edges of the automatic compensation, the vision with chronic astigmatism partly restores the original edges.
Figure 2
Figure 2
(A) Participants viewed a Gabor stimulus either with their own chronic refractive error (chronic group) or experimentally-induced astigmatic refractive error (control group). In both cases, a refractive power on the orthogonal axis is higher than on the astigmatic axis (yellow arrow). The circle in front of the eye indicates the refractive powers of each meridian (the higher refractive power is in red). This causes light rays from the Gabor stimulus to refract more at the orthogonal axis (red lines) than at the astigmatic axis (gray lines), shaping elliptical blur. As a result, the orientation of the Gabor stimulus in the retinal image tilts away from the astigmatic axis (horizontal). We controlled the experiment duration to prevent the participants from adapting to the optical environments. (B) A schematic of the orientation adjustment task. Randomly tilted Gabor stimuli were briefly presented at the center. After the post-stimulus blank, participants reported the perceived mean orientation by rotating the orientation bar. (C) The perceptual biases of the chronic group (red line), control group (solid black line), and prediction of the theoretical model (dashed black line) were plotted as a function of offset from the astigmatic axis. The shaded areas indicate ± 2 standard error of the mean (SEM).
Figure 3
Figure 3
Automatic compensation of astigmatic distortion after chronic exposure. (A) The amount of optical blur (r) was estimated using the point spread function model. If the r value increases (as r = 5), a Gabor stimulus would be distorted to exhibit more astigmatic bias, and if the r value decreases (as r = − 5), it would be distorted to show the opposite bias, compared to emmetropia (r = 0). (B) The amount of optical blur (r) estimated in perceptual bias was plotted as a function of the physical refractive error of the eye in diopter (D). Dots and solid lines represent the r value of each eye and the linear regression line of each group. The shaded areas indicate ± 95% confidence intervals from bootstrapping. The amount of compensation indicates the mean vertical distance between the regression line of the control group (black line) and each red dot (***p < 0.001). (C) The relationship between the residual optical blur after fully correcting the refractive errors of the eyes and the amount of compensation of astigmatism. Rho indicates Spearman’s correlation coefficient (***p < 0.001). The solid line indicates the result of linear regression. (D) Standard deviations (SD) for each emmetropic and astigmatic vision condition and each group (left panel). The percent SD change in the astigmatic vision condition compared with the emmetropic condition for each orientation (right panel). The error bars and the shaded areas indicate ± 2 SEM.
Figure 4
Figure 4
The result of the adaptation and the Bayesian model. (A) The response matrix of the adaptation model. The vertical axis represents the response of a single measurement to the various stimuli orientations, and the horizontal axis represents the population response to single stimulus orientation. The upper panels indicate each measurement’s gain function. A decrease in Gaussian shape gain around the adapted orientation results in the parametric reduction of each measurement’s response around the adapted orientation (lower panels). In population orientation tuning response, the reduction of gain around the adapted orientation causes the repulsive shift against the astigmatic bias (right panel). (B) In the Bayesian model, the prior expectation is built after long exposure to the biased distribution of astigmatism (dashed black line). Then, the outcome of perceptual inference, or posterior distribution (orange line), is shifted toward the prior expectation, conforming to the astigmatic bias. (C) Each model’s predictions for the perceptual bias in the astigmatic vision and the emmetropic vision condition (red: adaptation model; orange: Bayesian model) overlapped with the actual perceptual bias (black). The value a indicates the amount of gain–loss in percentage (**p < 0.01). The shaded areas indicate ± 2 SEM. (D) The relationship between the amount of gain loss and compensation in astigmatism. Rho indicates Spearman’s correlation coefficient (***p < 0.001). The solid line indicates the result of linear regression. (E) The corrected Akaike’s Information Criteria was estimated from the predictions of the adaptation model (adapt), point spread function model (PSF), and Bayesian model (Bayes) on the emmetropic vision state. The error bars indicate ± 2 SEM (**p < 0.01; n.s., p > 0.05).

References

    1. Sorsby A, Sheridan M, Leary GA, Benjamin B. Vision, visual acuity, and ocular refraction of young men: Findings in a sample of 1,033 subjects. Br. Med. J. 1960;1:1394–1398. doi: 10.1136/bmj.1.5183.1394. - DOI - PMC - PubMed
    1. Wolffsohn JS, Bhogal G, Shah S. Effect of uncorrected astigmatism on vision. J. Cataract Refract. Surg. 2011;37:454–460. doi: 10.1016/j.jcrs.2010.09.022. - DOI - PubMed
    1. Atchison DA, Mathur A. Visual acuity with astigmatic blur. Optom. Vis. Sci. 2011;88:E798–E805. doi: 10.1097/OPX.0b013e3182186bc4. - DOI - PubMed
    1. Kobashi H, Kamiya K, Shimizu K, Kawamorita T, Uozato H. Effect of axis orientation on visual performance in astigmatic eyes. J. Cataract Refract. Surg. 2012;38:1352–1359. doi: 10.1016/j.jcrs.2012.03.032. - DOI - PubMed
    1. Bradley A, Thomas T, Kalaher M, Hoerres M. Effects of spherical and astigmatic defocus on acuity and contrast sensitivity: A comparison of three clinical charts. Optom. Vis. Sci. 1991;68:418–426. doi: 10.1097/00006324-199106000-00003. - DOI - PubMed

Publication types