. 2022 Mar 8;5(1):213.
doi: 10.1038/s42003-022-03117-1.

Genome-wide DNA methylation patterns reveal clinically relevant predictive and prognostic subtypes in human osteosarcoma

Affiliations

Genome-wide DNA methylation patterns reveal clinically relevant predictive and prognostic subtypes in human osteosarcoma

Christopher E Lietz et al. Commun Biol. .

Abstract

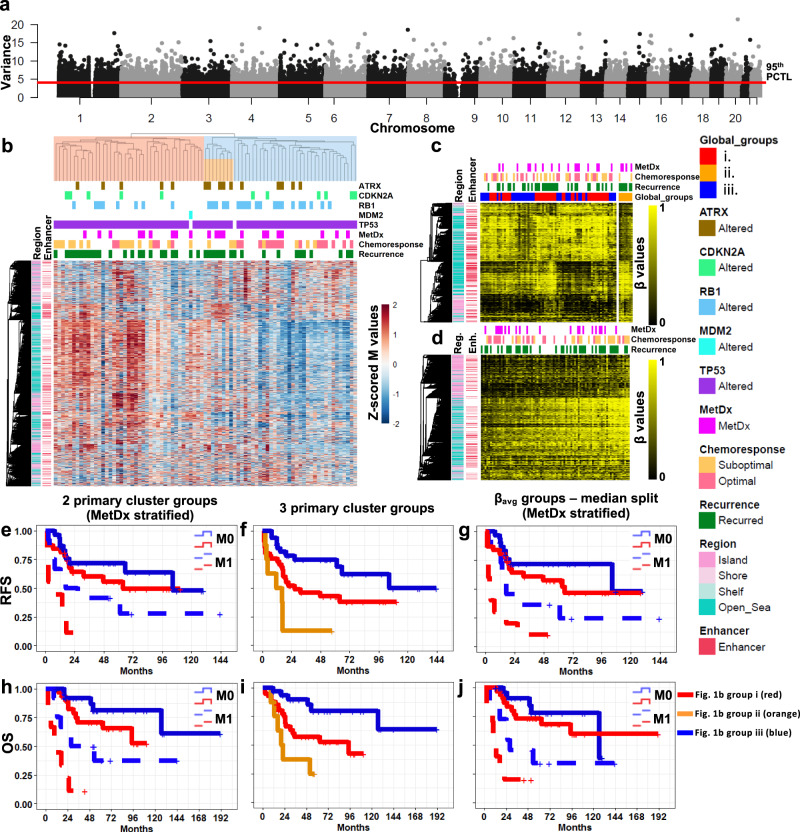
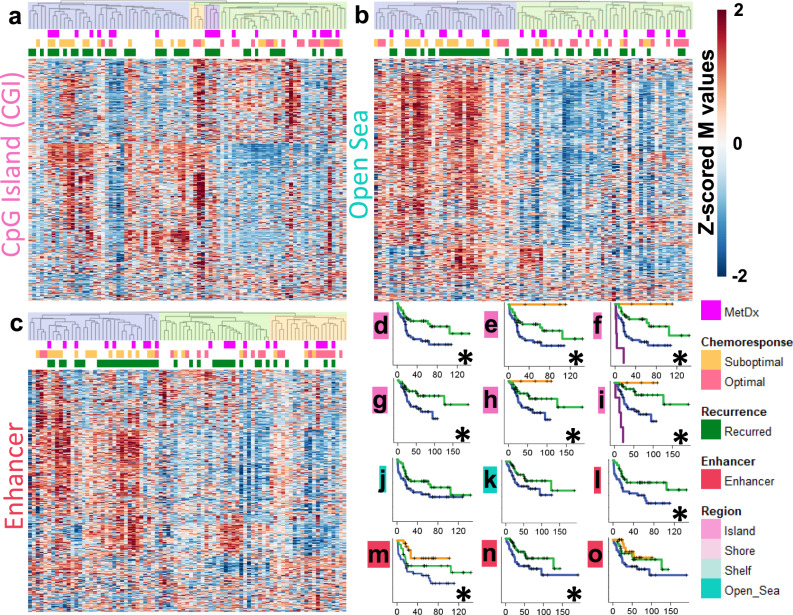
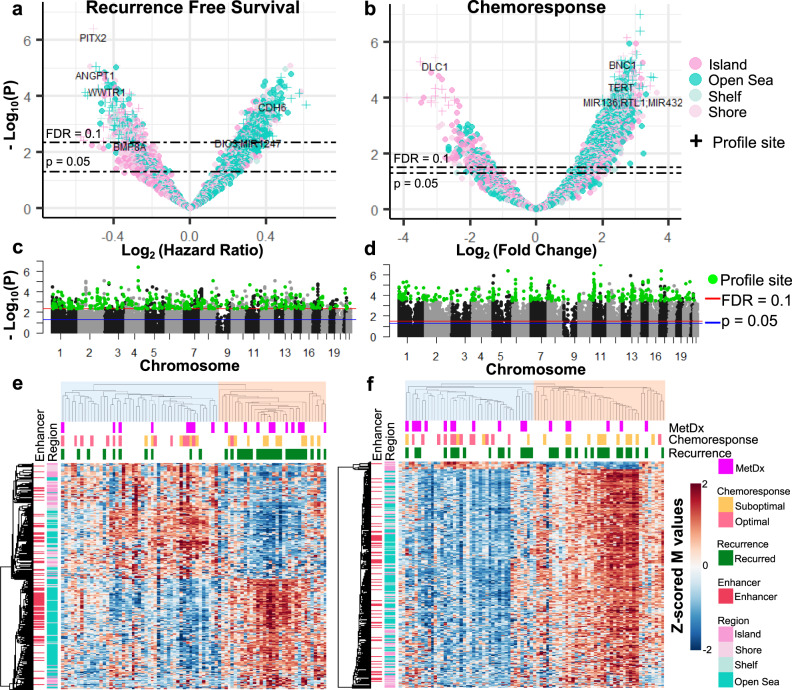
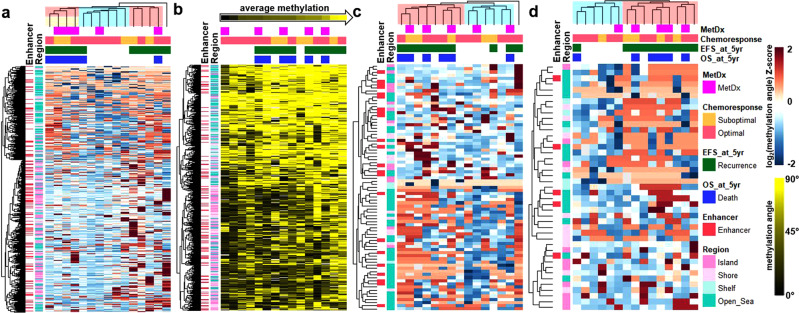
Aberrant methylation of genomic DNA has been reported in many cancers. Specific DNA methylation patterns have been shown to provide clinically useful prognostic information and define molecular disease subtypes with different response to therapy and long-term outcome. Osteosarcoma is an aggressive malignancy for which approximately half of tumors recur following standard combined surgical resection and chemotherapy. No accepted prognostic factor save tumor necrosis in response to adjuvant therapy currently exists, and traditional genomic studies have thus far failed to identify meaningful clinical associations. We studied the genome-wide methylation state of primary tumors and tested how they predict patient outcomes. We discovered relative genomic hypomethylation to be strongly predictive of response to standard chemotherapy. Recurrence and survival were also associated with genomic methylation, but through more site-specific patterns. Furthermore, the methylation patterns were reproducible in three small independent clinical datasets. Downstream transcriptional, in vitro, and pharmacogenomic analysis provides insight into the clinical translation of the methylation patterns. Our findings suggest the assessment of genomic methylation may represent a strategy for stratifying patients for the application of alternative therapies.


Conflict of interest statement

The authors declare no competing interests.

Figures

Fig. 1
Fig. 1. Global methylation patterns of primary tumors and clinical associations.
a Manhattan plot of genome-wide variance in methylation. The 5% most variantly methylated sites, those above the red line, are analyzed as the Global profile. b Unsupervised hierarchical clustering of the TARGET samples using the Global profile. Cluster reproducibility (R) indices were high, 0.98/0.95 for two and three groups respectively. c Supervised β value heatmap of the 1725 CpG sites differentially methylated (FDR < 0.1) between the very poor prognosis (ii) and other cluster groups (i and iii) in (b). d Supervised heatmap of the Global profile. Samples are ordered from low to high average β value. Two sample groups generated by a median split of the average β values were significantly associated with pathologic response to chemotherapy (Fisher’s exact p = 0.002, OR = 10.2, 95% CI: 2.5–41.7). e MetDx stratified RFS analysis of the two primary Global cluster groups (not metastatic: median RFS = 63.5 (i) and 104.7 mo. (iii), metastatic: median RFS = 2.3 (i) and 26.7 mo. (iii), pooled Log-Rank p = 0.006). f RFS analysis of the three primary cluster groups (median RFS = 11.5 (ii), 26.7 (i), and 104.7 mo. (iii), Log-Rank p = 5.0 × 10−4). Pairwise RFS analysis of the three primary cluster groups. Short (ii, 11.5 mo.) vs. intermediate (i, 26.7 mo.) median RFS Log-Rank p = 0.034. Intermediate (i) vs. long (iii, 104.7 mo.) median RFS Log-Rank p = 0.022. Short (ii) vs. long (iii) median RFS Log-Rank p = 2.7 × 10−5. g MetDx stratified RFS analysis of the low and high average methylation groups (median split) from c (not metastatic: median RFS = 65.5 and 104.7 mo., metastatic: median RFS = 3.5 and 16.9 mo., pooled Log-Rank p = 0.044). h MetDx stratified OS analysis of the two primary cluster groups (not metastatic: median OS = NYR (i) and NYR (iii), metastatic: median OS = 20.6 (i) and 111.9 mo. (iii), pooled Log-Rank p = 5 × 10−4). i OS analysis of the three primary cluster groups (median OS = 20.4 (ii), 94,7 mo. (i), and NYR (iii), Log-Rank p = 7.4 × 10−4. Pairwise OS analysis of the three primary cluster groups. Short (ii, 20.4 mo.) vs. intermediate (i, 94.7 mo.) median OS Log-Rank p = 0.067. Intermediate (i) vs. long (iii, NYR) median OS Log-Rank p = 0.008. Short (ii) vs. long (iii) median OS Log-Rank p = 1.8 × 10−4. j MetDx stratified OS analysis of the low and high average methylation groups (median split) from (c) (not metastatic: median OS = 126.6 mo. and NYR, metastatic: median OS = 9.7 and 28.2 mo., pooled Log-Rank p = 0.076).
Fig. 2
Fig. 2. Methylation patterns of genomic regions.
a Unsupervised hierarchical cluster analysis using CGI methylation (R indices = 0.83, 0.92, and 0.80 for 2, 3, and 4 groups, respectively). b Cluster analysis using Open Sea methylation (R index = 0.72 for 2 groups). c Cluster analysis using Enhancer methylation (R index = 0.80/0.76 for 2 and 3 groups respectively). df RFS analysis of the 2, 3, and 4 primary CGI clusters (Log-Rank p = 0.009, 0.015, and 6.7 × 10−7, respectively). gi OS analysis of the 2, 3, and 4 primary CGI clusters (Log-Rank p = 0.016, 0.036, and 3.2 × 10−8, respectively). j RFS analysis of the 2 primary Open Sea clusters (Log-Rank p = 0.074). k OS analysis of the 2 primary Open Sea clusters (Log-Rank p = 0.084). l, m RFS analysis of the 2 and 3 primary Enhancer clusters (Log-Rank p = 0.008, and 0.015, respectively). n, o OS analysis of the 2 and 3 primary Enhancer clusters (Log-Rank p = 0.045, and 0.116, respectively). Significant survival differences (log-rank p < 0.05 are marked with an *).
Fig. 3
Fig. 3. Supervised methylation profiles associated with outcome.
a, b Volcano plots for the association between methylation and RFS and CR. c, d Manhattan plots for association between methylation and RFS and CR. RFS and CR profile sites are in green. e, f Semi-supervised hierarchical clustering using the RFS and CR profiles (2-group cluster R-indices = 0.846 and 0.862, respectively).
Fig. 4
Fig. 4. Methylation profiles in the AECM validation dataset.
a Hierarchical clustering using the Global profile. b Supervised heatmap of the Global profile. Samples are ordered from low to high average methylation value. c Hierarchical clustering using sites associated with RFS in the TARGET dataset. d Hierarchical clustering using the CR profile.
Fig. 5
Fig. 5. Methylation profiles in two independent 450k array OSA datasets.
a Average β value distributions of Global, RFS, and CR profiles and region-specific subsets. Semi-supervised hierarchical clustering of the Global profile (b, c), RFS profile (d, e), and CR profile (f, g) in the JNNCRI (left) and NY (right) datasets. CpG sites displaying concordant hypo/hyper-methylation patterns between the independent 450k array datasets are annotated in the first two row annotation tracks of each heatmap. Detailed concordance and differentia methylation results between the cluster groups are presented in Supplementary Table 4.
Fig. 6
Fig. 6. Methylation profiles in the JNCCRI dataset including primary as well as metastatic tumor and normal tissue.
a Average β value distributions of Global, RFS, and CR profiles and region-specific subsets. Semi-supervised hierarchical clustering of normal, primary, and metastatic samples using the Global (b), RFS (c), and CR (d) profiles.
Fig. 7
Fig. 7. MissMethyl gometh pathway enrichment analysis of the methylation profiles.
Terms with FDR < 0.1 were considered enriched. a GO terms enriched in the Global profile. The top 25 most significantly enriched terms are shown. b GO terms uniquely enriched in the sites differentially methylated between the Global profile cluster groups compared to the full profile (a). c GO terms enriched in the sites associated with chemoresponse.
Fig. 8
Fig. 8. Transcription of genes annotated to the RFS profile.
a Hierarchical clustering using transcriptional of genes annotated to the RFS profile (2-group R-index = 0.78). Classification is similar to the respective RFS methylation cluster groups (Fig. 3c, Cramer’s V = 0.443, p = 1 × 10−4). b RFS analysis using the two main transcription-based cluster groups (Log Rank p value = 0.024, median RFS: NYR (Group 1, purple) vs. 26.7 mo. (Group 2, orange)).
Fig. 9
Fig. 9. Methylation profiles in OSA cell lines.
a Violin plots of the average β value distributions of the Global, RFS, and CR profiles and region-specific subsets in the GDSC cell lines and TARGET (for comparison) datasets. Boxplots depict the median, interquartile range (IQR), and 1.5 * IQR. bd Semi-supervised hierarchical clustering of the 11 OSA cell lines in the GDSC dataset using the Global (b), RFS (c), and CR (d) profiles. CpG sites displaying concordant hypo/hyper-methylation patterns in the cell line GDSC dataset relative to the TARGET clinical dataset are annotated in the first row annotation track of each heatmap. Detailed concordance results are presented in Supplementary Table 6.

References

    1. Rosen G, et al. Primary osteogenic sarcoma: the rationale for preoperative chemotherapy and delayed surgery. Cancer. 1979;43:2163–2177. - PubMed
    1. Link MP, et al. The effect of adjuvant chemotherapy on relapse-free survival in patients with osteosarcoma of the extremity. N. Engl. J. Med. 1986;314:1600–1606. - PubMed
    1. Bacci G, et al. Preoperative therapy versus immediate surgery in nonmetastatic osteosarcoma. J. Clin. Oncol. 2003;21:4662–4663. - PubMed
    1. Goorin AM, et al. Presurgical chemotherapy compared with immediate surgery and adjuvant chemotherapy for nonmetastatic osteosarcoma: Pediatric Oncology Group Study POG-8651. J. Clin. Oncol. 2003;21:1574–1580. - PubMed
    1. Siegel R, Naishadham D, Jemal A. Cancer statistics, 2012. CA Cancer J. Clin. 2012;62:10–29. - PubMed

Publication types