. 2022 Mar;54(3):239-251.
doi: 10.1038/s12276-022-00737-9. Epub 2022 Mar 8.

Sestrin2 protects against cholestatic liver injury by inhibiting endoplasmic reticulum stress and NLRP3 inflammasome-mediated pyroptosis

Affiliations

Sestrin2 protects against cholestatic liver injury by inhibiting endoplasmic reticulum stress and NLRP3 inflammasome-mediated pyroptosis

Daewon Han et al. Exp Mol Med. 2022 Mar.

Abstract

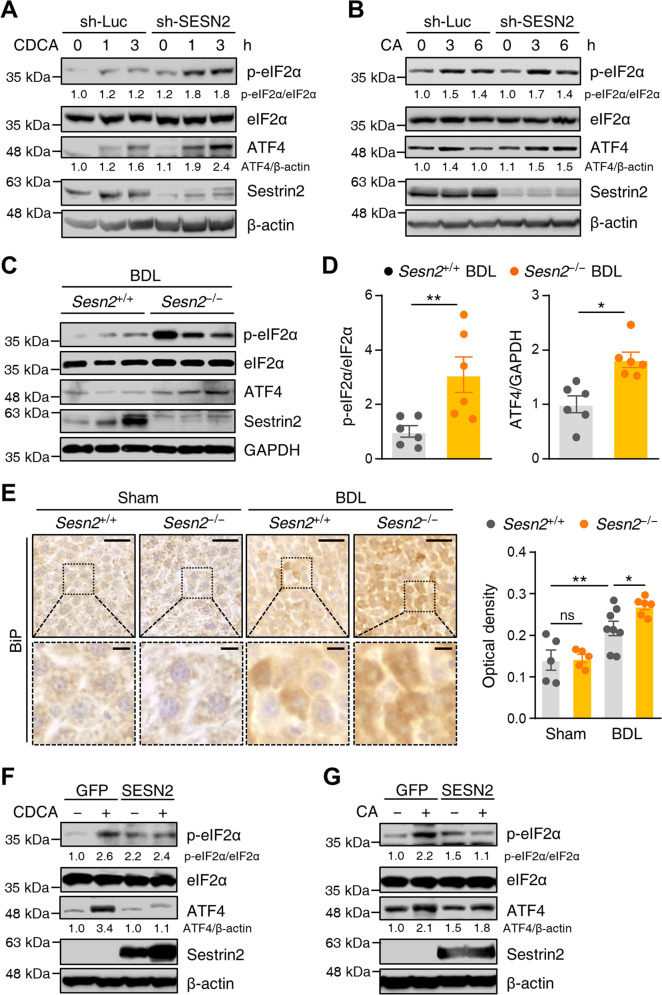
Chronic exposure to bile acid in the liver due to impaired bile flow induces cholestatic liver disease, resulting in hepatotoxicity and liver fibrosis. Sestrin2, a highly conserved, stress-inducible protein, has been implicated in cellular responses to multiple stress conditions and the maintenance of cellular homeostasis. However, its role in cholestatic liver injury is not fully understood. In this study, we investigated the role of hepatic Sestrin2 in cholestatic liver injury and its underlying mechanisms using in vivo and in vitro approaches. Hepatic Sestrin2 expression was upregulated by activating transcription factor 4 (ATF4) and CCAAT/enhancer-binding protein-β (C/EBP-β) after treatment with bile acids and correlated with endoplasmic reticulum (ER) stress responses. Bile-duct ligation (BDL)-induced hepatocellular apoptosis and liver fibrosis were exacerbated in Sestrin2-knockout (Sesn2-/-) mice. Moreover, Sestrin2 deficiency enhanced cholestasis-induced hepatic ER stress, whereas Sestrin2 overexpression ameliorated bile acid-induced ER stress. Notably, the mammalian target of rapamycin (mTOR) inhibitor rapamycin and the AMP-activated protein kinase (AMPK) activator AICAR reversed bile acid-induced ER stress in Sestrin2-deficient cells. Furthermore, Sestrin2 deficiency promoted cholestasis-induced hepatic pyroptosis by activating NLRP3 inflammasomes. Thus, our study provides evidence for the biological significance of Sestrin2 and its relationship with cholestatic liver injury, suggesting the potential role of Sestrin2 in regulating ER stress and inflammasome activation during cholestatic liver injury.


Conflict of interest statement

The authors declare no competing interests.

Figures

Fig. 1
Fig. 1. Sestrin2 is upregulated in bile acid-treated HepG2 cells and in BDL mouse livers.
AD HepG2 cells were treated with CDCA (20–200 µM) or CA (100–1000 µM) for 9 h, and the lysates were immunoblotted with anti-Sestrin2 antibodies (n = 3). EH HepG2 cells were treated with 200 µM CDCA or 750 µM CA for the indicated times, and the lysates were immunoblotted with anti-Sestrin2 antibodies (n = 3–4). β-Actin served as a loading control. Band intensities were quantified and normalized to the β-actin values. I, J qRT–PCR analysis of SESN1, SESN2, and SESN3 mRNA levels in HepG2 cells treated with 200 µM CDCA (A) or 750 µM CA (B) for 12 h (n = 4). K, L HepG2 cells were transfected with firefly luciferase reporter constructs containing a SESN2 promoter sequence. At 48 h after transfection, the cells were treated with 200 µM CDCA (K) or 750 µM CA (L) for the indicated times (n = 3–6). Firefly luciferase activities were measured and normalized to Renilla luciferase activities. (M) Immunofluorescence staining of Sestrin2 (green) in HepG2 cells treated with 200 µM CDCA or 1000 µM CA for 9 h. Nuclei were stained with DAPI (blue). Scale bars, 20 μm. NP Liver tissues were collected from mice 3 days after sham or BDL surgery (n = 5–6 mice per group) and analyzed by immunoblotting (N, O) and qRT–PCR (P). GAPDH served as a loading control. The data are representative of one (NP) or three (AM) independent experiments. *p < 0.05; **p < 0.01; ***p < 0.001; ns not significant (Student’s t test).
Fig. 2
Fig. 2. Sestrin2 deficiency exacerbates cholestatic liver injury.
A Immunofluorescence staining of cleaved caspase-3 (green, arrows) in HepG2 cells infected with lentiviruses expressing shRNAs targeting luciferase (sh-Luc) or Sestrin2 (sh-SESN2) and treated with 150 µM CDCA for 12 h (n = 4–5). Nuclei were counterstained with DAPI (blue). B, C qRT–PCR analysis of TGFB1 mRNA levels in HepG2 cells infected with sh-Luc or sh-SESN2 and treated with 200 µM CDCA or 750 µM CA for 12 h (n = 3). DF Serum ALT, AST, and ALP levels in Sesn2+/+ Sham, Sesn2+/+ BDL, Sesn2−/− Sham, and Sesn2−/− BDL mice (n = 5-10 mice per group). GJ Sesn2+/+ and Sesn2−/− mice were subjected to sham or bile duct ligation (BDL) for 3 days (n = 5–12 mice per group). G Immunohistochemical analysis of cleaved caspase-3 in liver tissues from Sesn2+/+ Sham, Sesn2+/+ BDL, Sesn2−/− Sham, and Sesn2−/− BDL mice. The boxed areas are magnified in the bottom panels. H, I H&E-stained liver sections from Sesn2+/+ Sham, Sesn2+/+ BDL, Sesn2−/− Sham, and Sesn2−/− BDL mice. Areas of necrosis were quantified. H, J Sirius red staining showing collagen fiber deposition in liver tissues from Sesn2+/+ Sham, Sesn2+/+ BDL, Sesn2−/− Sham, and Sesn2−/− BDL mice. K qRT–PCR analysis of Tgfb1 mRNA levels in liver tissues from the indicated mice (n = 4–8 mice per group). Scale bars, 50 μm (a); 100 μm (G, H); 20 μm (G, insets). The data are representative of two (DK) or three (AC) independent experiments. *p < 0.05; **p < 0.01; ***p < 0.001; ns, not significant (two-way ANOVA, followed by Tukey’s (AF, K) or Benjamini, Krieger, and Yekutieli’s (I, J) post hoc tests).
Fig. 3
Fig. 3. Bile acids upregulate Sestrin2 expression via an ATF4- and C/EBP-β-dependent mechanism.
A, B HepG2 cells were treated with 200 µM CDCA or 750 µM CA for the indicated times. Cell lysates were immunoblotted with anti-p-eIF2α, anti-eIF2α, and anti-ATF4 antibodies. C Immunofluorescence staining of PDI (green) in HepG2 cells treated with 200 µM CDCA or 750 µM CA for 9 h (n = 3–4). Nuclei were stained with DAPI (blue). Scale bars, 10 μm. D, E Liver tissues were collected from mice 3 days after sham or BDL surgery (n = 4–5 mice per group) and analyzed by immunoblotting with the indicated antibodies. Band intensities were quantified and normalized to GAPDH or total protein intensities. F Immunohistochemical analysis of BiP in liver tissues from mice 3 days after sham or BDL surgery (n = 4–5 mice per group). The boxed areas are magnified in the bottom panels. Scale bars, 50 μm; 10 μm (insets). G, H HepG2 cells were infected with lentiviruses expressing shRNAs targeting luciferase (sh-Luc) or ATF4 (sh-ATF4) and treated with 200 µM CDCA or 750 µM CA for 9 h. Cell lysates were immunoblotted with anti-Sestrin2 and anti-ATF4 antibodies. I, J HepG2 cells were infected with lentiviral sh-Luc or sh-C/EBP-β and treated with 200 µM CDCA or 750 µM CA for 9 h. Cell lysates were immunoblotted with anti-Sestrin2 and anti-C/EBP-β antibodies. GAPDH or β-actin served as loading controls. Numbers below the immunoblot bands indicate fold changes normalized to the control band intensities. The data are representative of one (DF) or at least three (AC, GJ) independent experiments. *p < 0.05; **p < 0.01; ***p < 0.001 (Student’s t test).
Fig. 4
Fig. 4. Sestrin2 deficiency exacerbates ER stress in cholestatic livers.
A, B HepG2 cells were infected with lentiviruses expressing shRNAs targeting luciferase (sh-Luc) or Sestrin2 (sh-SESN2) and treated with 200 µM CDCA or 750 µM CA for the indicated times. Cell lysates were immunoblotted with anti-p-eIF2α, anti-eIF2α, anti-ATF4, and anti-Sestrin2 antibodies. β-Actin served as a loading control. Numbers below the immunoblot bands indicate fold changes normalized to the control band intensities. C, D Liver tissues were collected from Sesn2+/+ BDL and Sesn2−/− BDL mice (n = 6 mice per group) and analyzed by immunoblotting with the indicated antibodies. GAPDH served as a loading control. Band intensities were quantified and normalized to GAPDH or total protein intensities. E Immunohistochemical analysis of BiP in liver tissues from Sesn2+/+ Sham, Sesn2+/+ BDL, Sesn2−/− Sham, and Sesn2−/− BDL mice (n = 5–8 mice per group). The boxed areas are magnified in the bottom panels. Scale bars, 50 μm; 10 μm (insets). F, G Immunoblot analysis of p-eIF2α, eIF2α, and ATF4 in HepG2 cells infected with lentiviruses expressing GFP as a control or Sestrin2 and treated with 200 µM CDCA or 750 µM CA for 3 h. β-Actin served as a loading control. Numbers below the immunoblot bands indicate fold changes normalized to the control band intensities. The data are representative of two (CE) or three (A, B, F, G) independent experiments. *p < 0.05; **p < 0.01 (Student’s t test in D and two-way ANOVA, followed by Benjamini, Krieger, and Yekutieli’s post hoc test in E).
Fig. 5
Fig. 5. Sestrin2 regulates AMPK/mTORC1 signaling during cholestasis.
A, B Liver tissues were collected from mice 3 days after sham or BDL surgery (n = 6 mice per group) and analyzed by immunoblotting with anti-p-AMPK, anti-AMPK, anti-p-p70S6K, anti-p70S6K, anti-p-S6, and anti-S6 antibodies. Band intensities were quantified and normalized to total protein intensities. CF HepG2 cells were infected with lentiviruses expressing shRNAs targeting luciferase (sh-Luc) or Sestrin2 (sh-SESN2) and treated with 200 µM CDCA or 750 µM CA for the indicated hours. Cell lysates were immunoblotted with the indicated antibodies. β-Actin served as a loading control. Numbers below the immunoblot bands indicate the fold changes normalized to the control band intensities. G, H Liver tissues were collected from Sesn2+/+ BDL and Sesn2−/− BDL mice (n = 6 mice per group) and analyzed by immunoblotting with the indicated antibodies. Band intensities were quantified and normalized to total protein intensities. The data are representative of two (A, B, G, H) or at least three (CF) independent experiments. *p < 0.05; **p < 0.01; ***p < 0.001 (Student’s t test).
Fig. 6
Fig. 6. Sestrin2 attenuates bile acid-induced ER stress via an AMPK/mTORC1-dependent mechanism.
A, B HepG2 cells were infected with sh-SESN2 lentivirus and treated with 200 µM CDCA or 750 µM CA for the indicated times in the presence or absence of 100 µM AICAR. Cell lysates were immunoblotted with the indicated antibodies. C, D HepG2 cells were infected with sh-SESN2 lentivirus and treated with 200 µM CDCA or 750 µM CA for 9 h in the presence or absence of 100 nM rapamycin (Rap). Cell lysates were immunoblotted with the indicated antibodies. E HepG2 cells were infected with sh-Luc or sh-TSC2 lentiviruses and treated with 200 µM CDCA for the indicated times. Cell lysates were immunoblotted with the indicated antibodies. β-Actin served as a loading control. Numbers below the immunoblot bands indicate the fold changes normalized to the control band intensities. The data are representative of at least three independent experiments.
Fig. 7
Fig. 7. Sestrin2 deficiency exacerbates NLRP3 inflammasome-mediated pyroptosis in cholestatic livers.
A, B HepG2 cells were treated with CDCA (20 to 100 µM) or CA (100 to 500 µM) for 24 h. The release of LDH was measured by an LDH assay kit. C, D HepG2 cells were infected with lentiviruses expressing shRNAs targeting luciferase (sh-Luc) or Sestrin2 (sh-SESN2) and treated with 100 µM CDCA or 500 µM CA for 24 h. The release of LDH was measured by an LDH assay kit. E, F Liver tissues were collected from Sesn2+/+ Sham, Sesn2+/+ BDL, Sesn2−/− Sham, and Sesn2−/− BDL mice (n = 5–6 mice per group) and analyzed by immunoblotting with the indicated antibodies. GAPDH served as a loading control. Band intensities were quantified and normalized to control band intensities. G qRT–PCR analysis of Nlrp3, Asc, Casp1, and Il-1β mRNA levels in liver tissues from the indicated mice (n = 5–10 mice per group). The data are representative of two (EG) or three (AD) independent experiments. *p < 0.05; **p < 0.01; ***p < 0.001; ns not significant (Student’s t test in A, B and two-way ANOVA, followed by Tukey’s (C, D) or Benjamini, Krieger, and Yekutieli’s (EG) post hoc tests).
Fig. 8
Fig. 8. Schematic illustrating the protective effect and mechanism of Sestrin2 in cholestatic liver injury.
Hepatic Sestrin2 expression is induced by ATF4 and C/EBP-β during cholestatic liver injury and thereby inhibits mTORC1 activity. Sestrin2 also suppresses NLRP3 inflammasome activation and subsequently relieves pyroptosis and inflammatory response in cholestatic livers.

References

    1. Li T, Chiang JY. Bile acids as metabolic regulators. Curr. Opin. Gastroenterol. 2015;31:159–165. - PMC - PubMed
    1. Haenel LC, Bradway WR, Costantini PJ. Thrombophlebitis complicating sternocostoclavicular hyperostosis. Postgrad. Med. 1980;68:113–115. - PubMed
    1. Zollner G, Trauner M. Mechanisms of cholestasis. Clin. Liver Dis. 2008;12:1–26. - PubMed
    1. Li T, Apte U. Bile acid metabolism and signaling in cholestasis, inflammation, and cancer. Adv. Pharm. 2015;74:263–302. - PMC - PubMed
    1. Kim S, et al. Impaired autophagy promotes bile acid-induced hepatic injury and accumulation of ubiquitinated proteins. Biochem. Biophys. Res. Commun. 2018;495:1541–1547. - PubMed

Publication types