. 2022 Mar;25(3):345-357.
doi: 10.1038/s41593-022-01021-9. Epub 2022 Mar 7.

Opponent control of behavior by dorsomedial striatal pathways depends on task demands and internal state

Affiliations

Opponent control of behavior by dorsomedial striatal pathways depends on task demands and internal state

Scott S Bolkan et al. Nat Neurosci. 2022 Mar.

Abstract

A classic view of the striatum holds that activity in direct and indirect pathways oppositely modulates motor output. Whether this involves direct control of movement, or reflects a cognitive process underlying movement, remains unresolved. Here we find that strong, opponent control of behavior by the two pathways of the dorsomedial striatum depends on the cognitive requirements of a task. Furthermore, a latent state model (a hidden Markov model with generalized linear model observations) reveals that-even within a single task-the contribution of the two pathways to behavior is state dependent. Specifically, the two pathways have large contributions in one of two states associated with a strategy of evidence accumulation, compared to a state associated with a strategy of repeating previous choices. Thus, both the demands imposed by a task, as well as the internal state of mice when performing a task, determine whether dorsomedial striatum pathways provide strong and opponent control of behavior.


Conflict of interest statement

Competing Interests

The authors declare no competing financial interests.

Figures

Extended Data Fig. 1
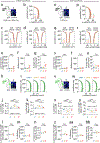
Extended Data Fig. 1. Optogenetic inhibition of DMS pathways is effective, generating little post-inhibitory rebound, nor excitation during the inhibition period
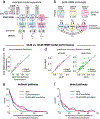
(a) Schematic of viral delivery of AAV5-eF1a-DIO-NpHR to the dorsomedial striatum (DMS) of A2a-Cre or D1R-Cre mice. (b,i) Schematic of electrophysiological recording and laser delivery (532-nm, 5-mW) to the DMS in awake, head-fixed mice ambulating on a running wheel. (b,ii) Example recording electrode tracks and cre-dependent NpHR expression in an A2a-Cre mouse targeting the indirect pathway of the DMS. (b,iii) As in b,ii but in a D1R-Cre mouse targeting the DMS direct pathway. (b,iv) Schematic of silicon optrode recording tip, including tapered optical fiber coupled to a 32-channel silicon probe. (c) Two example peristimulus time histograms (PSTH) (top) and raster plots of trial-by-trial spike times (bottom) from single neurons recorded from the DMS of an A2a-Cre mouse. Inset at top displays average spike waveform (black) and 100 randomly sampled spike waveforms (grey) for each neuron. A trial consisted of 5-s without laser (pre, −5 to 0-s), 5-s of 532-nm light (5-mW) delivery (on, 0 to 5-s), followed by a 10-s ITI (40 trials per recording site). The first 2-s following laser offset (post, 5–7-s) was used to assess post-inhibitory effects. (d) Left: Histogram of change in average firing rate (on-pre, Hz) for all neurons (n = 60) recorded from the DMS of A2a-Cre mice (n = 3). Colors indicate non-significant (black, n = 38 neurons), significantly decreased (red, n = 18 neurons) or increased (green, n = 4 neurons) changes in firing rate determined via paired, two-tailed signrank comparison of average across-trial baseline (pre) or laser (on) firing rates. A Bonferroni-corrected significance threshold was used to account for multiple neuron comparisons (p < 0.00083, or p = 0.05/60 neuron comparisons). Right: same as left but for change in firing rate (post-pre, Hz): non-significant (n = 55 neurons), significantly decreased (n = 4) or increased (n = 1). Insets display pie-chart summaries of the proportion of non-significant (black unfilled), significantly decreased (red) or increased (green) neurons. (e) Left: Mean +/− SEM z-scored firing rate across all non-significantly modulated on vs pre (black, n = 38) or significantly decreased on vs pre (red, n = 18) neurons recorded from A2a-Cre mice. Right: same as left but for all non-significantly modulated post vs pre (black, n = 55) or significantly decreased post vs pre (red, n = 4) neurons. (f) Same as c but for example neurons recorded from the DMS of D1R-Cre mice. (g) Same as d but for all neurons (n = 50) recorded from the DMS of D1R-Cre mice (n = 2). Left (on-pre): non-significant (n = 27), significantly decreased (n = 21), or increased (n = 2). Right (post-pre): non-significant (n = 46), significantly decreased (n = 2) or increased (n = 2). A Bonferroni-corrected significance threshold was used to account for multiple neuron comparisons (p < 0.001, or p = 0.05/50 neuron comparisons). (h) same as e but for neurons recorded from the DMS of D1R-Cre mice.
Extended Data Fig. 2
Extended Data Fig. 2. Non-significant motor effects of DMS pathway inhibition compared to non-opsin expressing controls during virtual corridor navigation
(a) Schematic of virtual corridor and unilateral delivery of 532-nm light (5-mW) restricted to 0–200cm. (b) Difference in average y-velocity (cm/s) during laser on and off trials (on-off) for mice receiving indirect (n = 7 mice, n = 1,712 laser off and n = 1,288 laser on trials) or direct (n = 6 mice, n = 1,088 laser off and n = 757 laser on trials) pathway inhibition of the DMS, or DMS illumination alone (no opsin; n = 5 mice, n = 1,178 laser off and n = 827 laser on trials). p-value denotes significance of one-way ANOVA of group on delta y-velocity (p = 0.98, F2,13 = 0.02). (c) Same as b but for difference in x-position (cm, on-off) contralateral to the laser hemisphere (p = 0.60, F2,13 = 0.53). (d) Same as c but for difference in view angle (deg, on-off) contralateral to the laser hemisphere (p = 0.20, F2,13 = 1.90). (e) Same as c but for difference in mean standard deviation in view angle (deg, on-off). The mean of the standard deviation in view angles sampled in 5-cm steps from 0–300 cm were calculated per trial, and then averaged across all laser off (or on) trials for a mouse (p = 0.94, F2,16 = 0.06). Indirect: n = 7 mice, n = 2,109 laser off and n = 1,574 laser on trials; direct: n = 6 mice, n = 1,330 laser off and n = 930 laser on trials; no opsin: n = 6 mice, n = 1,688 laser off and n = 1,199 laser on trials). (f) As in e but for difference in total distance travelled (cm, on-off) to complete a trial (p = 0.93, F2,16 = 0.08). (g) As in e but for the difference in percentage of trials with excess travel (defined as >10% of corridor length to reward, or >330cm) (p = 0.76, F2,18 = 0.28). Throughout solid black lines indicate mean +/− S.E.M. across mice and transparent ‘x’ denote individual mouse mean throughout.
Extended Data Fig. 3
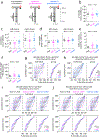
Extended Data Fig. 3. Similar motor performance across three virtual reality T-mazes
Schematic of three virtual reality (VR)-based T-mazes that differ in task requirements. (b) Average y-velocity (cm/s) of mice during the cue region (0–200cm) of the accumulation of evidence task (black, n = 32 mice, n = 52,381 trials), no distractors (ctrl #1) task (magenta: n = 32 mice, 56,783 trials), or permanent cues (ctrl #2) task (cyan: n = 20 mice, n = 27,870 trials). Solid bars denote mean +/− S.E.M. across mice while transparent ‘x’ denotes individual mouse mean. p-value denotes one-way ANOVA of task on y-velocity (p = 0.51, F2,80 = 0.67). (c) Same as b but for average x-position (cm) during the cue region (0–200cm) on left and right choice trials. p-value denotes one-way ANOVA of task on x-position (left choice: p = 0.50, F2,80 = 0.70; right choice: p = 0.37, F2,80 = 1.0). (d) Same as b but for average view angle (degrees) during the cue region (0–200cm) on left and right choice trials (left choice: p = 0.53, F2,80 = 0.64; right choice: p = 0.70, F2,80 = 0.37). (e) As in b but for average percent of trials with excess travel (defined as travel >10% of maze stem, or >330cm). Accumulation of evidence: n = 32 mice, n = 53,833 trials; control #2 (no distractors): n = 32 mice, n = 60,074 trials; control #2 (permanent cues): n = 20 mice, n = 29,192 trials. p-value denotes one-way ANOVA of task on excess travel (p = 0.06, F2,81 = 2.9). (f) As in b but for mean standard deviation in view angle (degrees) per trial (n as in e). p-value denotes one-way ANOVA of task on view angle deviation (p = 0.07, F2,81 = 2.8). (g) Average accuracy of decoding left/right choice based on the trial-by-trial x-position (cm) of mice as a function of y-position in the maze (0–300cm in 25-cm bins). Training and test trial sets were selected within individual mice (80% train, 5-fold cross-validation, re-sampled 10 times). Left: Each ‘x’ depicts decoding accuracy at each y-position bin for individual mice performing the evidence accumulation (black), no distractors (ctrl #1, magenta), or permanent cues (ctrl #2, cyan) tasks. Right: Group mean and +/−S.E.M. across mice for each task (n as in b). (h) Same as f but for average accuracy of decoding left/right choice based on the trial-by-trial view angle (degrees) of mice (n as in b). (i) Average accuracy of decoding left/right choice based on the trial-by-trial x-position (cm) of mice as a function of y-position in the maze (0–300cm in 25-cm bins). Training trial sets were randomly selected across all mice (50% total trials, re-sampled 50 times) performing either the accumulation of evidence (left, AoE, black), no distractors (middle, ctrl#1, magenta), or permanent cues (right, ctrl#2, cyan) tasks. Testing trial sets were the 50% of held-out trials in the task used for training, or all trials in the alternate tasks. Top: Each ‘x’ depicts average decoding accuracy across all training/tests sets at each y-position bin for individual mice performing the evidence accumulation (black), no distractors (ctrl #1, magenta), or permanent cues (ctrl #2, cyan) tasks. Right: Group mean and +/−S.E.M. across mice for each task (n as in a). (j) Same as I but for average accuracy of decoding left/right choice based on the trial-by-trial view angle (degrees) of mice (n as in b).
Extended Data Fig. 4
Extended Data Fig. 4. Effects of pathway-specific DMS and NAc inhibition on psychometric performance across virtual reality tasks.
(a) Schematic of unilateral indirect pathway DMS inhibition with choice defined ipsilateral or contralateral to the hemisphere receiving 532-nm laser illumination. (b) Schematic of three virtual reality based decision-making tasks (left: accumulation of evidence; middle: control #1, no distractors; right: control #2, permanent cues) and laser illumination restricted to the cue region (0–200cm). (c) Percent of contralateral choice trials as a function of the difference in sensory cues (contralateral-ipsilateral) binned in increments of 5 from −15 to 15. Transparent lines indicate individual mouse mean during laser off (grey) and on (green) trials for mice receiving indirect-pathway DMS inhibition during the evidence accumulation (black, left), no distractors (magenta, ctrl#1, middle), or permanent cues (cyan, ctrl#2, right). Thick lines indicate mean +/− S.E.M. across mice at each evidence bin during laser off (black) and on (green) trials. (d) Same as a but for mice receiving unilateral direct pathway DMS inhibition. (e) same as b. (f) Same as c but for mice receiving direct pathway DMS inhibition. (g) Same as a but for mice receiving unilateral DMS illumination in the absence of NpHR (no opsin). (h) Same as b. (i) same as c but for mice receiving unilateral DMS illumination in the absence of NpHR (no opsin). (j) Schematic of unilateral inhibition of NAc indirect (left) or direct (middle) pathway, or NAc illumination in the absence of NpHR (no opsin). (k) Schematic of accumulation of evidence task and delivery of 532-nm light during the cue region (0–200cm). (l) As in c but for psychometric comparison between groups receiving NAc indirect or direct pathway inhibition, or NAc illumination in the absence of NpHR (no opsin).
Extended Data Fig. 5
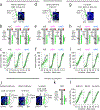
Extended Data Fig. 5. Effects of pathway-specific DMS inhibition on choice are larger in the most demanding task, and stronger than effects of pathway-specific NAc inhibition
(a) Schematic of three virtual reality based decision-making tasks (left: accumulation of evidence; middle: control #1, no distractors; right: control #2, permanent cues). (b) Schematic of unilateral indirect pathway DMS inhibition with choice defined ipsilateral or contralateral to the hemisphere receiving 532-nm laser illumination (top). Difference in choice bias (%, contralateral - ipsilateral) between laser on and off trials (on-off) in mice performing the accumulation of evidence (AoE, black), no distractors (ctrl #1, magenta), or permanent cues (ctrl #2, cyan) tasks. p-value denotes one-way ANOVA of task on delta (on-off) choice bias (p = 1.0 × 10⁻⁵, F2,22 = 20.2). Post-hoc comparisons reflect unpaired, two-tailed Wilcoxon ranksum tests on delta (on-off) choice bias (AoE, n = 11, vs ctrl #1, n = 7: p = 8.0 × 10⁻⁴, z = 3.4; AoE vs ctrl #2, n = 7: p = 0.001, z = 3.3). (c) Same as b but for direct pathway DMS inhibition. p-value denotes one-way ANOVA of task on delta (on-off) choice bias (p = 0.001, F2,23 = 9.4). Post-hoc comparisons reflect two-tailed, unpaired Wilcoxon ranksum tests (AoE, n = 10, vs ctrl #1, n = 9: p = 0.002, z = −3.0; AoE vs ctrl #2, n = 7: p = 0.005, z = −2.8). (d) Same as b but for DMS illumination in the absence of NpHR (no opsin). p-value denotes one-way ANOVA of task on delta (on-off) choice bias (p = 0.09, F2,16 = 2.8). Post-hoc comparisons reflect two-tailed, unpaired Wilcoxon ranksum tests (AoE, n= 11, vs ctrl #1, n = 4: p = 0.65, z = 0.46; AoE vs ctrl #2, n = 6: p = 0.06, z = 1.8). (e) Schema of evidence accumulation task (left), unilateral inhibition of indirect pathway in the DMS (middle left) or NAc (middle right), and delta (on-off) choice bias in mice receiving indirect pathway DMS (n = 11) or NAc (n = 9) inhibition (right). Statistical comparison reflects two-tailed, unpaired Wilcoxon ranksum test (DMS vs NAc: p = 2.6 × 10⁻⁴, z = 3.6). (f) Same as e but for direct pathway DMS (n = 10) or NAc (n = 10) inhibition. Statistical comparison reflects two-tailed, unpaired Wilcoxon ranksum test (DMS vs NAc: p = 1.8 × 10⁻⁴, z = −3.7). Throughout solid bars denote mean +/− S.E.M. across mice and transparent ‘x’ denote individual mouse means.
Extended Data Fig. 6
Extended Data Fig. 6. Inhibition of DMS pathways has limited impact on motor performance across VR-based decision-making tasks
(a) Mean +/− S.E.M. y-velocity (cm/s) as a function of y-position (0– 300cm in 25cm bins) during laser off (black) or laser on (green) trials across mice receiving DMS indirect pathway inhibition during the evidence accumulation (left: n = 11 mice, n = 16,935 laser off and n = 3,390 laser on trials), no distractors (middle, ctrl #1: n = 7 mice, n = 13,706 laser off and n = 3,288 laser on trials) or permanent cues (right, ctrl #2: n = 6 mice, n = 4,033 laser off and n = 929 laser on trials). (b) Same as a but for mice receiving direct pathway inhibition during the evidence accumulation (left: n = 10 mice, n = 14,030 laser off and n = 3,103 laser on trials), no distractors (middle, ctrl #2: n = 8 mice, n = 14,647 laser off and n = 3,682 laser on trials) or permanent cues (right, ctrl #3: n = 7 mice, n = 6,061 laser off and n = 1,494 laser on trials) tasks. (c) Same as a but for mice receiving DMS illumination in the absence of NpHR (no opsin) during the evidence accumulation (left: n = 11 mice, n = 21,422 laser off and n = 5,113 laser on trials), no distractors (middle, ctrl #1: n = 4 mice, n = 3,654 laser off and n = 901 laser on trials), or permanent cues (right, ctrl #2: n = 4 mice, n = 3,975 laser off and n = 923 laser on trials) tasks. (d) Mean +/− S.E.M. in delta (on-off) distance (cm) traveled (left) and delta (on-off) trials (%) with excess travel greater than 10% of maze stem (or >330cm) (right) in mice receiving indirect pathway inhibition during the evidence accumulation (black, n = 11 mice, n = 22,090 laser off and n = 4,378 laser on trials), no distractors (magenta, n = 7 mice, n = 14,826 laser off and n = 3,591 laser on trials), or permanent cues (n = 6 mice, n = 4,447 laser off and n = 1050 laser on trials) tasks. p-value denotes one-way ANOVA of task on delta (on-off) distance (p = 0.45, F2,22 = 0.81) or excess travel (p = 0.52, F2,22 = 0.66). (e) Same as d but for delta (on-off) distance (cm) traveled (left) or delta percent trials with excess travel (right) in mice receiving direct pathway inhibition during the evidence accumulation (black, n = 10 mice, n = 20,914 laser off and n = 4,721 laser on trials), no distractors (magenta, n = 9 mice, n = 15,778 laser off and n = 3,992 laser on trials), or permanent cues (n = 7 mice, n = 6,430 laser off and n = 1,591 laser on trials) tasks. p-value denotes one-way ANOVA of task on delta (on-off) distance (p = 0.13, F2,23 = 2.2) or excess travel (p = 0.50, F2,23 = 0.71). (f) Same as d but for delta (on-off) in distance (cm) traveled (left) or percent trials with excess travel (right) in mice receiving DMS illumination in the absence of NpHR (no opsin) during the evidence accumulation (black, n = 11 mice, n = 28,557 laser off and n = 6,772 laser on trials), no distractors (magenta, n = 5 mice, n = 4,118 laser off and n = 1,002 laser on trials), or permanent cues (n = 6 mice, n = 4,360 laser off and n = 1,038 laser on trials) tasks. p-value denotes one-way ANOVA of task on delta (on-off) distance (p = 0.06, F2,19 = 3.3) or excess travel (p = 0.23, F2,19 = 1.6). (g) Same as d but for delta (on-off) in per-trial standard deviation in view angle in mice receiving DMS indirect pathway inhibition across tasks (p = 0.34, F2,22 = 1.1, n as in d). (h) Same as g but for mice receiving DMS direct pathway inhibition across tasks (p = 0.27, F2,23 = 1.4, n as in e). (i) Same as g but for mice receiving DMS illumination (no opsin) in the absence of NpHR (p = 0.03, F2,19 = 4.3, n as in f). (j) Delta (on-off) x-position (cm) (left) or view angle (degrees) (right) during the cue region (0–200 cm) in mice receiving DMS indirect pathway inhibition during the accumulation of evidence (black), no distractors (control #1, magenta), or permanent cues (control #2, cyan) tasks (n as in a). One-way ANOVA of task on delta (on-off) x-position (p = 0.01, F2,22 = 5.6). Post-hoc, two-tailed, unpaired Wilcoxon ranksum test on delta (on-off) x-position (AoE v control #1: p = 0.2, z = 1.3; AoE v control #2: p = 0.004, z = 2.9; control #1 v control #2: p = 0.13, z = 1.5). One-way ANOVA of task on delta (on-off) view angle (p = 0.14, F2,22 = 2.2). Post-hoc, two-tailed, unpaired Wilcoxon ranksum test on delta (on-off) view angle (AoE v control #1: p = 0.58, z = 0.5; AoE v control #2: p = 0.24, z = 1.78; control #1 v control #2: p = 0.52, z = 0.6). (k) Same as j but for mice receiving DMS direct pathway inhibition (n as in b). One-way ANOVA of task on delta (on-off) x-position (p = 0.08, F2,23 = 2.8). Post-hoc, two-tailed unpaired Wilcoxon ranksum test on delta (on-off) x-position (AoE v control #1: p = 0.13, z = −1.5; AoE v control #2: p = 0.1, z = −1.6; control #1 v control #2: p = 0.46, z = −0.7). One-way ANOVA of task on delta (on-off) view angle (p = 0.02, F2,23 = 3.6). Post-hoc, two-tailed, unpaired Wilcoxon ranksum test on delta (on-off) view angle (AoE v control #1: p = 0.21, z = −1.3; AoE v control #2: p = 0.03, z = −2.1; control #1 v control #2: p = 0.24, z = −1.6). (l) Same as j but for mice receiving DMS illumination in the absence of NpHR (no opsin, n as in c). One-way ANOVA of task on delta (on-off) x-position (p = 0.24, F2,18 = 1.54). Post-hoc, two-tailed, unpaired Wilcoxon ranksum test on delta (on-off) x-position (AoE v control #1: p = 0.21, z = −1.24; AoE v control #2: p = 0.51, z = 0.06; control #1 v control #2: p = 0.04, z = 2.0). One-way ANOVA of task on delta (on-off) view angle (p = 0.23, F2,18 = 1.56). Post-hoc, two-tailed, unpaired Wilcoxon ranksum test on delta (on-off) view angle (AoE v control #1: p = 0.84, z = 0.19; AoE v control #2: p = 0.20, z = 1.2; control #1 v control #2: p = 0.24, z = 1.7). Throughout solid bars denote mean +/− S.E.M. and transparent ‘x’ indicates individual mouse mean.
Extended Data Fig. 7
Extended Data Fig. 7. Model selection and control data analyses for the GLM-HMM
(a) Comparison of the log-likelihood of the data using GLM-HMMs with different numbers of states for mice inhibited in the DMS direct pathway (dark gray), or indirect pathway (light gray), and mice without DMS opsin (black). All values are relative to the log-likelihood of the standard GLM (1-state GLM-HMM). Values are calculated in bits per session (see Methods). Solid curves denote mean +/− S.E.M. of five different test sets. Held-out data for test sets was selected as a random 20% of sessions, using the same number of sessions for each mouse. (b) Same as a but with different numbers of previous choice covariates using a 3-state GLM-HMM. (c) Comparison of the log-likelihood of simulated data using GLM-HMMs with different numbers of states. Data was simulated from a 2-state GLM-HMM that had been fit to data for mice inhibited in the indirect pathway of the DMS and then cross-validation performed either on the entire simulated dataset (~54000 trials, left) or a subset of 5% of the data (2600 trials, right). All values are relative to the log-likelihood of the 1-state GLM. Values are calculated in bits per session (see Methods). Solid curves denote the average of five different test sets. Held-out data for test sets was selected as a random 20% of sessions. Performing cross validation on a small subset of the data serves to demonstrate that the log-likelihood does in fact decrease as the model starts to overfit. This is difficult to see with large datasets where overfitting is less of a concern and therefore the log-likelihood begins to flatten rather than decrease. (d) Fitted GLM weights for the 4-state model using aggregated data from all mice inhibited in the indirect pathway of the DMS. Error bars denote (+/−1) posterior standard deviation for each weight. The magnitude of the weight represents the relative importance of that covariate in predicting choice, whereas the sign of the weight indicates the side bias. (e) Same as d but for mice inhibited in the DMS direct pathway. (f) GLM weights fitted to a concatenated data set consisting of the indirect, direct, and control (no opsin) groups. Solid lines on the left connect covariates that are shared across groups. Horizontal marks on the right denote laser weights, which were learned separately for each group. Error bars denote the posterior standard deviation of each weight. (g) Percent of contralateral choice based on the difference in contralateral versus ipsilateral cues in each trial for mice in the control (no opsin) group. To compute psychometric functions, trials were assigned to each state by taking the maximum of the model’s posterior state probabilities on each trial. Error bars denote +/−1 S.E.M. for light off (solid) and light on (dotted) trials. Solid curves denote logistic fits to the concatenated data across mice for light off (solid) and light on (dotted) trials. (h) Same as f but for data simulated from the model fit to mice in the control group (see Methods).
Extended Data Fig. 8
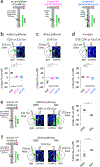
Extended Data Fig. 8. GLM-HMM state 3 is associated with indicators of task disengagement
(a) The mean posterior probability of each state over the first and last 50 trials of a session, averaged across all sessions for mice inhibited in the indirect pathway of the DMS (n=271 sessions). (b) Same as a but for mice receiving DMS direct pathway inhibition (n=266 sessions). (c) Mean +/− S.E.M. of the cumulative reward received in a session prior to transitions into state 1 (n = 142), state 2 (n = 85), or state 3 (n = 237) in indirect pathway mice. One-way ANOVA of transition state on cumulative reward (p = 1.0 × 10⁻⁶; F2,460 = 14.2). Unpaired, two-tailed Wilcoxon ranksum comparison between transition types (state 1 vs 2: p = 0.96, z = −0.03; state 2 vs 3: p = 0, z = −3.6; state 1 vs 3: p = 0, z = −4.5). (d) Mean +/− S.E.M. of the reward rate (uL/min) in a session prior to transitions into each state for indirect pathway mice. Reward rate was calculated as the sum of reward received from the start of the session up to the transition trial divided by the sum of the duration of all trials from the start of the session up to the transition trial. One-way ANOVA of transition state on reward rate (p = 4.1 × 10⁻¹⁴; F2,460 = 32.9). Unpaired, two-tailed Wilcoxon ranksum comparison between transition types (state 1 vs 2: p = 0.55, z = −0.6; state 2 vs 3: p = 0, z = −4.9; state 1 vs 3: p = 0, z = −7.4). (e) Same as c but for direct pathway mice (state 1: n = 140; state 2: n = 29; state 3: n = 159). One-way ANOVA of transition state on cumulative reward (p = 0.14; F2,325 = 1.99). Unpaired, two-tailed Wilcoxon ranksum comparison between transition types (state 1 vs 2: p = 0.35, z = −0.9; state 2 vs 3: p = 0.78, z = −0.27; state 1 vs 3: p = 0.08, z = −1.74). (f) Same as d but for direct pathway mice. One-way ANOVA of transition state on reward rate (p = 8.7 × 10⁻¹⁰; F2,325 = 22.6). Unpaired, two-tailed Wilcoxon ranksum comparison between transition types (state 1 vs 2: p = 0.49, z = 0.69; state 2 vs 3: p = 0.0, z = −4.2; state 1 vs 3: p = 0.0, z = −5.9). (g) The mean posterior probability of each state aligned +/− 25 trials to trials in which reward was received for indirect pathway mice. (h) Same as g but state probability aligned to trials with excess travel (defined as 10% greater than the maze stem, or 330cm). (i) Same as g but for direct pathway mice. (j) Same as h but for direct pathway mice.
Extended Data Fig. 9
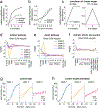
Extended Data Fig. 9. Model simulations recapitulate transition and state characteristics of real data
(a) Transition probabilities of the model fit to data from mice inhibited in the DMS indirect pathway (black) and from five simulated datasets generated from the model fit to mice inhibited in the indirect pathway of the DMS (gray), shown separately for diagonal (left) and off-diagonal (right) probabilities. (b) Same as a but for mice inhibited in the direct pathway of the DMS. (c) The posterior probability of each state over the first and last 50 trials of a session, averaged across all sessions for mice inhibited in the indirect pathway of the DMS (n=271). Dark lines denote average for real data (same as Fig. 7E) and faded lines indicate averages for each of the five simulations. (d) Same as c but for mice inhibited in the direct pathway of the DMS (dark lines are the same as shown in Fig. 7F). (e) Dwell times showing the average consecutive number of trials that mice inhibited in the DMS indirect pathway spent in each state for real data (left; range 39–86 trials, average session length 202 trials, same as shown in Fig. 7g) and one simulated dataset (right; range 60–71 trials, average session length 202 trials). Black dots show averages for individual mice (n=13). We removed the last run in each session (including any run that lasted the entire session length) from the analysis, as the termination of the session prematurely truncated the length of those runs. (f) Same as e but without removing the last run in each session for real data (left; range 51–118 trials, average session length 202 trials) and one simulated dataset (right; range 65–93 trials, average session length 202 trials). (g) Same as e but for mice inhibited in the direct pathway of the DMS for real data (left; range 52–59 trials, average session length 185 trials, same as shown in Fig. 7g) and one simulated dataset (right; range 61–66 trials, average session length 185 trials). Black dots show averages for individual mice (n=13). (h) Same as g but without removing the last run in each session for real data (left; 67–89 trials, average session length 185 trials) and one simulated dataset (right; range 74–110 trials, average session length 185 trials).
Extended Data Fig. 10
Extended Data Fig. 10. Comparison of motor performance across GLM-HMM states with and without pathway-specific DMS inhibition
(a) Schematic denoting analysis of motor performance across GLM-HMM states on laser off trials only (panels b-g) in mice unilaterally coupled to a fiberoptic for indirect pathway inhibition. (b) Average y-velocity (cm/s) during laser off trials as a function of y-position in the maze (0–300 cm in 25-cm bins) in indirect pathway mice across GLM-HMM states (state 1, blue: n = 13,394 trials; state 2, yellow: n = 13,570 trials; state 3, red: n = 16,982 trials). (c) As in b but for average x-position (cm) on ipsilateral or contralateral choice trials (n as in b). (d) As in c but for average view angle (degrees) on ipsilateral and contralateral choice trials (n as in b). (e) Mean per-trial standard deviation in view angle during laser off trials across GLM-HMM states (state 1, blue: n = 13,854 trials; state 2, yellow: n = 14,201 trials; state 3, red: n = 18,258 trials). p-value denotes one-way repeated measures ANOVA of state on view angle deviation (p = 0.06, F2,24 = 3.2). (f) As in e but for average distance traveled (cm) per trial. p-value denotes one-way repeated measures ANOVA of state on distance (p = 0.02, F2,24 = 5.0, n as in e). (g) As in e but for average percent of trials with excess travel. p-value denotes one-way repeated measures ANOVA of state on excess travel (p = 0.0004, F2,24 = 10.9, n as in e). (h) Schematic denoting analysis of effects of indirect pathway DMS inhibition on motor performance across GLM-HMM states in i-n. (i) As in b but for average y-velocity on laser off (black) or laser on (green) trials across GLM-HMM states (n of laser off trials as in b-g, n of laser on trials: state 1, blue: n = 2,302 trials; state 2, yellow: n = 1,858 trials; state 3, red: n = 3,005 trials). (j) As in c but for delta (on-off) x-position (cm) during the cue region (0–200cm) across GLM-HMM states in mice with indirect pathway inhibition. p-value denotes one-way repeated measures ANOVA of state on delta x-position (p = 3.2×10⁻⁴, F2,24 = 11.4, n as in i). Post-hoc comparisons reflect two-tailed, paired Willcoxon signed rank tests between states (state 1 vs state 3: p = 0.07, z = 1.7; state 1 vs state 2: p = 0.006, z = 2.7; state 2 vs state 3: p = 0.03, z = 2.4). (k) As in j but for delta (on-off) view angle (degrees). p-value denotes one-way repeated measures ANOVA of state on delta view angle (p = 1.2×10⁻⁵, F2,26 = 18.7, n as in i). Post-hoc comparisons reflect two-tailed, paired Willcoxon signed rank tests between states (state 1 vs state 3: p = 0.009, z = 2.6; state 1 vs state 2: p = 0.001, z = −3.18; state 2 vs state 3: p = 0.002, z = −3.1). (l) Same as e but for delta (on-off) mean per-trial view angle standard deviation across GLM-HMM states in mice with indirect pathway inhibition (n of laser off trials as in e-g, n of laser on trials: state 1, blue: n = 2,887 trials; state 2, yellow: n = 2,713 trials; state 3, red: n = 2,970 trials). p-value denotes one-way repeated measures ANOVA of state on delta view angle deviation (p = 0.97, F2,24 = 0.03, n as in l). (m) Same as f but for delta (on-off) in mean per-trial distance (cm) traveled across GLM-HMM states with indirect pathway inhibition (p = 0.68, F2,24 = 0.38, n as in l). (n) Same as g but for delta (on-off) in percent of trials with excess travel across GLM-HMM states with direct pathway inhibition (p = 0.08, F2,24 = 2.8, n as in l). (o) As in a but schematic denoting analysis of motor performance across GLM-HMM states on laser off trials only in mice unilaterally coupled to a fiberoptic for direct pathway inhibition in p-u. (p) As in b but for y-velocity (cm/s) on laser off trials across GLM-HMM states in direct pathway mice (state 1, blue: n = 12,294 laser off and n = 2,302 laser on trials; state 2, yellow: n = 9,201 laser off and n = 1,858 laser on trials; state 3, red: n = 16,239 laser off and n = 3,005 laser on trials). (q) As in c but x-position (cm) for direct pathway mice (n as in p). (r) As in d but for view angle (degrees) for direct pathway mice (n as in p). (s) As in e but for mean per-trial view angle standard deviation across GLM-HMM states in direct pathway mice (state 1, blue: n = 13,403 laser off and n = 2,508 laser on trials; state 2, yellow: n = 9,555 laser off and n = 1,969 laser on trials; state 3, red: n = 18,292 laser off and n = 3,450 laser on trials). p-value denotes one-way repeated measures ANOVA of state on per-trial view angle standard deviation (p = 0.12, F2,24 = 2.3). (t) As in f but for distance (cm) in direct pathway mice (p = 0.1, F2,24 = 2.5). (u) As in g but for percent trials with excess travel in direct pathway mice (p = 0.14, F2,24 = 2.1). (v) As in h but schematic denoting analysis of effects of direct pathway DMS inhibition on motor performance across GLM-HMM states in w-bb. (w) As in i but for the mean y-velocity (cm/s) on laser on (green) and off (black) trials across GLM-HMM states in direct pathway mice. (x) As in j but for the delta (on-off) x-position (cm) across GLM-HMM states in direct pathway mice. p-value denotes one-way repeated measures ANOVA of state on delta x-position (p = 7.9×10⁻⁵, F2,24 = 14.9). Posthoc comparisons reflect two-tailed, paired Willcoxon signed rank tests between states (state 1 vs state 3: p = 0.06, z = 1.8; state 1 vs state 2: p = 0.005, z = 2.8; state 2 vs state 3: p = 0.005, z = 2.8). (y) As in k but for delta (on-off) view angle (degrees) across GLM-HMM states in direct pathway mice. p-value denotes one-way repeated measures ANOVA of state on delta view angle (p = 2.6×10⁻⁴, F2,24 = 12.3). Posthoc comparisons reflect two-tailed, paired Willcoxon signed rank tests between states (state 1 vs state 3: p = 0.03, z = 2.3; state 1 vs state 2: p = 0.003, z = 2.98; state 2 vs state 3: p = 0.03, z = 2.1). (z) As in l but for delta (on-off) mean per-trial view angle standard deviation (degrees) in direct pathway mice (p = 0.40, F2,24 = 0.94, n as in s-u). (aa) as in m but for delta (on-off) in mean distance (cm) traveled in direct pathway mice (p = 0.43, F2,24 = 0.89). (bb) as in n but for delta (on-off) in percent trials with excess travel in direct pathway mice (p = 0.90, F2,24 = 0.1). Throughout solid colored bars denote mean +/− S.E.M. while transparent grey lines reflect individual mouse mean.
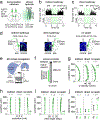
Figure 1 |
Figure 1 |. Pathway-specific DMS inhibition has no detectable impact on movement in mice navigating a virtual corridor.
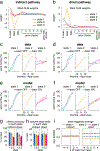
(a) Schematic of viral delivery of Cre-dependent halorhodopsin (NpHR) to the dorsomedial striatum (DMS) of A2a-Cre, D2R-Cre, or D1R-Cre mice (left). Schematic of optrode (right): a 32-channel silicon probe coupled with tapered optical fiber, which delivered 532-nm (5-mW) light to the DMS of awake, ambulating mice. (b) Example peristimulus time histograms (PSTH) (top) and rasters of trial-by-trial spike times (bottom) from a DMS single-unit recorded in an ambulating A2a-Cre mouse expressing Cre-dependent NpHR (indirect pathway). Inset: average spike waveform (black) and 100 randomly sampled spike waveforms (grey). A trial consisted of 5-s without laser (pre, −5 to 0-s), 5-s laser sweep (on, 0 to 5-s), and 10-s ITI (40 total trials). (c) As in b but for DMS single-unit in a D1R-Cre mouse expressing Cre-dependent NpHR (direct pathway). (d) Schematic of bilateral fiberoptic implantation of DMS and unilateral illumination in behaving mice, with example histology from a mouse expressing NpHR in the indirect (left, D2R-/A2a-Cre) or direct (middle, D1R-Cre) pathways, or control mouse without opsin (right, no opsin, A2a-/D2R- or D1R-Cre). 532-nm light (5-mW) was delivered unilaterally to the left or right hemisphere on alternate testing sessions and lateralized behavior was defined as ipsilateral or contralateral relative to the laser hemisphere. (e) Schematic of head-fixation of mice in a virtual reality (VR) apparatus allowing 2-D navigation. Displacements of an air-suspended spherical ball in the anterior-posterior (and medial-lateral) axes of the mouse controlled y- (and x-) position movements in a visual VR environment. (f) Schematic of virtual corridor 6-cm in width and 330-cm in length, consisting of a start region (−10–0cm), an inhibition region (0–200cm) in which mice received unilateral 532-nm light on a random subset of trials (30%), a reward location (310cm) where mice received reward, and a teleportation location (320cm) where mice were transported to the start region following a variable ITI with mean of 2-s. (g) Average y-velocity (cm/s) across mice as a function of y-position (0–300cm in 25-cm bins) while navigating the virtual corridor on laser off (black) or laser on (green) trials in groups receiving DMS indirect (left, n = 7 mice, n = 1,712 laser off and n = 1,288 laser on trials) or direct pathway inhibition (middle, n = 6 mice, n = 1,088 laser off and n = 757 laser on trials), or illumination of the DMS in the absence of NpHR expression (right, no opsin, n = 5 mice, n = 1,178 laser off and n = 827 laser on trials). (h) Same as g but for average x-position (cm) contralateral to the unilaterally-coupled laser hemisphere. (i) Same as g but for view angle (degrees, contralateral to laser hemisphere). (j) Average across-mouse distance travelled (cm) to traverse the virtual corridor during laser off (black) or laser on (green) trials for mice receiving DMS indirect (n = 7 mice, n = 2,109 laser off and n = 1,574 laser on trials) or direct pathway inhibition (n = 6 mice, n = 1,330 laser off and n = 930 laser on trials), or DMS illumination in the absence of NpHR (n = 6 mice, n = 1,688 laser off and n = 1,199 laser on trials). Solid bars depict mean +/−S.E.M. across mice; grey lines indicate individual mouse mean.
Figure 2 |
Figure 2 |. A set of virtual reality T-mazes have similar sensory features and identical motor requirements but different cognitive demands.
(a) Schematic of three virtual reality (VR)-based T-maze tasks. (b) Example mouse perspective at the same maze position (−10cm, 120cm, 195cm, and 295cm) from the example trial depicted in a of the evidence accumulation (left, black), no distractors (middle, ctrl #1), or permanent cues (right, ctrl #2) tasks. (c) Average choice accuracy (% correct) across mice performing the accumulation of evidence (black, n = 32 mice, n = 52,381 trials), no distractors (magenta, ctrl #1: n = 31 mice, n = 56,783 trials), or permanent cues (cyan, ctrl #2: n = 20 mice, n = 27,870 trials) tasks. p-value denotes one-way ANOVA of task on accuracy (p = 1.3 × 10⁻²³, F2,80 = 109.4). Asterisks indicate statistical significance of post-hoc, unpaired, two-tailed ranksum comparisons of accuracy between groups (top to bottom: ***p = 3.9 × 10⁻⁷, z = −5.1; ***p = 2.1 × 10⁻¹¹, z = −6.7; ***p = 2.1 × 10⁻⁵, z = 4.3). (d) Average y-velocity (cm/s) across mice as a function of y-position (0–300 cm in 25cm bins) during performance of each task (colors and n as in c). (e) Same as d but for average x-position (cm) on left and right choice trials. (f) Same as d but for average view angle (degrees) on left and right choice trials. (g) Average distance (cm) traveled per trial across mice (evidence accumulation, n = 32 mice, n = 53,833 trials; no distractors (control #1): n = 32 mice, n = 60,074 trials; permanent cues (control #2): n = 20 mice, n = 29,192 trials). p-value reflects one-way ANOVA of task on distance (p = 0.16, F2,81 = 1.8). Throughout solid bars denote across mouse mean values +/−S.E.M. and transparent ‘x’ indicate individual mouse mean.
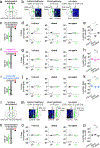
Figure 3 |
Figure 3 |. Inhibition of DMS but not NAc pathways has strong and opposing influence on choice during an evidence accumulation task, while having weaker effects during task variants with diminished cognitive demands.
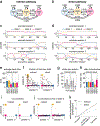
(a) Schematic of bilateral viral delivery of Cre-dependent NpHR to the dorsomedial striatum (DMS). (b) Schematic of bilateral fiberoptic implantation of the DMS and unilateral inhibition in behaving mice, with example histology from a mouse expressing NpHR in the indirect (left, D2R-/A2a-Cre) or direct (middle, D1R-Cre) pathways, or DMS illumination in the absence of NpHR (right, no opsin, A2a-/D2R- or D1R-Cre). 532-nm light (5-mW) was delivered unilaterally to the left or right hemisphere on alternate testing sessions and choice bias contralateral or ipsilateral to the hemisphere of inhibition was quantified. (c) Schematic of the evidence accumulation task with delivery of 532-nm light restricted to the cue region (0–200cm) on a random subset of trials (10–20%). (d) Average across mouse choice bias during the evidence accumulation task. Choice bias was defined as the difference between percent correct performance on trials when the correct choice was contralateral or ipsilateral to the inhibited hemisphere (% correct, contralateral-ipsilateral, positive values indicate a contralateral bias). Bias was calculated separately on laser off (black) and laser on (green) trials for mice receiving unilateral indirect pathway inhibition (left, n = 11 mice, n = 16,935 laser off and n = 3,390 laser on trials), unilateral direct pathway inhibition (middle: n = 10 mice; n = 14,030 laser off and n = 3,103 laser on trials), or unilateral illumination of the DMS in the absence of NpHR (right, n = 11 mice, n = 21,422 laser off and n = 5,113 laser on trials). (e) Difference in contralateral choice bias (% correct, contralateral-ipsilateral) between laser off and on trials (% bias, on-off) in mice performing the evidence accumulation task and receiving indirect pathway inhibition, direct pathway inhibition, or DMS illumination in the absence of NpHR. Asterisks indicate significance of unpaired, two-tailed Wilcoxon ranksum comparison of indirect to no opsin: ***p = 1.1×10⁻⁴, z = 3.9; direct to no opsin: ***p = 2.2×10⁻⁴, z = −3.7). (f-h) Same as c-e but for the no distractors (control #1) task. Indirect: n = 7 mice, n = 13,706 laser off and n = 3,288 laser on trials; direct: n = 9 mice, n = 14,647 laser off and n = 3,682 laser on trials; no opsin: n = 4 mice, n = 3,654 laser off and n = 901 laser on trials. Asterisks indicate significance of unpaired, two-tailed Wilcoxon ranksum comparison of indirect to no opsin: not significant (n.s.), p = 0.22, z = 1.2. Direct to no opsin: not significant (n.s.), p = 0.08, z = −1.8. (i-k) As in c-e but for the permanent cues (control #2) task. Indirect: n = 7 mice, n = 4,033 laser off and n = 929 laser on trials; direct: n = 7 mice, n = 6,061 laser off and n = 1,494 laser on trials; no opsin: n = 6 mice, n = 3,975 laser off and n = 923 laser on trials. Asterisks indicate significance of unpaired, two-tailed Wilcoxon ranksum comparison of indirect to no opsin: not significant (n.s.), p = 0.13, z = 1.5. Direct to no opsin: not significant (n.s.), p = 0.62, z = 0.5. (l) As in a but for bilateral viral delivery of Cre-dependent NpHR to the nucleus accumbens (NAc). (m) Same as b but for bilateral fiberoptic implantation of the NAc and unilateral inhibition in behaving mice, with example histology from a mouse expressing NpHR in the indirect (left, D2R-/A2a-Cre) or direct (middle, D1R-Cre) pathways, or NAc illumination in the absence of NpHR (right, no opsin, A2a-/D2R- or D1R-Cre). (n-p) As in c but for pathway-specific NAc inhibition during the accumulation of evidence task. Indirect: n = 9 mice, n = 11,978 laser off and n = 2,604 laser on trials; direct: n = 10 mice, n = 15,430 laser off and n = 3,348 laser on trials; no opsin: n = 7 mice, n = 9,819 laser off and n = 1,488 laser on trials. Asterisks indicate significance of unpaired, two-tailed Wilcoxon ranksum comparison of indirect to no opsin: not significant (n.s.), p = 0.86, z = 0.18; direct to no opsin: not significant (n.s.), p = 0.04, z = 2.0. Throughout solid bars denote across mouse mean values +/−S.E.M. and transparent ‘x’ indicate individual mouse mean. To account for multiple group comparisons we considered p-values significant after Bonferroni correction (2 comparisons).
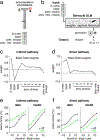
Figure 4 |
Figure 4 |. A GLM reveals that sensory evidence, DMS pathway inhibition, and trial history predict choice during the evidence accumulation task, but does not precisely recapitulate the shape of the psychometric curve.
(a) Schematic of the evidence accumulation task and the coding of the external covariates for an example trial. (b) Schematic of the Bernoulli GLM for an example trial, showing the relationship between external covariates (inputs) and choice on each trial. On each trial, a set of GLM weights maps each input (Δ cues, laser, bias, previous choice, and existence of a previous rewarded choice) to the probability of each outcome through a sigmoid function, which gives the probability of a “righward” choice on the current trial. (c) Fitted GLM weights using aggregated data from all mice in the indirect pathway DMS inhibition group. The magnitude of each weight indicates the relative importance of that covariate in predicting choice, whereas the sign of the weight indicates the direction of the effect (e.g. a negative laser weight indicates that if inhibition is in the right hemisphere, the mice will be more likely to turn left, while a positive weight on previous choice indicates that if the previous choice was to the right, in the current trial this will bias the mice to turn right again). Error bars denote (+/−1) posterior standard deviation credible intervals. (d) Same as c but for mice receiving DMS direct pathway inhibition. (e) Fraction of contralateral choice trials as a function of the difference in contralateral versus ipsilateral cues for laser off (black) and on (green) trials, for mice receiving indirect pathway DMS inhibition for the data (left) and for simulations of the model (right). Error bars denote 95% confidence intervals around the fraction of choices in each bin of the data; solid curves denote logistic fits (n=13 mice, n = 46,313 laser off and n = 8,570 laser on trials). (f) Same as e but for the mice receiving direct pathway inhibition of the DMS (n=13 mice, n = 41,250 laser off and n = 7,927 laser on trials).
Figure 5 |
Figure 5 |. A GLM-HMM better explains choice during the evidence accumulation task than the GLM, particularly on trials with DMS pathway inhibition.
(a) Example sequence of 3 trials of the evidence accumulation task, showing the relationship between external covariates (inputs), latent state, and choice on each trial. On each trial, the latent state defines which GLM weights map inputs (Δ cues, laser, previous choice, and previous rewarded choice) to the probability of choosing right or left. The transition probability P governs the probability of changing states between trials. See Methods for information on how the inputs were coded. (b) Schematic of GLM-HMM. The model has 3 latent states with fixed probabilities of transitioning between them. Each state is associated with a distinct decision-making strategy, defined by a mapping from external covariates, or inputs, such as Δ cues, to choice probability. (c) Cross-validated log-likelihood demonstrating the increased performance of the GLM-HMM over a standard Bernoulli GLM on held-out sessions. Dots represent model performance for individual mice (n=13 for each group). (d) Same as c but showing prediction accuracy as a fraction of the choices correctly predicted by each model across all trials (left) or on the subset of trials when the laser was on (right). (e) Histograms showing the number of consecutive laser trials for which the animal’s choice was in the same direction as the expected biasing effect of the laser (i.e. a choice contralateral to the laser hemisphere during DMS indirect pathway inhibition). Data (black), GLM simulation (blue), GLM-HMM simulation (pink). For the simulations, data of the same length as the real data was generated 100 times and the resulting histograms averaged. Curves denote smoothed counts using a sliding window average (window size = 3 bins). Shaded regions around the GLM and GLM-HMM curves indicate 95% confidence intervals. (f) Same as e but for mice receiving direct pathway inhibition of the DMS, therefore laser-biased choices are defined as those ipsilateral to the hemisphere of inhibition.
Figure 6 |
Figure 6 |. A GLM-HMM uncovers states during the evidence accumulation task with different weighting on sensory evidence, choice history, and DMS pathway inhibition.
(a) Fitted GLM weights for 3-state model from mice in the indirect pathway DMS inhibition group. Error bars denote (+/−1) posterior standard deviation for each weight. The magnitude of the weight represents the relative importance of that covariate in predicting choice, whereas the sign of the weight indicates the side bias (e.g. a negative laser weight indicates that if inhibition is in the right hemisphere, the mice will be more likely to turn left, while a positive weight on previous choice indicates that if the previous choice was to the right, in the current trial this will bias the mice to turn right again). (b) Same as a but for the direct pathway group. (c) Fraction of contralateral choices as a function of the difference in contralateral versus ipsilateral cues in each trial for mice in the indirect pathway inhibition group. To compute psychometric functions, trials were assigned to each state by taking the maximum of the model’s posterior state probabilities on each trial. Error bars denote +/−1 SEM for light off (solid) and light on (dotted) trials. Solid curves denote logistic fits to the concatenated data across mice for light off (solid) and light on (dotted) trials. (d) Same as c but for the mice receiving direct pathway inhibition of the DMS. (e) Same as c but for data simulated from the model fit to mice receiving indirect pathway inhibition of the DMS (see Methods). (f). Same as e but for mice receiving direct pathway inhibition of the DMS. (g) Performance in each state for mice receiving DMS inhibition in the indirect pathway (left) and direct pathway (right), shown as the percentage of total trials assigned to that state in which the mice made the correct choice. Colored bars denote the average performance across all mice. Black dots show averages for individual mice (n=13 mice for both groups). (h) Percentage of laser-on trials that the model assigned to each state for mice receiving DMS inhibition in the indirect pathway (left) and direct pathway (right). Colored bars denote the average performance across all mice. Black dots show averages for individual mice (n=13 mice for both groups). (I) The posterior probability of each state for the five trials before and after a laser-on trial, averaged across all such periods (n=8570, indirect; n=7927, direct).
Figure 7 |
Figure 7 |. Diversity across sessions in the timing and number of GLM-HMM state transitions.
(a) Transition probabilities for the indirect pathway group. (b) Same as a but for the direct pathway group. (c) The posterior probability of being in each state for each trial for 3 example sessions from a mouse in the indirect pathway group. (d) Same as c but for two mice from the direct pathway group. (e) Dwell times showing the average consecutive number of trials that the mice spent in each state for mice with indirect (left; range 39–86 trials, average session length 202 trials) and direct (right; range 52–59 trials, average session length 185 trials) pathway inhibition. Black dots show averages for individual mice (n=13 mice for both groups). (f). The fraction of trials that the mice spent in each state in each session. Each dot represents an individual session (n=271, indirect pathway; n=266, direct pathway). Color-coding reinforces the state composition of each session (e.g. blue indicates the mouse spent 100% of the session in state 1). A small amount of Gaussian noise was added to the position of each dot for visualization purposes. Grey arrows identify the example sessions shown in c and d. (g) The fraction of sessions in which the mice entered one, two, or all three states. Gray bars denote the average fraction of sessions for all mice. Black dots show averages for individual mice (n=13 mice for both groups). (h) Time spent in each state represented as a percentage of total trials for mice inhibited in the indirect pathway (left) and direct pathway (right). Colored bars denote the average state occupancies across all mice. Black dots show averages for individual mice (n=13 mice both groups). (i) Same as f except state assignments were obtained from a model in which the transition probabilities were restricted to disallow transitions between states (i.e. all off-diagonal transition probabilities equal zero; see Methods). (j) Same as f except state assignments were obtained from a model in which transitions were disallowed between state 2 and the other states. (k) Comparison of the cross-validated log-likelihood of the data when fitting GLM-HMMs with the reduced models from i and j, relative to the log-likelihood of the full model, in bits per session.

Comment in

Similar articles

Cited by

References

    1. Alexander GE & Crutcher MD Functional architecture of basal ganglia circuits: neural substrates of parallel processing. Trends Neurosci. 13, 266–271 (1990). - PubMed
    1. Kravitz AV et al. Regulation of parkinsonian motor behaviours by optogenetic control of basal ganglia circuitry. Nature 466, 622–626 (2010). - PMC - PubMed
    1. Roseberry TK et al. Cell-Type-Specific Control of Brainstem Locomotor Circuits by Basal Ganglia. Cell 164, 526–537 (2016). - PMC - PubMed
    1. Bartholomew RA et al. Striatonigral control of movement velocity in mice. Eur. J. Neurosci 43, 1097–1110 (2016). - PubMed
    1. Bakhurin KI et al. Opponent regulation of action performance and timing by striatonigral and striatopallidal pathways. eLife 9, e54831 (2020). - PMC - PubMed

METHODS REFERENCES

    1. Aronov D & Tank DW Engagement of Neural Circuits Underlying 2D Spatial Navigation in a Rodent Virtual Reality System. Neuron 84, 442–456 (2014). - PMC - PubMed
    1. Hanks TD et al. Distinct relationships of parietal and prefrontal cortices to evidence accumulation. Nature 520, 220–223 (2015). - PMC - PubMed
    1. Wichmann FA & Hill NJ The psychometric function: I. Fitting, sampling, and goodness of fit. Percept. Psychophys 63, 1293–1313 (2001). - PubMed
    1. Pillow JW, Ahmadian Y & Paninski L Model-based decoding, information estimation, and change-point detection techniques for multineuron spike trains. Neural Comput. 23, 1–45 (2011). - PubMed
    1. Bishop CM Pattern Recognition and Machine Learning (Information Science and Statistics). (Springer-Verlag, 2006).

Publication types

LinkOut - more resources