. 2022 Mar;25(3):306-316.
doi: 10.1038/s41593-022-01022-8. Epub 2022 Mar 8.

Dissection of artifactual and confounding glial signatures by single-cell sequencing of mouse and human brain

Affiliations

Dissection of artifactual and confounding glial signatures by single-cell sequencing of mouse and human brain

Samuel E Marsh et al. Nat Neurosci. 2022 Mar.

Erratum in

Abstract

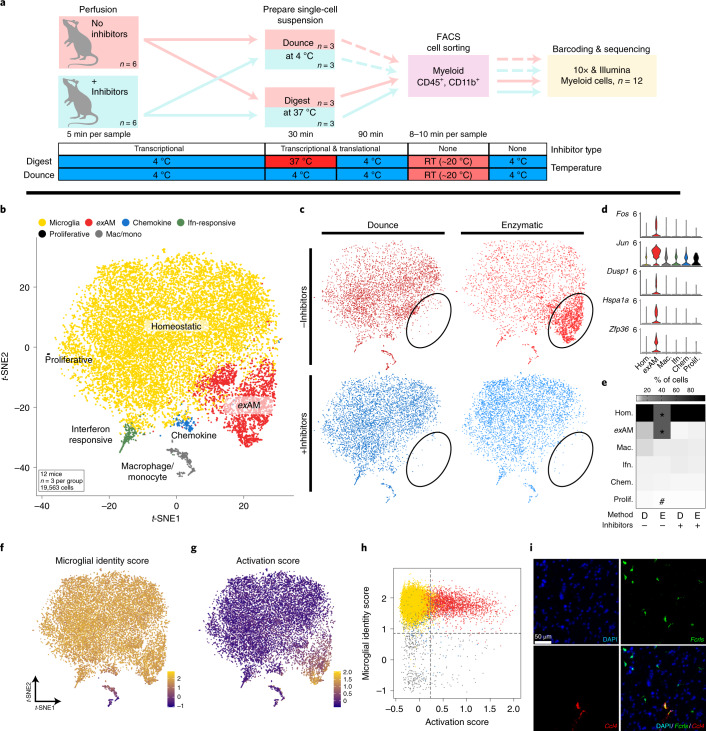
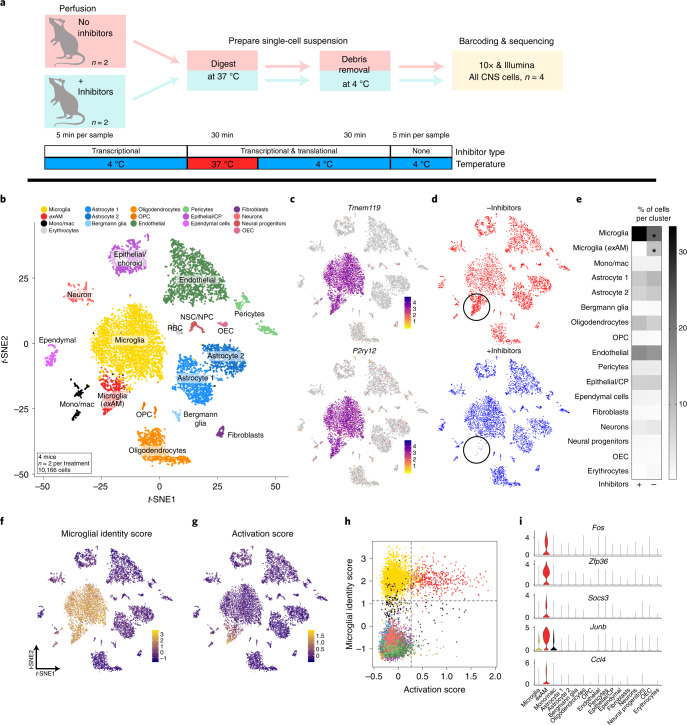
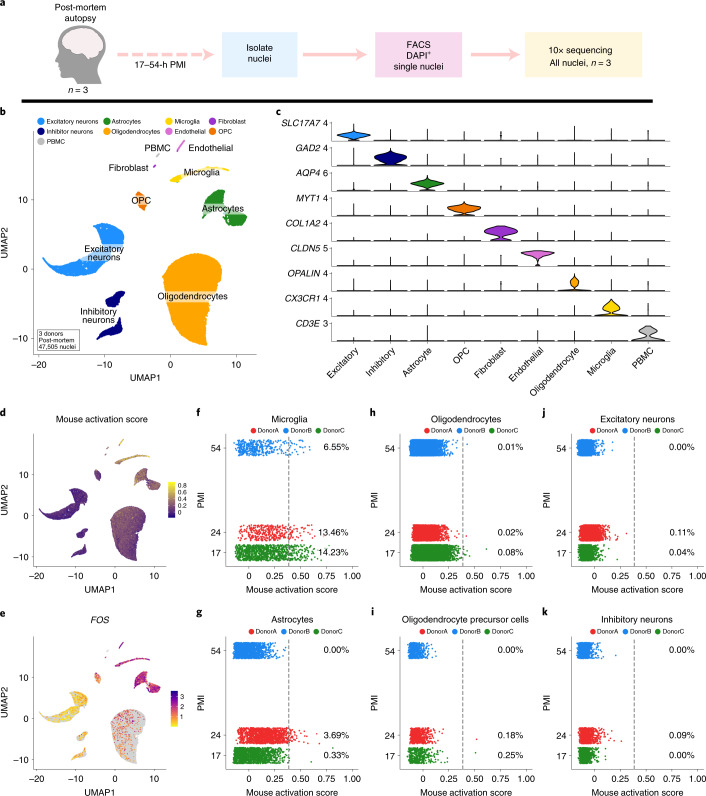
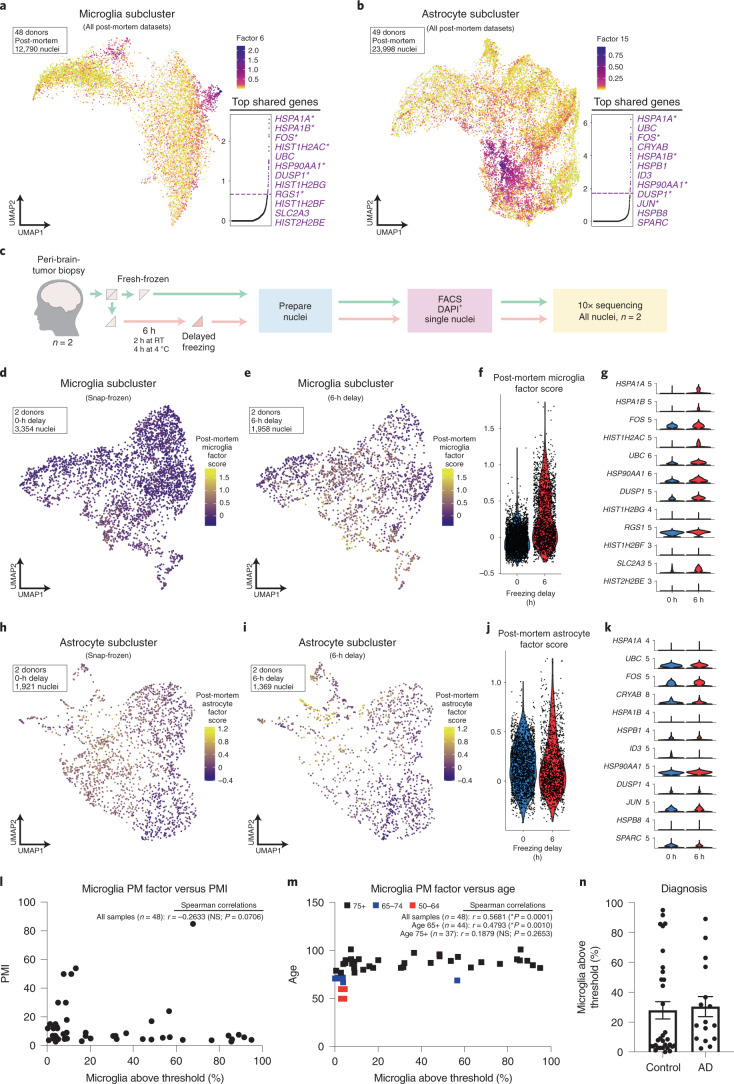
A key aspect of nearly all single-cell sequencing experiments is dissociation of intact tissues into single-cell suspensions. While many protocols have been optimized for optimal cell yield, they have often overlooked the effects that dissociation can have on ex vivo gene expression. Here, we demonstrate that use of enzymatic dissociation on brain tissue induces an aberrant ex vivo gene expression signature, most prominently in microglia, which is prevalent in published literature and can substantially confound downstream analyses. To address this issue, we present a rigorously validated protocol that preserves both in vivo transcriptional profiles and cell-type diversity and yield across tissue types and species. We also identify a similar signature in postmortem human brain single-nucleus RNA-sequencing datasets, and show that this signature is induced in freshly isolated human tissue by exposure to elevated temperatures ex vivo. Together, our results provide a methodological solution for preventing artifactual gene expression changes during fresh tissue digestion and a reference for future deeper analysis of the potential confounding states present in postmortem human samples.


Conflict of interest statement

The authors declare no competing interests. Though we believe that none of these relationships are conflicts of interest, D.A.H. has received research funding from Bristol Myers Squibb, Sanofi and Genentech for work unrelated to this project. He has been a consultant over the past 10 years for Bristol Myers Squibb, Compass Therapeutics, EMD Serono, Genentech, Juno Therapeutics, Novartis Pharmaceuticals, Proclara Biosciences, Sage Therapeutics and Sanofi Genzyme.

Figures

Fig. 1
Fig. 1. Analysis of sorted microglia confirms profound effect of enzymatic digestion on microglial gene expression via scRNA-seq.
a, Experimental design schematic for sorted mouse myeloid cells scRNA-seq experiment (Methods and Supplementary Fig. 1a–c). b, t-SNE plot for the 19,563 cells from n = 12 mice (n = 3 per group) colored and annotated by cluster (Supplementary Fig. 2). c, t-SNE plot split by experimental subgroup highlights enrichment of exAM cluster (circled) in ENZ-NONE group. d, Gene expression of several exAM cluster markers across each cluster. e, Heatmap of the mean percentage of cells in each cluster across conditions (*FDR < 0.005 for ENZ-NONE versus all other groups; #FDR < 0.05 DNC-NONE versus ENZ-INHIB; Benjamin and Hochberg correction for multiple comparisons; (Supplementary Table 3); Methods: differential abundance testing). f,g, Visualization of gene module scoring results plotted on t-SNE coordinates. f, Microglial identity score (Methods and Supplementary Table 4). g, Activation score based on consensus DEGs from ‘Metacell’ pseudobulk analysis (Methods and Supplementary Tables 4 and 5). h, Plot of microglial identity score versus activation score colored by cluster annotation from panel b. i, smFISH using RNAscope for microglial marker Fcrls (green), cluster marker Ccl4 and counterstained with DAPI; representative images from n = 2 independent experiments. Scale bar, 50 μm. Chem, Chemokine; hom, Homeostatic; mac, macrophage; mono, monocyte; prolif, proliferative.
Fig. 2
Fig. 2. Enzymatic dissociation induces cell-type-specific artifactual gene expression in mice.
a, Experimental design schematic for scRNA-seq of all CNS cell types (Methods). b, t-SNE plot of 10,166 cells from 4 mice (n = 2 per group), annotated and colored by cell type (Supplementary Fig. 7). c, Expression of microglial-specific genes Tmem119 and P2ry12 clearly defines two microglial clusters. d, t-SNE plot split by experimental group (±inhibitor cocktail) highlights lack of exAM cluster in samples digested with inhibitors present (bottom; circled). e, Heatmap displaying mean percentage of cells in each cluster across conditions (*FDR < 0.0005; Benjamini and Hochberg correction for multiple comparisons; Supplementary Table 18; Methods: differential abundance testing). f,g, Gene module scoring results plotted on t-SNE coordinates. f, Microglial identity score (Methods and Supplementary Table 4). g, Activation score based on DEGs from ‘Metacell’ pseudobulk analysis (Methods and Supplementary Table 4). h, Scatterplot of gene module scores from f and g colored by cluster from panel b. i, Enrichment of genes from activation score in exAM microglia cluster. CP, choroid plexus; NPC, neural progenitor cells; NSC, neural stem cells; OEC, olfactory ensheathing cells; OPC, oligodendrocyte progenitor cells; RBC, red blood cells.
Fig. 3
Fig. 3. snRNA-seq of human postmortem tissue identifies enrichment of mouse dissociation gene signatures in human microglia and astrocytes.
a, Experimental design schematic for snRNA-seq of all cell types from frozen postmortem brain tissue. b, UMAP plot of 47,505 nuclei analyzed via snRNA-seq from three postmortem subjects following LIGER analysis, colored by major cell type. c, Expression of canonical marker genes delineates major cell types. d, Visualization of the gene module scoring of the mouse DEG signature on human postmortem snRNA-seq dataset. e, Gene expression of exAM signature gene FOS across clusters. fk, Plots of mouse activation score versus sample PMI (y axis) for each of the major CNS cell classes present in the dataset: f, microglia, g, astrocytes, h, oligodendrocytes, i, oligodendrocyte precursor cells, j, excitatory neurons, k, inhibitory neurons. f-k, Percentages denote number of nuclei above enrichment threshold denoted with gray dotted line; individual points are colored by donor.
Fig. 4
Fig. 4. LIGER analysis independently identifies similar gene expression signatures in postmortem data that are enriched in microglia following altered sample processing.
a, UMAP plot visualizing the enrichment of shared LIGER factor for 12,790 microglial nuclei from 48 samples across all postmortem datasets. b, UMAP plot visualizing the enrichment of shared LIGER factor for 23,998 astrocyte nuclei from 49 samples across all postmortem datasets. For both a and b, inset displays plot of normalized cell-specific factor loading scores across all genes in the dataset (dashed line indicates threshold cutoff for top genes for downstream analysis; Supplementary Table 22). Top loading genes, in order, are shown to the right of the inset plot. c, Experimental design schematic for experiment to analyze the effects of altered sample processing on gene expression. df, Visualization of gene module scoring results for score based on postmortem microglia factor, from a, in both snap-frozen (d) and 6-h delayed freezing (e) microglia nuclei on UMAP coordinates or via violin plot split by experimental group (f). g, Gene expression of top 12 loading genes in microglial factor from a split by experimental group (Supplementary Table 23 for DEG results). hj, Visualization of gene module scoring results for score based on postmortem astrocyte factor, from b, in both snap-frozen (h) and 6-h delayed freezing (i) astrocyte nuclei on UMAP coordinates or via violin plot split by experimental group (j). k, Gene expression of top 12 loading genes in astrocyte factor from b split by experimental group (Supplementary Table 24 for DEG results). l,m, Spearman correlation of the percentage of microglia above score threshold for microglia factor score in each postmortem sample versus l, PMI and m, age of donor; graph annotations list Spearman r values and significance. n, Plot of percentage of microglia above score threshold for microglia factor score in each postmortem sample split by diagnosis; n = 48 independent samples from 5 studies/independent experiments (45 samples are from 4 previously published studies); n = 32 control/n = 16 Alzheimer’s disease. Data are presented as mean values ± s.e.m. AD, Alzheimer’s disease; NS, not significant; RT, room temperature.

References

    1. Svensson, V., Vento-Tormo, R. & Teichmann, S. A. Exponential scaling of single-cell RNA-seq in the past decade. Nat. Protoc.13, 599–604 (2018). - PubMed
    1. Svensson, V., da Veiga Beltrame, E. & Pachter, L. A curated database reveals trends in single-cell transcriptomics. Database (Oxford)2020 (2020). - PMC - PubMed
    1. Abuzakouk, M., Feighery, C. & O’Farrelly, C. Collagenase and Dispase enzymes disrupt lymphocyte surface molecules. J. Immunol. Methods194, 211–216 (1996). - PubMed
    1. Cardona, A. E., Huang, D., Sasse, M. E. & Ransohoff, R. M. Isolation of murine microglial cells for RNA analysis or flow cytometry. Nat. Protoc.1, 1947–1951 (2006). - PubMed
    1. Grange, C. et al. Phenotypic characterization and functional analysis of human tumor immune infiltration after mechanical and enzymatic disaggregation. J. Immunol. Methods372, 119–126 (2011). - PubMed

Publication types