

Sodium alginate and naloxone loaded macrophage-derived nanovesicles for the treatment of spinal cord injury
- PMID: 35261646
- PMCID: PMC8888181
- DOI: 10.1016/j.ajps.2021.11.001
Sodium alginate and naloxone loaded macrophage-derived nanovesicles for the treatment of spinal cord injury
Abstract
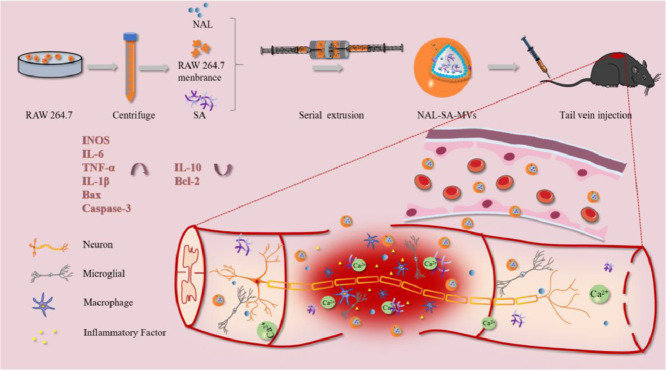
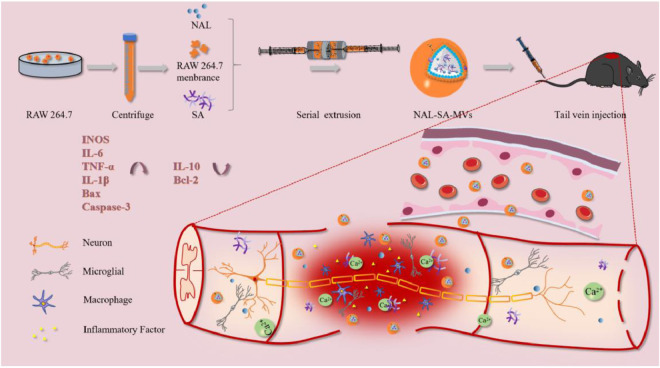
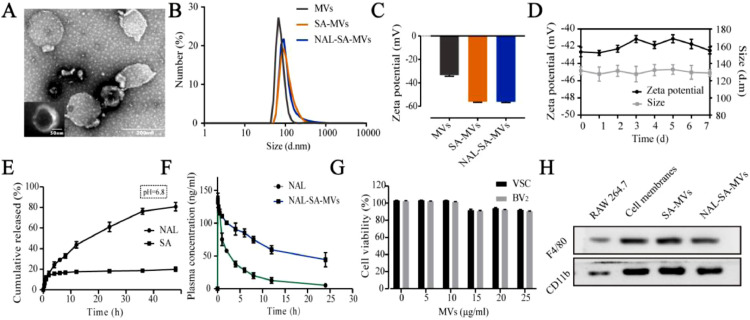
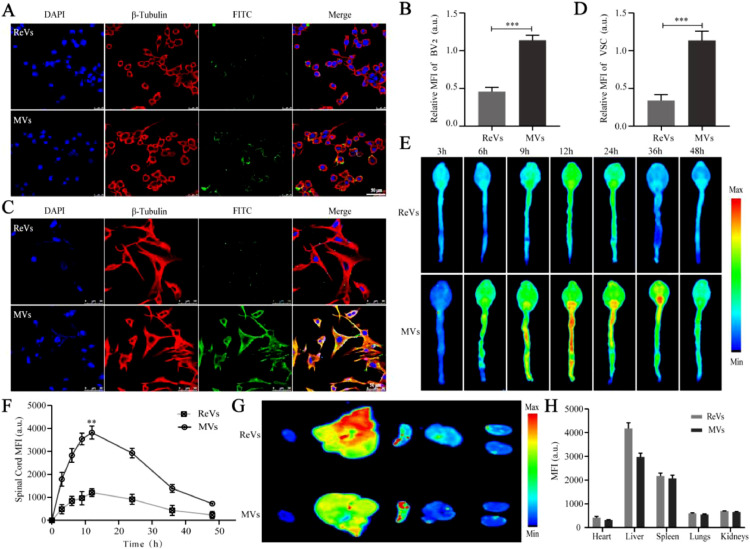
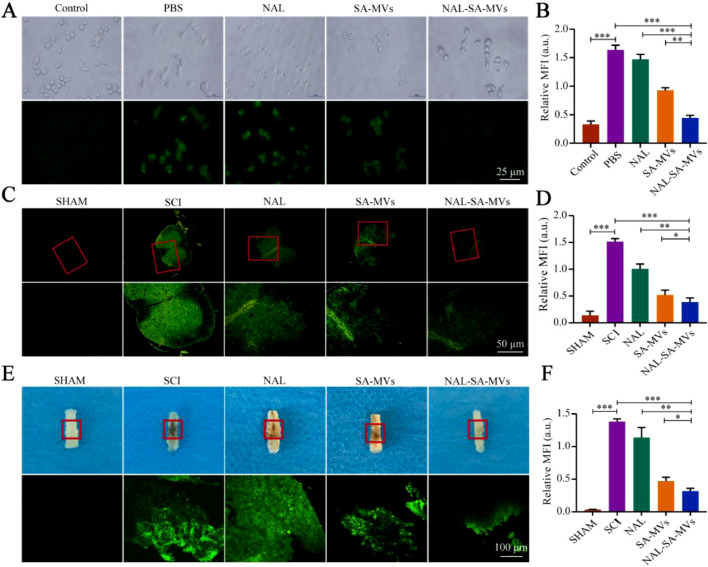
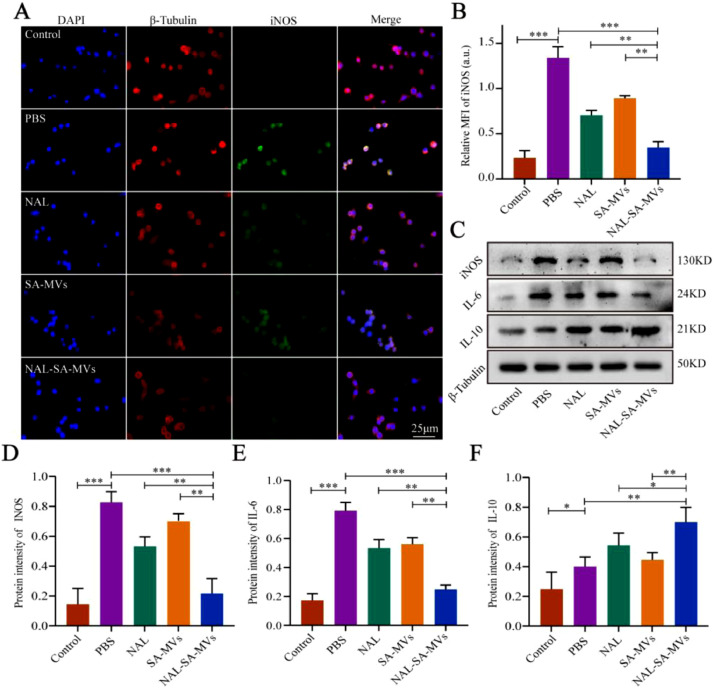
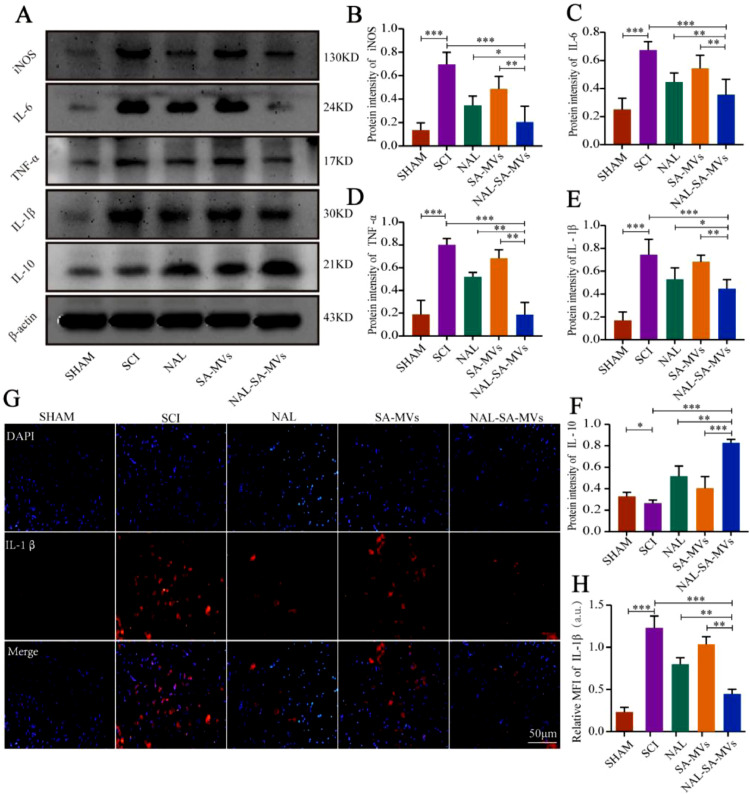
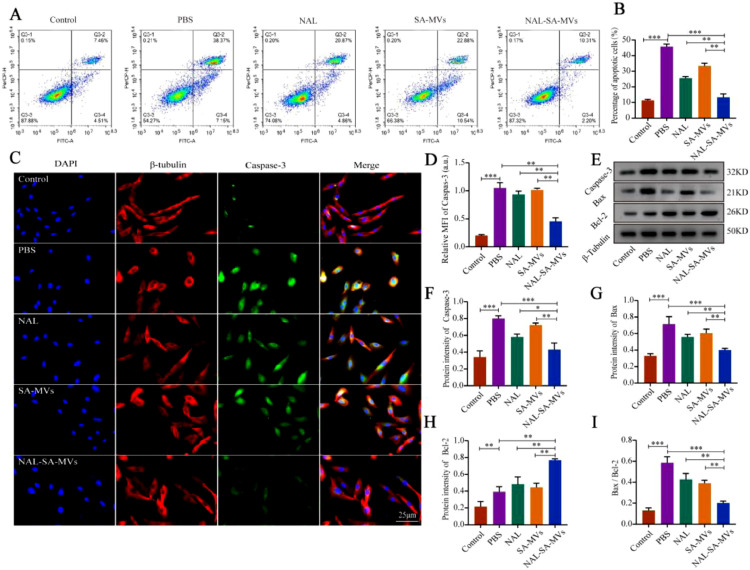
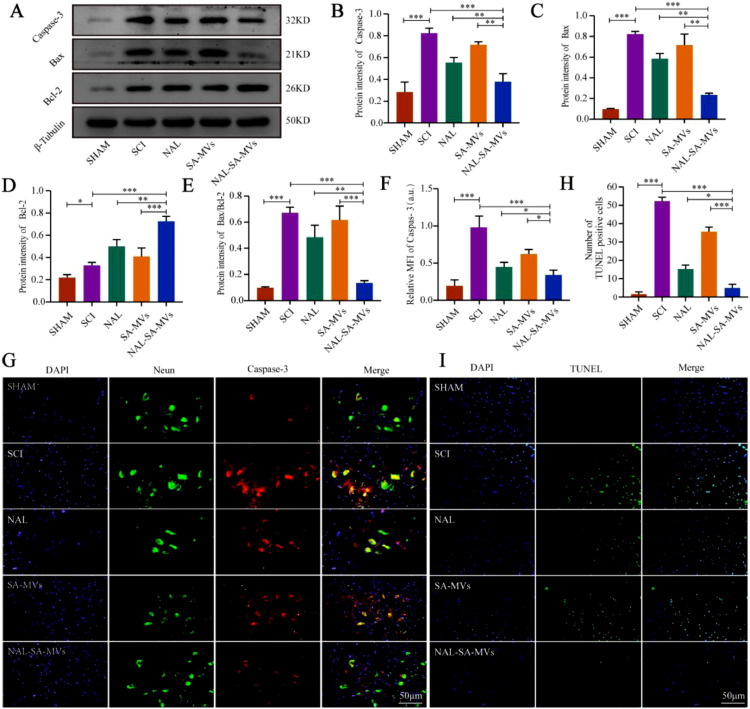
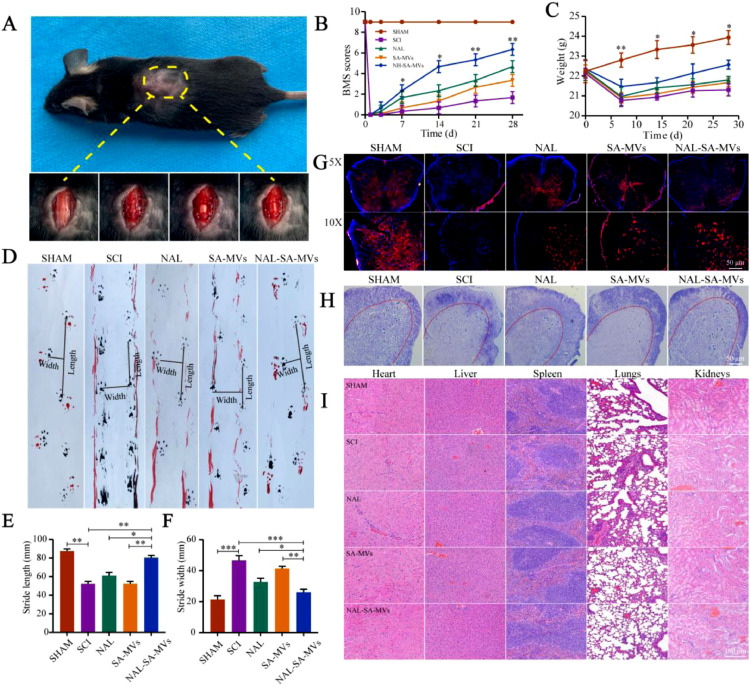
Spinal cord injury (SCI) causes Ca2+ overload, which can lead to inflammation and neuronal apoptosis. In this study, we prepared a nanovesicle derived from macrophage membrane (MVs), which encapsulated sodium alginate (SA) and naloxone (NAL) to inhibit inflammation and protect neurons by reducing the free Ca2+concentration at the SCI site. Based on the transmission electron microscopy (TEM) image, the encapsulated sample (NAL-SA-MVs) had a particle size of approximately 134 ± 11 nm and exhibited a sustained release effect. The encapsulation rate of NAL and SA was 82.07% ± 3.27% and 72.13% ± 2.61% in NAL-SA-MVs, respectively. Targeting tests showed that the NAL-SA-MVs could accumulate in large quantities and enhance the concentration of SA and NAL at the lesion sites. In vivo and in vitro studies indicated that the NAL-SA-MVs could decrease the concentration of free Ca2+, which should further alleviate the inflammatory response and neuronal apoptosis. Anti-inflammation results demonstrated that the NAL-SA-MVs could reduce the pro-inflammation factors (iNOS, TNF-α, IL-1β, IL-6) and increase the expression of anti-inflammation factors (IL-10) at the cell and animal level. Concurrently, fluorescence, flow cytometry and western blot characterization showed that the apoptotic condition of the neurons was significantly inhibited. In addition, the motor function of C57 mice were significantly improved after NAL-SA-MVs treatment. In conclusion, it is suggested that the NAL-SA-MVs has tremendous potential in the treatment of SCI.
Keywords: Inflammation; Macrophage membrane; Naloxone; Neuroprotection; Sodium alginate; Spinal cord injury.
© 2021 Shenyang Pharmaceutical University. Published by Elsevier B.V.
Conflict of interest statement
The authors declare no competing financial interest. The manuscript was written through contributions of all authors. All authors have given approval to the final version of the manuscript.
Figures
Similar articles
-
Encapsulation of Selenium Nanoparticles and Metformin in Macrophage-Derived Cell Membranes for the Treatment of Spinal Cord Injury.ACS Biomater Sci Eng. 2023 Oct 9;9(10):5709-5723. doi: 10.1021/acsbiomaterials.3c01009. Epub 2023 Sep 15. ACS Biomater Sci Eng. 2023. PMID: 37713674
-
Berberine‑calcium alginate-coated macrophage membrane-derived nanovesicles for the oral treatment of ulcerative colitis.Int J Biol Macromol. 2025 Mar;294:139114. doi: 10.1016/j.ijbiomac.2024.139114. Epub 2025 Jan 2. Int J Biol Macromol. 2025. PMID: 39755317
-
Berberine-loaded M2 macrophage-derived exosomes for spinal cord injury therapy.Acta Biomater. 2021 May;126:211-223. doi: 10.1016/j.actbio.2021.03.018. Epub 2021 Mar 17. Acta Biomater. 2021. PMID: 33722788
-
Sesamol-loaded stearic acid-chitosan nanomicelles mitigate the oxidative stress-stimulated apoptosis and induction of pro-inflammatory cytokines in motor neuronal of the spinal cord through NF-ĸB signaling pathway.Int J Biol Macromol. 2021 Sep 1;186:23-32. doi: 10.1016/j.ijbiomac.2021.06.171. Epub 2021 Jun 29. Int J Biol Macromol. 2021. PMID: 34214577
-
MiR-92b-5p inhibitor suppresses IL-18 mediated inflammatory amplification after spinal cord injury via IL-18BP up-regulation.Eur Rev Med Pharmacol Sci. 2019 Mar;23(5):1891-1898. doi: 10.26355/eurrev_201903_17226. Eur Rev Med Pharmacol Sci. 2019. PMID: 30915731
Cited by
-
From Molecules to Mind: The Critical Role of Chitosan, Collagen, Alginate, and Other Biopolymers in Neuroprotection and Neurodegeneration.Molecules. 2025 Feb 22;30(5):1017. doi: 10.3390/molecules30051017. Molecules. 2025. PMID: 40076240 Free PMC article. Review.
-
Commentary on "The Role of Alginate Hydrogels as a Potential Treatment Modality for Spinal Cord Injury: A Comprehensive Review of the Literature".Neurospine. 2022 Jun;19(2):281-282. doi: 10.14245/ns.2244490.245. Epub 2022 Jun 30. Neurospine. 2022. PMID: 35793930 Free PMC article. No abstract available.
-
Novel Strategies for Spinal Cord Regeneration.Int J Mol Sci. 2022 Apr 20;23(9):4552. doi: 10.3390/ijms23094552. Int J Mol Sci. 2022. PMID: 35562941 Free PMC article. Review.
-
Role of PCBP2 in regulating nanovesicles loaded with curcumin to mitigate neuroferroptosis in neural damage caused by heat stroke.J Nanobiotechnology. 2024 Dec 27;22(1):800. doi: 10.1186/s12951-024-02889-4. J Nanobiotechnology. 2024. PMID: 39731111 Free PMC article.
-
Recent advances in lipid nanovesicles for targeted treatment of spinal cord injury.Front Bioeng Biotechnol. 2023 Aug 16;11:1261288. doi: 10.3389/fbioe.2023.1261288. eCollection 2023. Front Bioeng Biotechnol. 2023. PMID: 37691909 Free PMC article. Review.
References
-
- Selvarajah S., Hammond E.R., Haider A.H., Abularrage C.J., Becker D., Dhiman N., et al. The burden of acute traumatic spinal cord injury among adults in the united states: an update. J Neurotrauma. 2014;31(3):228–238. Feb 1. - PubMed
-
- Toluse A.M., Adeyemi T.O. Epidemiology and clinical outcomes of spinal cord injuries at a level II trauma centre in Nigeria: a longitudinal five year study. Int Orthop. 2021;45(3):665–671. - PubMed
-
- Ahuja C.S., Wilson J.R., Nori S., Kotter M.R.N., Druschel C., Curt A., et al. Traumatic spinal cord injury. Nat Rev Dis Prim. 2017;3:17018. - PubMed
-
- Wang X.J., Shu G.F., Xu X.L., Peng C.H., Lu C.Y., Cheng X.Y., et al. Combinational protective therapy for spinal cord injury medicated by sialic acid-driven and polyethylene glycol based micelles. Biomaterials. 2019;217 - PubMed
LinkOut - more resources
Full Text Sources
Miscellaneous
