. 2022 Mar 4;2022(1):niac004.
doi: 10.1093/nc/niac004. eCollection 2022.

Capacity for consciousness under ketamine anaesthesia is selectively associated with activity in posteromedial cortex in rats

Affiliations

Capacity for consciousness under ketamine anaesthesia is selectively associated with activity in posteromedial cortex in rats

A Arena et al. Neurosci Conscious. .

Abstract

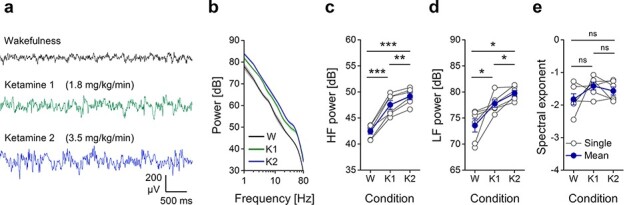
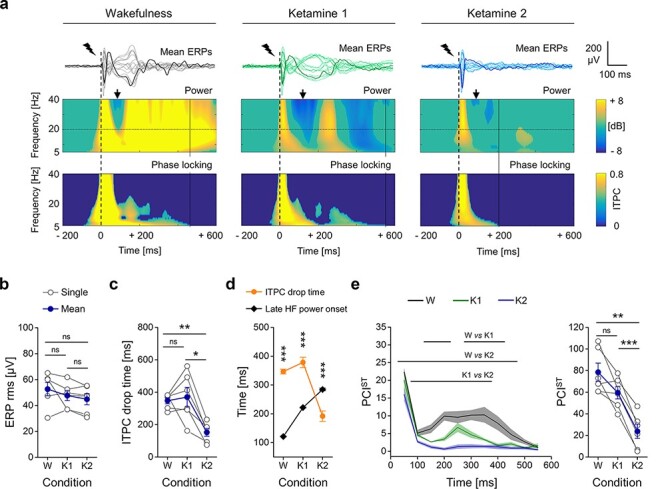
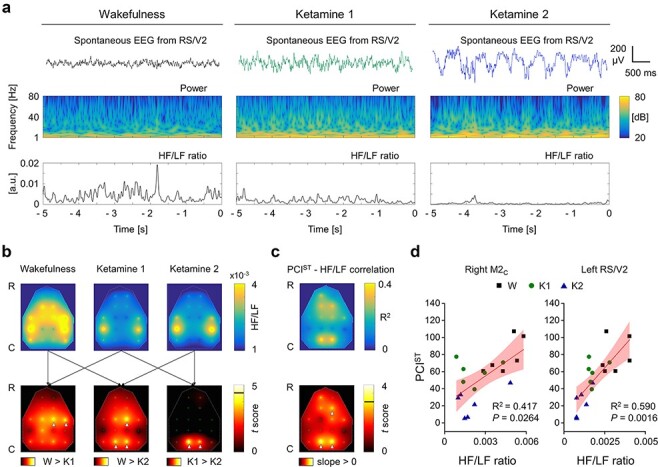
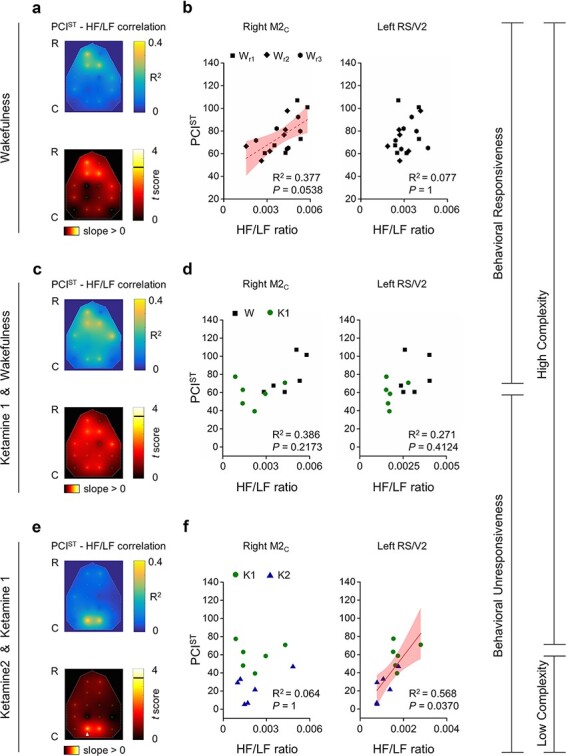
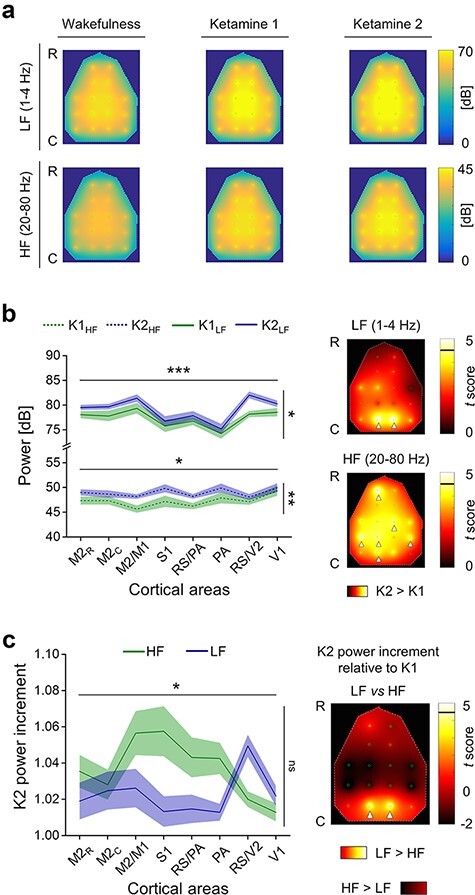
It remains unclear how specific cortical regions contribute to the brain's overall capacity for consciousness. Clarifying this could help distinguish between theories of consciousness. Here, we investigate the association between markers of regionally specific (de)activation and the brain's overall capacity for consciousness. We recorded electroencephalographic responses to cortical electrical stimulation in six rats and computed Perturbational Complexity Index state-transition (PCIST), which has been extensively validated as an index of the capacity for consciousness in humans. We also estimated the balance between activation and inhibition of specific cortical areas with the ratio between high and low frequency power from spontaneous electroencephalographic activity at each electrode. We repeated these measurements during wakefulness, and during two levels of ketamine anaesthesia: with the minimal dose needed to induce behavioural unresponsiveness and twice this dose. We found that PCIST was only slightly reduced from wakefulness to light ketamine anaesthesia, but dropped significantly with deeper anaesthesia. The high-dose effect was selectively associated with reduced high frequency/low frequency ratio in the posteromedial cortex, which strongly correlated with PCIST. Conversely, behavioural unresponsiveness induced by light ketamine anaesthesia was associated with similar spectral changes in frontal, but not posterior cortical regions. Thus, activity in the posteromedial cortex correlates with the capacity for consciousness, as assessed by PCIST, during different depths of ketamine anaesthesia, in rats, independently of behaviour. These results are discussed in relation to different theories of consciousness.

Keywords: EEG markers of consciousness; consciousness; ketamine anesthesia; perturbational complexity index.


Figures

Figure 1.
Figure 1.
The averaged power spectrum of spontaneous EEG was scaled up from wakefulness to ketamine anaesthesia and by increasing ketamine dosage. (a) Example of spontaneous EEG (5 s) from the retrosplenial/parietal cortex (RS/PA) of one rat during wakefulness (W), light ketamine anaesthesia (ketamine 1, K1; administration rate: 1.8 mg/kg/min i.v.) and deep ketamine anaesthesia (ketamine 2, K2; administration rate: 3.5 mg/kg/min i.v.). (b) Mean periodograms from 16 channels and 6 rats exposed to the same conditions of A (shades represent SEM across rats). (c) Variations of mean high frequency power (HF, 20-80 Hz) and (d) low frequency power (LF, 1-4 Hz) are shown for each rat across conditions and increased from W to K1 and from K1 to K2. (e) The spectral exponents of the averaged periodograms across channels are also reported for each rat and condition
Figure 2.
Figure 2.
The spatiotemporal dynamics of ERPs revealed a drop in complexity from low to high dosage of ketamine. (a) Top, superimposition of mean ERPs from all 16 electrodes in response to single pulse stimulation (1 ms, 50 μA; dashed line) of the right secondary motor cortex (M2), from the same rat during wakefulness (W, left) and light and deep ketamine anaesthesia (K1, middle and K2, right respectively). One averaged ERP from the same channel over the right primary somatosensory cortex (S1) is in bold for clarity. Middle, power spectrogram (dB) and, bottom, phase-locking across trials (ITPC) from the channel shown in bold above (right S1). The black arrows indicate the moment of relaxation of HF power (dB ≤ 0) that follows the first response to stimulation. The ITPC drop time is indicated by vertical continuous lines. (b) The rms amplitude of the early ERP (first 50 ms from stimulus onset) averaged across channels is shown for all rats and conditions. (c) The ITPC drop time (in frequency range 5–80 Hz) averaged across channels is plotted for each rat and condition. (d) The ITPC drop time and the onset of later increased HF power was averaged across channels from all rats and shown for each condition. (e) Left, time courses of mean PCIST (moving windows of 100 ms, 50 ms overlap) and standard errors (shaded) are plotted for all conditions (horizontal lines indicate periods of statistically significant difference between conditions, P < 0.05). Right, PCIST in range 0-600 ms is shown for each rat and condition
Figure 3.
Figure 3.
The HF/LF ratio of spontaneous EEG in bilateral posteromedial cortex was selectively reduced by increasing ketamine dosage and correlated with the level of PCIST. (a) Up, Example of spontaneous EEG (5 s) from the posteromedial cortex (RS/V2) of one rat during wakefulness (W), light ketamine anaesthesia (ketamine 1, K1) and deep ketamine anaesthesia (ketamine 2, K2) and below, the relative spectrogram and the ratio between high frequency (HF, 20–80 Hz) and low frequency (LF, 1–4 Hz) powers (HF/LF ratio) in time. (b) The colour maps show the topographical distributions (R-C: rostral-caudal) of the 16 EEG electrodes (small green circles) and, above, the spatial interpolations of the HF/LF ratio, averaged across time, trials and rats, for each condition. Below, the colour maps report the spatial interpolation of the t-scores (paired-samples t-test) from comparing the HF/LF ratio across conditions for each channel (left, wakefulness vs. ketamine 1; middle, wakefulness vs. ketamine 2; right, ketamine 1 vs. ketamine 2). The horizontal black line in the colour bar indicates the threshold for statistical significance (t5 = 4.5258, Bonferroni–Holm corrected). White arrowheads indicate the channels with statistically significant differences across conditions. (c) Above, the colour map shows the spatial distribution of the coefficient of determination R2 from the correlation between PCIST and HF/LF ratio, across rats and conditions, for each channel. Below, the colour map reports the spatial interpolation of t-scores, assessing the statistical significance of the correlation for each channel. The horizontal black line in the colour bar indicates the threshold for statistical significance (t16 = 3.1458, Bonferroni–Holm corrected). White arrowheads indicate the channels showing statistically significant correlations. The correlations of right M2C and left RS/V2 are reported in (d) with respective R2 and P-values
Figure 4.
Figure 4.
HF/LF ratio of spontaneous EEG from posteromedial cortex selectively correlated with PCIST in conditions of behavioural unresponsiveness, with light and high ketamine anaesthesia. (a, b) The putative correlations between PCIST and HF/LF ratio are shown in wakefulness across rats and 3 recording sessions (Wr1 Wr2 Wr3), during the presence of both behavioural responsiveness and high cortical complexity. (c, d) The same putative correlations are shown across rats and across conditions of wakefulness (W) and low ketamine anaesthesia (K1), when loss of behavioural responsiveness occurred, but high cortical complexity persisted. (e, f) Correlations between PCIST and HF/LF ratio are also computed and shown across rats and across conditions of low and high ketamine doses (K1 and K2, respectively) when reduction of cortical complexity occurred and behavioural unresponsiveness was unchanged. In panels A, C, E the colour maps show the spatial interpolation of R2 and t-scores (above and below respectively, for all panels) from the correlations of all channels. The horizontal black line in the colour bar indicates the threshold for statistical significance. The white arrowhead indicates channels with statistically significant correlation between PCIST and HF/LF ratio. In panels B, D, F the correlations and/or absence of correlation of right secondary motor cortex (M2C, left side of the panel) and left posteromedial cortex (RS/V2, right side of the panel) are reported with relative R2 and P-values, (corrected for multiple comparisons). Dashed line is used to indicate a correlation close to statistical significance (panel B, left), while a continuous line indicates a statistically significant linear fitting and correlation (panel F, right)
Figure 5.
Figure 5.
The reduction of HF/LF ratio from low to high dosage of ketamine in the posteromedial cortex was explained by a selective higher increment of LF powers with respect to HF. (a) The colour maps show the topographical distributions (R-C: rostral-caudal) of the 16 EEG electrodes (small green circles) and the spatial interpolations of the LF power (1–4 Hz, above) and HF power (20–80 Hz, below), averaged across time, trials and rats, for each condition. (b) Left, averaged HF (dashed line) and LF (continuous line) powers across hemispheres and rats are shown for each cortical area, during both low and high ketamine dosage (K1 and K2, respectively). On the right, the colour maps show the spatial interpolation of t-scores from comparing LF powers (up) and HF powers (bottom) between K1 and K2 conditions, for each channel. The horizontal black lines in the colour bar indicate the threshold for statistical significance (t5 = 4.5258, Bonferroni–Holm corrected). White arrowheads indicate channels with statistically significant differences across conditions. (c) Left, the ratio between low and high doses of ketamine is reported for both HF and LF powers at the level of each cortical area, thus showing the power increments induced by deep ketamine anaesthesia (K2). Right, spatial interpolation of the t-scores from comparing LF power increment with HF power increments induced by increasing ketamine dosage, for each channel. The horizontal black line in the colour bar indicates the threshold for statistical significance (t5 = 4.5258, Bonferroni–Holm corrected). White arrowheads indicate the channels with statistically significant differences between the two frequency ranges

Similar articles

Cited by

References

    1. Akeju O, Song AH, Hamilos AE. et al. Electroencephalogram signatures of ketamine anesthesia-induced unconsciousness. Clin Neurophysiol 2016;127:2414–22. - PMC - PubMed
    1. Arena A, Comolatti R, Thon S. et al. General anesthesia disrupts complex cortical dynamics in response to intracranial electrical stimulation in rats. eNeuro 2021;8:4. - PMC - PubMed
    1. Arena A, Thon S, Storm J. PCI-like measure in rodents. Hum Brain Project Neuroinf Platform 2019.doi: 10.25493/S0DM-BK5. - DOI
    1. Baars BJ. Global workspace theory of consciousness: toward a cognitive neuroscience of human experience. In: Laureys S (ed.), The Boundaries of Consciousness: Neurobiology and Neuropathology. Amsterdam: Elsevier, 2005, 45–53. - PubMed
    1. Barthas F, Kwan AC. Secondary motor cortex: where “sensory” meets “motor” in the rodent frontal cortex. Trends Neurosci 2017;40:181–93. - PMC - PubMed