[Preprint]. 2022 Mar 2:rs.3.rs-1395683.
doi: 10.21203/rs.3.rs-1395683/v1.

BCG revaccination qualitatively and quantitatively enhances SARS-CoV-2 spike-specific neutralizing antibody and T cell responses induced by the COVISHIELD vaccine in SARS-CoV-2 seronegative young Indian adults

Affiliations

BCG revaccination qualitatively and quantitatively enhances SARS-CoV-2 spike-specific neutralizing antibody and T cell responses induced by the COVISHIELD vaccine in SARS-CoV-2 seronegative young Indian adults

Srabanti Rakshit et al. Res Sq. .

Abstract

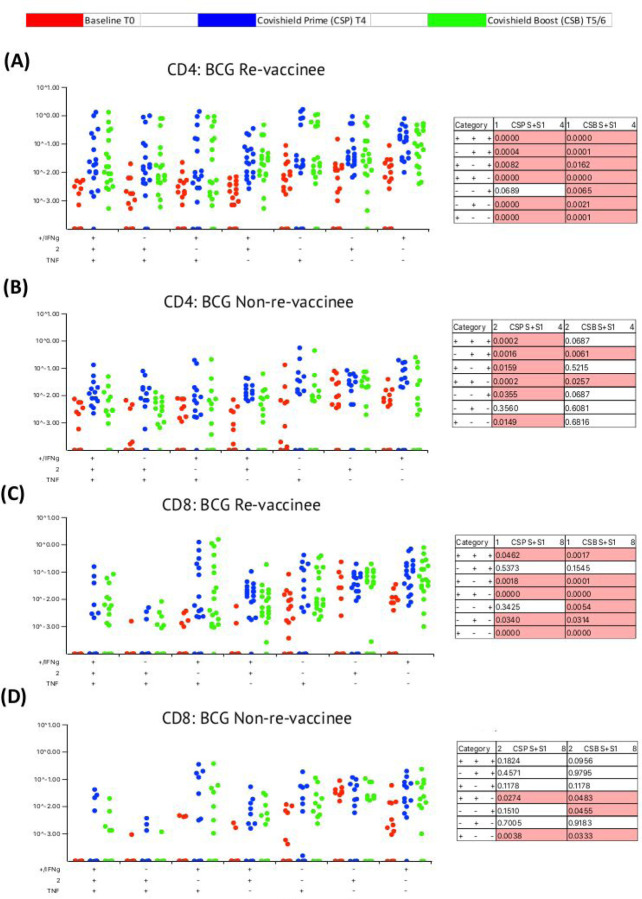
This study tested if prior BCG revaccination can further boost immune responses subsequently induced by a widely distributed and otherwise efficacious Oxford/AstraZeneca ChAdOx1nCoV-19 vaccine, referred to as COVISHIELD, in India. We compared COVISHIELD induced longitudinal immune responses in 21 BCG re-vaccinees (BCG-RV) and 13 BCG-non-revaccinees (BCG-NRV), all of whom were BCG vaccinated at birth and latent tuberculosis negative, after COVISHIELD prime and boost with baseline samples that were collected pre-pandemic and pre-BCG revaccination. Compared to BCG-NRV, BCG-RV displayed significantly higher magnitude of spike-specific Ab and T cell responses, including a greater proportion of high responders; better quality polyfunctional CD4 and CD8 T cells that persisted and a more robust Ab and T cell response to the Delta mutant of SARS-CoV-2 highlighting greater breadth. Mechanistically, BCG adjuvant effects on COVISHIELD induced adaptive responses was associated with more robust innate responses to pathogen-associated-molecular-patterns through TNF-α and IL-1β secretion. This study provides first in-depth analysis of immune responses induced by COVISHIELD in India and highlights the potential of using a cheap and globally available vaccine, BCG, as an adjuvant to enhance heterologous adaptive immune responses induced by COVIDSHIELD and other emerging vaccines.

Keywords: BCG; CD4; CD8; COVISHIELD™; SARS-CoV-2; antibody binding; heterologous responses; neutralizing antibody; trained immunity.


Conflict of interest statement

Conflict of Interest Statement The authors declare that the research was conducted in the absence of any commercial or financial relationships that could be construed as a potential conflict of interest.

Figures

Figure 1:
Figure 1:. Overall study design.
(A) CONSORT flow diagram of participant recruitment and enrolment. (B) A diagrammatic representation of study design, including schedule of BCG and COVISHIELD vaccination and blood draw. Group 1 received BCG at day 0 (T0) and then both groups were vaccinated with 2 doses of COVISHIELD vaccine (Prime and Boost). Time points for immunization with BCG and COVISHIELD are shown by green arrows, and the 6 blood sampling time points (T0–T6) are indicated by red arrows for all groups.
Figure 2:
Figure 2:. Overview of spike-specific immune responses to COVISHIELD vaccination and the impact of time.
(A) Plasma SARS-CoV-2 anti-spike protein IgG titres by LIAISON® SARS-CoV-2 TrimericS IgG assay and (B) Neutralizing antibody responses (NAb ID50) in COVISHIELD vaccinated subjects measured at baseline (T0), 2-, 3- and 4-weeks post-prime (T4:2, T4:3 and T4:4), 6–7 weeks post boost (T5) and 20–23 weeks post-boost (T6). (C & D) CD4+ and CD8+ T cell responses in COVISHIELD vaccinated subjects measured overtime. PBMCs from individuals collected at baseline (T0), 2-, 3- and 4-weeks post-prime (T4:2, T4:3 and T4:4), 6–7 weeks post boost (T5) and 20–23 weeks post-boost (T6) were stimulated with Spike peptide pool (0.06 nM) for 20 hr. CD4+ and CD8+ T cells were analyzed for intracellular expression of IFN-γ or IL-2. Kruskal-Wallis test with Dunn’s correction was used for determining statistical significance.
Figure 3:
Figure 3:. Overview of spike-specific vaccine induced responses in BCG-RV and BCG-NRV.
(A) Plasma SARS-CoV-2 anti Spike protein IgG titres by LIAISON® SARS-CoV-2 TrimericS IgG assay and (B) Neutralizing antibody titres (NAb ID50) in COVISHIELD vaccinated BCG-RV (purple circles) and BCG-NRV (orange circles) subjects measured at baseline (T0), 2-, 3- and 4-weeks post-prime (T4:2, T4:3 and T4:4), 6–7 weeks post boost (T5) and 20–23 weeks post-boost (T6). Grouped scatter plot with median (horizontal grey line) and interquartile range comparing fold change over baseline at 3–4 weeks post-prime (T4:3–4), 6–7 weeks post boost (T5) and 20–23 weeks post boost (T6). (C & D) CD4+ and CD8+ T cell responses in COVISHIELD vaccinated subjects measured overtime. PBMCs from individuals collected from COVISHIELD vaccinated BCG-RV (purple circles) and BCG-NRV (orange circles) at baseline (T0), 2-, 3- and 4-weeks post-prime (T4:2, T4:3 and T4:4), 6–7 weeks post boost (T5) and 20–23 weeks post-boost (T6) were stimulated with Spike peptide pool (0.06 nM) for 20 hr. CD4+ and CD8+ T cells were analyzed for intracellular expression of IFN-γ or IL-2. Grouped scatter plot with median (horizontal grey line) and interquartile range comparing the fold change of IFN-γ or IL-2 in (C) CD4+ and (D) CD8+ T cells collected at 3–4 weeks post-prime (T4:3–4), 6–7 weeks post boost (T5) and 20–23 weeks post boost (T6). Kruskal-Wallis test with Dunn’s correction was used for determining statistical significance between longitudinal timepoints. The proportion of each group that showed a positive serologic response to Spike, neutralizing antibody titres or a positive IFN-γ or IL-2 CD4+ and CD8+ T cell response to Spike were compared between COVISHIELD vaccinated BCG-RV (purple circles) and BCG-NRV (orange circles) by using Fisher’s exact test. HR indicates the p-value for high-responders in each group (subjects with >100-fold change over baseline for TrimericS IgG, >10-fold change for NAb, CD4+ or CD8+ T-cell responses). LR indicates the p-value for low-responders (>10-fold change for TrimericS IgG, >3-fold change for NAb and >4-fold change for CD4 or CD8 T-cell responses).
Figure 4:
Figure 4:. BCG revaccination significantly impacts the quality of the spike-specific CD4+ and CD8+ T cell response in COVISHIELD-vaccinated subjects.
Longitudinal multifunctional spike- specific CD4+ T cells (A&B) or CD8+ T cells (C&D) in COVISHIELD vaccinees. PBMCs from individuals collected at baseline (BL, red dots), 2–4 weeks post-prime (CSP, blue dots) and 6–7- or 20–23-weeks post-boost (CSB, green dots) were stimulated with spike for 20hr and CD4+ or CD8+ T cells were analyzed for intracellular expression of IFN-γ, IL-2 and TNF-α in a standard ICS assay. Boolean gates were created from the individual cytokines (listed above) in FlowJo to divide responding cells into 7 distinct subsets corresponding to all possible combinations of these functions, and the data were analyzed using SPICE software. Data were analyzed for statistical significance using Wilcoxon signed-rank test. Background subtracted and log data analyzed in all cases. P < 0.05 was considered statistically significant.
Figure 5:
Figure 5:. The breadth of the spike response in BCG-RV and BCG-NRV to Wild-type and Delta variant (B1.617.2).
(A) Comparison of neutralizing antibody responses (NAb ID50) to the Delta variant (B1.617.2) in samples collected from COVISHIELD vaccinated BCG-RV (purple circles) and BCG-NRV (orange circles) at 3–4 weeks post-prime (T4:3–4), 6–7 weeks post boost (T5) and 20–23 weeks post boost (T6). Grouped scatter plots depict the median (horizontal grey line) and interquartile range of fold change in NAb ID50 over baseline. Comparison of neutralizing antibody responses (NAb ID50) to wild-type versus Delta variant (B1.617.2) in samples collected from COVISHIELD vaccinated BCG-RV (purple circles) and BCG-NRV (orange circles) at 2–4 weeks post prime (T4) and 6–7 weeks (T5) or 20–23 weeks (T6) post-boost. (B) CD4+ and (C) CD8+ T cell responses to the WT and delta variant in COVISHIELD vaccinated subjects. PBMCs from individuals collected from COVISHIELD vaccinated BCG-RV (purple circles) and BCG-NRV (orange circles) were stimulated with Spike peptide pool to the delta strain (B1.617.2) and its matched reference WT (0.06 nM) for 20 hr. CD4+ and CD8+ T cells were analyzed for intracellular expression of IFN-γ or IL-2. Comparison of the frequencies of IFN-γ or IL-2 in (B) CD4+ and (C) CD8+ T cells to the Delta at post-prime (T4) and post boost (T5/6). Grouped scatter plots depict the median (horizontal grey line) and interquartile range of fold change in frequencies of IFN-γ or IL-2 over baseline. Comparison of the frequencies of IFN-γ or IL-2 in (B) CD4+ and (C) CD8+ T cells to Delta variant (B1.617.2) and the matched WT reference spike pool in samples collected from COVISHIELD vaccinated BCG-RV (purple circles) and BCG-NRV (orange circles) at post prime (T4) and post-boost (T5/6). (D and E) Correlations between IFN-γ or IL-2 expression in CD4+ (left panel) and CD8+ (right panel) T cells and corresponding neutralizing antibody responses (NAb ID50) to the delta variant in COVISHIELD vaccinated BCG-RV (purple circles) and BCG-NRV (orange circles) measured overtime. Kruskal-Wallis test with Dunn’s correction was used for determining statistical significance between longitudinal timepoints in (A). The proportion of each group that showed positive neutralizing antibody titres and IFN-γ or IL-2 CD4+ and CD8+ T cell response to Spike in (A) and (C) were compared between COVISHIELD vaccinated BCG-RV (purple circles) and BCG-NRV (orange circles) by using Fisher’s exact test. HR indicates the p-value for high-responders in each group (subjects with >10-fold change for NAb, CD4+ or CD8+ T-cell responses). LR indicates the p-value for low-responders (>3-fold change for NAb and >4-fold change for CD4+ or CD8+ T-cell responses). Wilcoxon matched paired t-test was used for determining statistical significance in (B) and (D).
Figure 6:
Figure 6:. BCG revaccination boosts innate effector responses in HLA-DR+ monocytes and trained immunity effectors to PAMP stimulation.
Whole blood from 20 BCG-RV and 18 BCG-NRV at baseline (T0) and 10–12 weeks (T2) post-revaccination was stimulated or not with either Ag85A (A) or BCG (B) for 12 hrs after which samples were subjected to RBC lysis, fixed, frozen and archived. Frozen samples were thawed, washed and stained with a 17-color antibody panel to assess expression of innate effectors TNF-α, IL-1β and IL-6 in the monocyte compartment. Frequencies of TNF-α+, IL-1β+ and IL-6+ monocytes after background subtraction were plotted for comparison of responses at T0 and T2. Grey shaded areas of the graphs show data for BCG-RV and yellow shaded areas for BCG-NRV. Wilcoxon signed-rank t-test was used for determining statistical significance. (C) Levels of TNF-α, IL-1β and IL-6 upon PBMC restimulation. PBMC from 13 BCG-RV and 10 BCG-NRV at baseline (T0), 10–12 weeks (T2) or 51–68 weeks (T4) post-re-vaccination were stimulated or not with 106 cfu/ml heat-inactivated C. albicans, 0.2×10⁶ cfu/ml BCG, 1ng/ml LPS and 50μg/ml Pam3CSK4 for 24 hr after which supernatants were collected and ELISA for TNF-α, IL-1β and IL-6. Absolute concentrations of secreted cytokines were read off a standard curve and plotted after subtraction of background. Cytokines secreted by unstimulated cells (i.e., background) are shown separately at the top of the figure. Grey shaded areas of the graphs show data for BCG-RV and yellow shaded areas for BCG-NRV. Wilcoxon signed-rank t-test was used for determining statistical significance.

References

    1. Zwerling A, Behr MA, Verma A, Brewer TF, Menzies D, Pai M. The BCG World Atlas: a database of global BCG vaccination policies and practices. PLoS Med. 2011;8(3):e1001012. - PMC - PubMed
    1. de Castro MJ, Pardo-Seco J, Martinón-Torres F. Nonspecific (Heterologous) Protection of Neonatal BCG Vaccination Against Hospitalization Due to Respiratory Infection and Sepsis. Clin Infect Dis. 2015;60(11):1611–1619. - PubMed
    1. Biering-Sørensen S, Aaby P, Lund N, et al. Early BCG-Denmark and Neonatal Mortality Among Infants Weighing <2500 g: A Randomized Controlled Trial. Clin Infect Dis. 2017;65(7):1183–1190. - PMC - PubMed
    1. Moorlag SJCF, Arts RJW, van Crevel R, Netea MG. Non-specific effects of BCG vaccine on viral infections. Clin Microbiol Infect. (2019) 25:1473–8. - PubMed
    1. Nemes E, Geldenhuys H, Rozot V, et al. Prevention of M. tuberculosis Infection with H4:IC31 Vaccine or BCG Revaccination. N Engl J Med. 2018;379(2):138–149. - PMC - PubMed

Publication types