

This is a preprint.
Time-Dependent Increase in Susceptibility and Severity of Secondary Bacterial Infection during SARS-CoV-2 Infection
- PMID: 35262077
- PMCID: PMC8902874
- DOI: 10.1101/2022.02.28.482305
Time-Dependent Increase in Susceptibility and Severity of Secondary Bacterial Infection during SARS-CoV-2 Infection
Update in
-
Time-Dependent Increase in Susceptibility and Severity of Secondary Bacterial Infections During SARS-CoV-2.Front Immunol. 2022 May 12;13:894534. doi: 10.3389/fimmu.2022.894534. eCollection 2022. Front Immunol. 2022. PMID: 35634338 Free PMC article.
Abstract
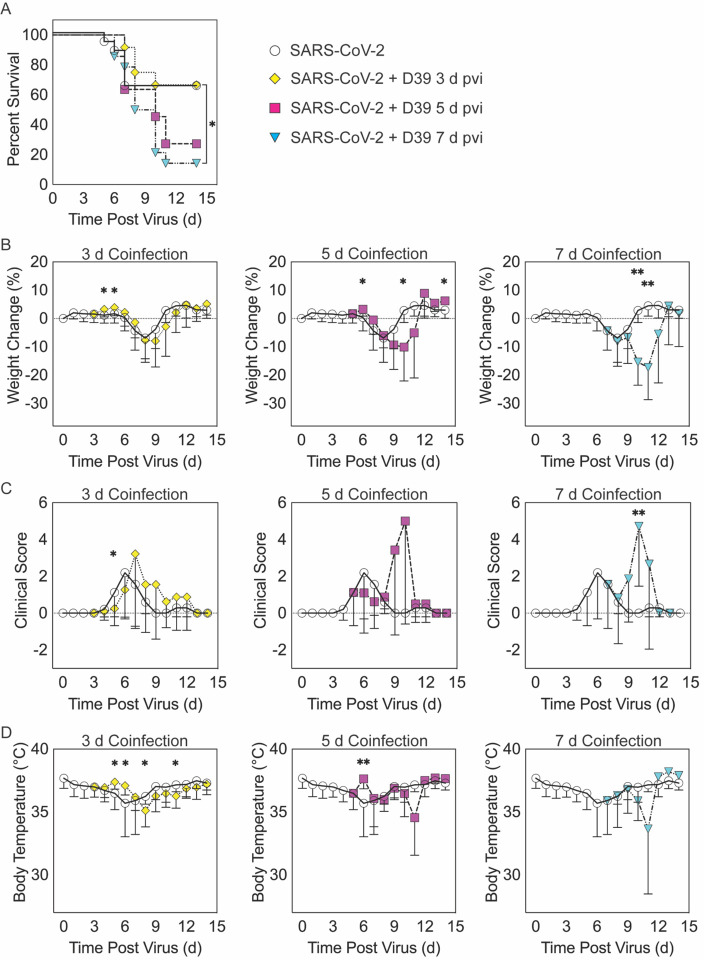
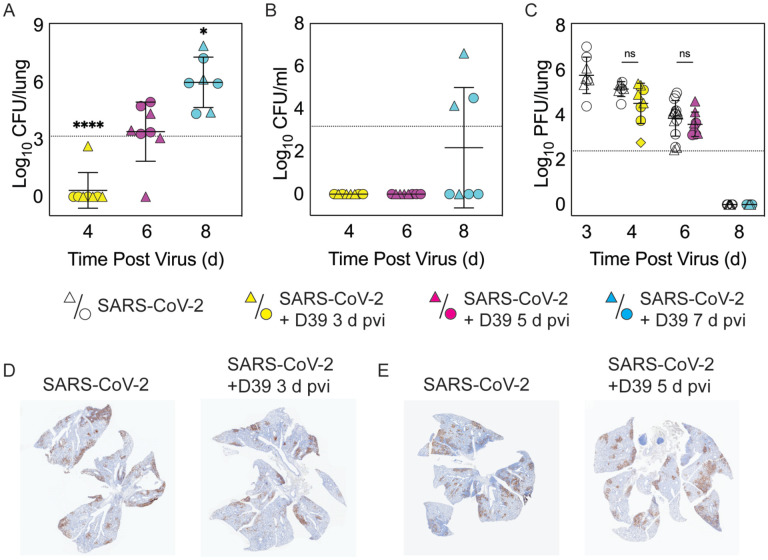
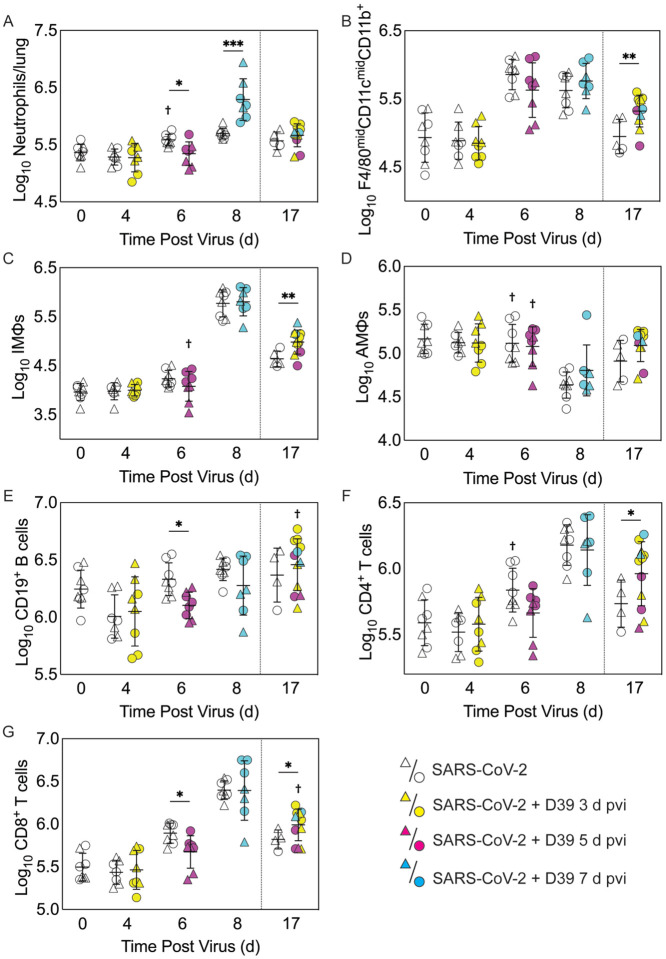
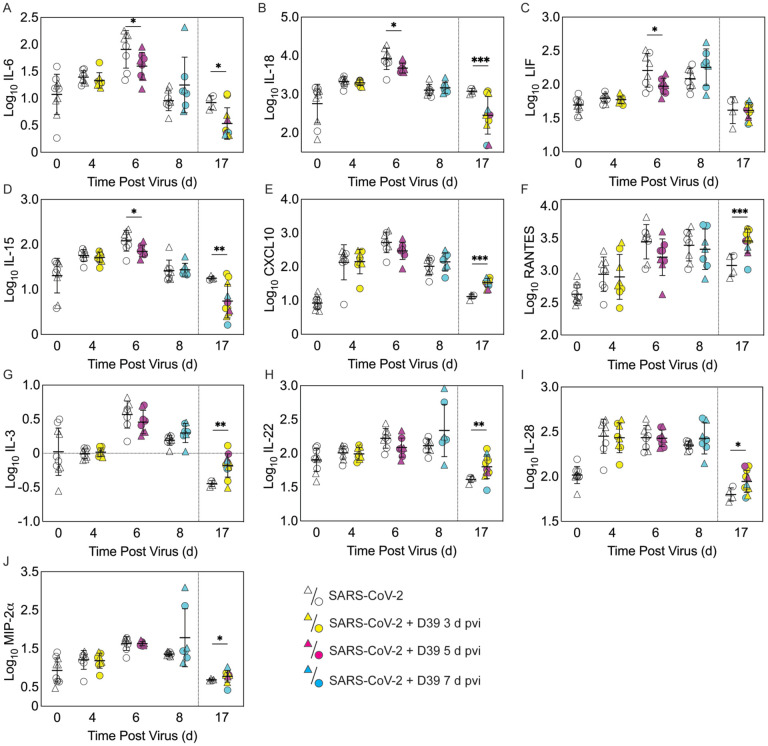
Secondary bacterial infections can exacerbate SARS-CoV-2 infection, but their prevalence and impact remain poorly understood. Here, we established that a mild to moderate SARS-CoV-2 infection increased the risk of pneumococcal coinfection in a time-dependent, but sexindependent, manner in the transgenic K18-hACE mouse model of COVID-19. Bacterial coinfection was not established at 3 d post-virus, but increased lethality was observed when the bacteria was initiated at 5 or 7 d post-virus infection (pvi). Bacterial outgrowth was accompanied by neutrophilia in the groups coinfected at 7 d pvi and reductions in B cells, T cells, IL-6, IL-15, IL-18, and LIF were present in groups coinfected at 5 d pvi. However, viral burden, lung pathology, cytokines, chemokines, and immune cell activation were largely unchanged after bacterial coinfection. Examining surviving animals more than a week after infection resolution suggested that immune cell activation remained high and was exacerbated in the lungs of coinfected animals compared with SARS-CoV-2 infection alone. These data suggest that SARS-CoV-2 increases susceptibility and pathogenicity to bacterial coinfection, and further studies are needed to understand and combat disease associated with bacterial pneumonia in COVID-19 patients.
Figures
Similar articles
-
Time-Dependent Increase in Susceptibility and Severity of Secondary Bacterial Infections During SARS-CoV-2.Front Immunol. 2022 May 12;13:894534. doi: 10.3389/fimmu.2022.894534. eCollection 2022. Front Immunol. 2022. PMID: 35634338 Free PMC article.
-
Cytokines and Lipid Mediators of Inflammation in Lungs of SARS-CoV-2 Infected Mice.Front Immunol. 2022 Jun 24;13:893792. doi: 10.3389/fimmu.2022.893792. eCollection 2022. Front Immunol. 2022. PMID: 35812400 Free PMC article.
-
SARS-CoV-2 infection predisposes patients to coinfection with Staphylococcus aureus.mBio. 2024 Aug 14;15(8):e0166724. doi: 10.1128/mbio.01667-24. Epub 2024 Jul 22. mBio. 2024. PMID: 39037272 Free PMC article.
-
TB and COVID-19: An Exploration of the Characteristics and Resulting Complications of Co-infection.Front Biosci (Schol Ed). 2022 Mar 1;14(1):6. doi: 10.31083/j.fbs1401006. Front Biosci (Schol Ed). 2022. PMID: 35320917 Free PMC article. Review.
-
Immunopathological Changes in SARS-CoV-2 Critical and Non-critical Pneumonia Patients: A Systematic Review to Determine the Cause of Co-infection.Front Public Health. 2021 Feb 9;8:544993. doi: 10.3389/fpubh.2020.544993. eCollection 2020. Front Public Health. 2021. PMID: 33634060 Free PMC article.
Cited by
-
Connectome-based modelling of neurodegenerative diseases: towards precision medicine and mechanistic insight.Nat Rev Neurosci. 2023 Oct;24(10):620-639. doi: 10.1038/s41583-023-00731-8. Epub 2023 Aug 24. Nat Rev Neurosci. 2023. PMID: 37620599 Review.
References
Publication types
Grants and funding
LinkOut - more resources
Full Text Sources
Miscellaneous