[Preprint]. 2022 Mar 2:2021.07.15.452246.
doi: 10.1101/2021.07.15.452246.

Gut microbiome dysbiosis during COVID-19 is associated with increased risk for bacteremia and microbial translocation

Affiliations

Gut microbiome dysbiosis during COVID-19 is associated with increased risk for bacteremia and microbial translocation

Mericien Venzon et al. bioRxiv. .

Update in

Abstract

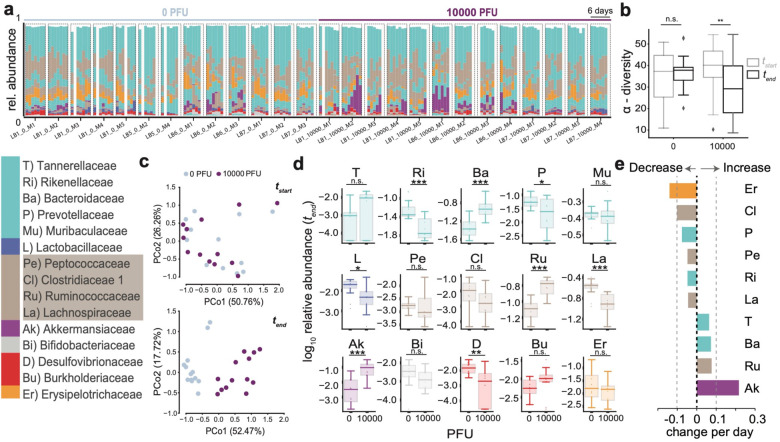
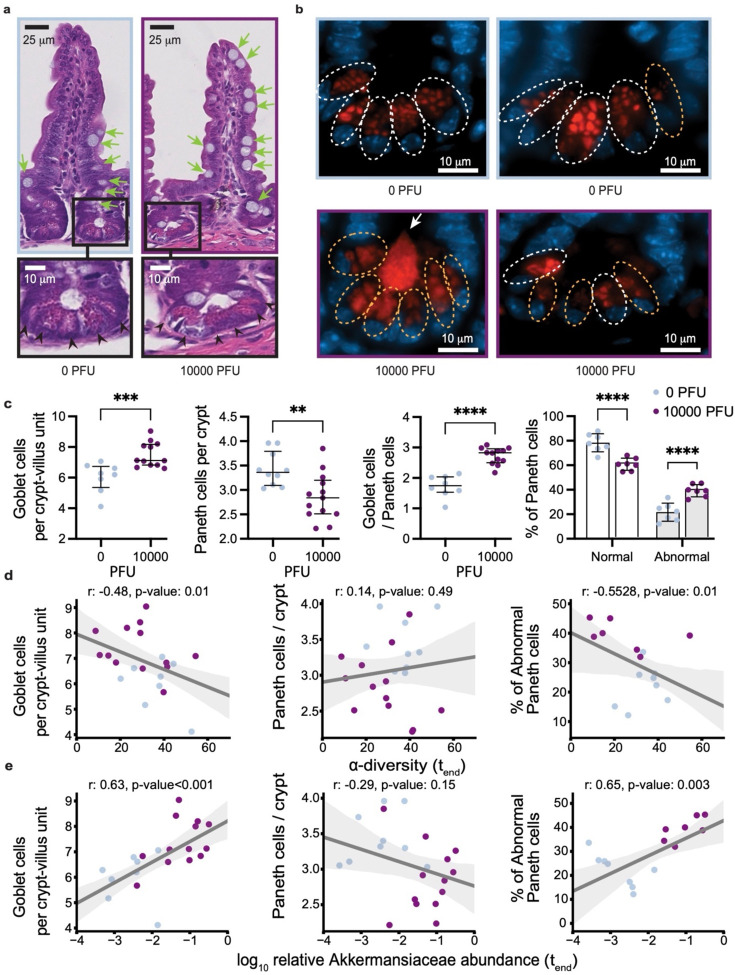
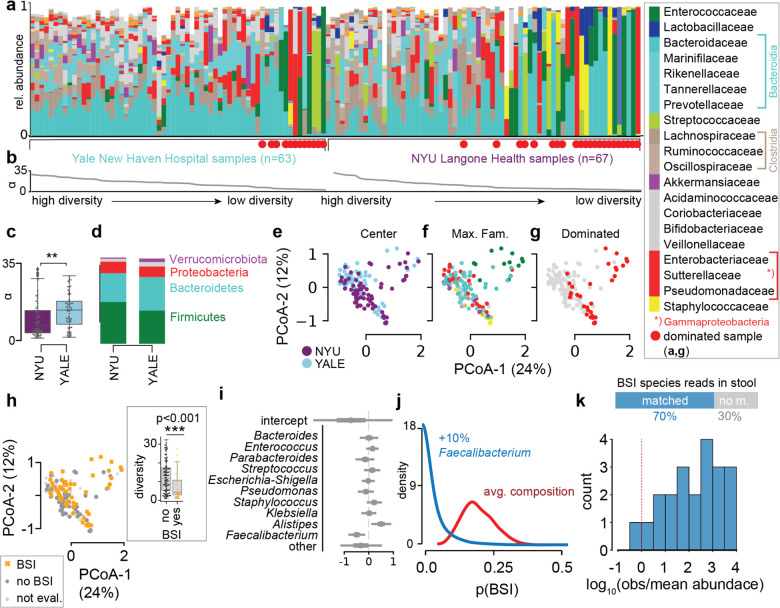
The microbial populations in the gut microbiome have recently been associated with COVID-19 disease severity. However, a causal impact of the gut microbiome on COVID-19 patient health has not been established. Here we provide evidence that gut microbiome dysbiosis is associated with translocation of bacteria into the blood during COVID-19, causing life-threatening secondary infections. Antibiotics and other treatments during COVID-19 can potentially confound microbiome associations. We therefore first demonstrate in a mouse model that SARS-CoV-2 infection can induce gut microbiome dysbiosis, which correlated with alterations to Paneth cells and goblet cells, and markers of barrier permeability. Comparison with stool samples collected from 96 COVID-19 patients at two different clinical sites also revealed substantial gut microbiome dysbiosis, paralleling our observations in the animal model. Specifically, we observed blooms of opportunistic pathogenic bacterial genera known to include antimicrobial-resistant species in hospitalized COVID-19 patients. Analysis of blood culture results testing for secondary microbial bloodstream infections with paired microbiome data obtained from these patients indicates that bacteria may translocate from the gut into the systemic circulation of COVID-19 patients. These results are consistent with a direct role for gut microbiome dysbiosis in enabling dangerous secondary infections during COVID-19.


Figures

Fig. 1.
Fig. 1.. SARS-CoV-2 infection causes gut microbiome alterations in mice.
a Timelines of fecal microbiota composition measured by 16S rRNA gene sequencing in mice infected with 0 or 104 PFU of SARS-CoV-2; time of infection=Day 1. Bars represent the composition of the 15 most abundant bacterial families per sample, blocks of samples correspond to an individual mouse’s time course (x-axis label indicate experiment id, PFU, and mouse id). b α-diversity (inverse Simpson index) per infection group in the beginning (tstart) and at the end (tend) of the experiment (n.s.: non-significant, **: p<0.01, one-tailed, paired t-test). c Principal coordinate plot of bacterial compositions in samples from the start (top) and end (bottom) of the experiment. d log10-relative family abundances at the final time point; boxplots show median and interquartile ranges, whiskers extend to 1.5 times max- and min- quartile values, n.s.: not significant; *: p-value < 0.05; **: p-value < 0.01; ***: p-value < 0.001; Wilcoxon rank-sum tests. e Regression coefficients of the estimated changes in family abundances per day in mice infected with 104 PFU obtained from linear mixed effects models with varying effects per mouse and per cage (only significant coefficient results shown, abbreviations and colors as per the bacterial family legend).
Fig. 2
Fig. 2. SARS-CoV-2 infection causes abnormalities in the gut epithelium of mice.
a. Representative H&E-stained section of the ileum depicting crypt-villus axes from K18-hACE2 mice on day 5–6 post intranasal inoculation with 10000 PFU SARS-CoV-2 or mock treatment. Green arrows indicate goblet cells, scale bars correspond to 25μm. Bottom panels show high magnification images of the indicated crypt with black arrowheads pointing at Paneth cells, scale bars correspond to 10μm. b. Representative anti-lysozyme immunofluorescence images of the ileal crypt (two images per group). White and orange doted circles delineate normal and abnormal Paneth cells, respectively. Abnormality is characterized by distorted, depleted, or diffuse lysozyme distribution patterns in Paneth cells. Lysozyme = red, DAPI = blue, scale bars correspond to 10 μm. c. Quantification of goblet cell number per villus (left), Paneth cells per crypt (middle) based on H&E staining, and frequency of normal versus abnormal Paneth cell lysozyme distribution pattern based on the immunofluorescence staining as depicted in b. Dots represent the mean cell number per crypt-villus unit in each mouse, 50 units were counted per mouse. Results were pooled from 3 independent experiments with n=3–5 mice per group for each experiment. Boxplots indicate median and interquartile ranges (ns=non-significant, p>0.05; **, p<0.01; ***, p<0.001; ****, p<0.0001 Mann-Whitney U-test). d. Correlation of Goblet cell number per villus (left, Pearson correlation r=−0.48, p=0.015), Paneth cells per crypt (middle, r=0.14, p-value=0.483) and frequency of abnormal Paneth cell lysozyme distribution pattern (right, r=−0.5528, p=0.014) for the mice shown in c with α-diversity (inverse Simpson) of the gut microbiome measured at the last day before sacrifice. e. Correlation of Goblet cell number per villus (left, r=0.63, p<0.001), Paneth cells per crypt (middle, r=−0.29, p=0.149) and frequency of abnormal Paneth cell lysozyme distribution pattern (right, r=0.65, p-value=0.003) for the mice shown in c with log10-relative abundances of Akkermansia in fecal samples from the last day before sacrifice; lines: univariate linear regression, shaded region: 95% CI.
Fig. 3.
Fig. 3.. The dysbiotic gut microbiome in COVID-19 in patients from NYU Langone Health (n=60) and Yale New Haven Hospital (n=36) is associated with secondary bloodstream infections.
a Bacterial family composition in stool samples (Yale, n = 63 samples; NYU, n = 67) identified by 16S rRNA gene sequencing; bars represent the relative abundances of bacterial families; red circles indicate samples with single taxa >50%. Samples are sorted by center and bacterial α-diversity (inverse Simpson index, b). c α-diversity in samples from NYU Langone Health and Yale New Haven Hospital; **p<0.01, two-sided T-test. d Average phylum level composition per center. e-g Principal coordinate plots of all samples shown in a, labeled by center (e), most abundant bacterial family (f) and domination status of the sample (g), and BSI status; inset: boxplot of inverse Simpson index diversity by BSI (h). i Coefficients from a Bayesian logistic regression with most abundant bacterial genera as predictors of BSI status. j Counterfactual posterior predictions of BSI risk based on bacterial composition contrasting the predicted risk of the average composition across all samples (red) with the risk predicted from a composition where Faecalibacterium was increased by 10% (blue). k shotgun metagenomic reads matched the species identified in clinical blood cultures in 70% of all investigated cases; the histogram shows the distribution of log10-ratios of relative abundances of matched species in corresponding stool samples to their corresponding mean abundances across all samples.

References

    1. Fajgenbaum D. C. & June C. H. Cytokine Storm. N. Engl. J. Med. 383, 2255–2273 (2020). - PMC - PubMed
    1. Lucas C. et al. Longitudinal analyses reveal immunological misfiring in severe COVID-19. Nature 584, 463–469 (2020). - PMC - PubMed
    1. Zuo T. et al. Alterations in Gut Microbiota of Patients With COVID-19 During Time of Hospitalization. Gastroenterology 159, 944–955.e8 (2020). - PMC - PubMed
    1. Yeoh Y. K. et al. Gut microbiota composition reflects disease severity and dysfunctional immune responses in patients with COVID-19. Gut 70, 698–706 (2021). - PMC - PubMed
    1. Gu S. et al. Alterations of the gut microbiota in patients with coronavirus disease 2019 or H1N1 influenza. Clin. Infect. Dis. 71, 2669–2678 (2020). - PMC - PubMed

Publication types