[Preprint]. 2022 Mar 2:2022.03.01.482548.
doi: 10.1101/2022.03.01.482548.

Immunological memory to Common Cold Coronaviruses assessed longitudinally over a three-year period

Affiliations

Immunological memory to Common Cold Coronaviruses assessed longitudinally over a three-year period

Esther Dawen Yu et al. bioRxiv. .

Update in

Abstract

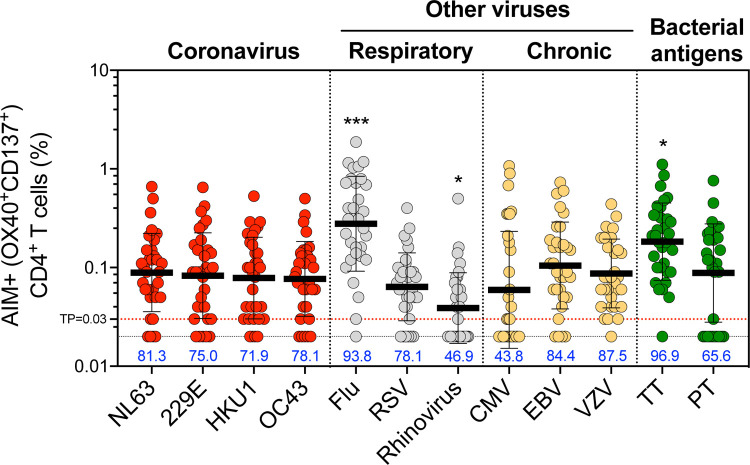
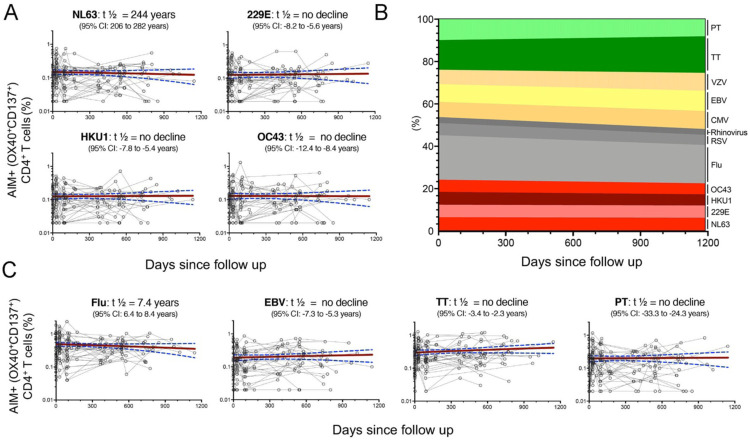
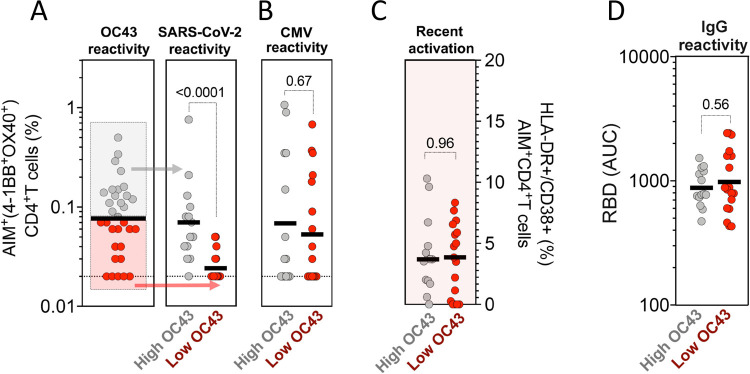
Understanding immune memory to Common Cold Coronaviruses (CCCs) is relevant for assessing its potential impact on the outcomes of SARS-CoV-2 infection, and for the prospects of pan-corona vaccines development. We performed a longitudinal analysis, of pre-pandemic samples collected from 2016-2019. CD4+ T cells and antibody responses specific for CCC and to other respiratory viruses, and chronic or ubiquitous pathogens were assessed. CCC-specific memory CD4+ T cells were detected in most subjects, and their frequencies were comparable to those for other common antigens. Notably, responses to CCC and other antigens such as influenza and Tetanus Toxoid (TT) were sustained over time. CCC-specific CD4+ T cell responses were also associated with low numbers of HLA-DR+CD38+ cells and their magnitude did not correlate with yearly changes in the prevalence of CCC infections. Similarly, spike RBD-specific IgG responses for CCC were stable throughout the sampling period. Finally, high CD4+ T cell reactivity to CCC, but not antibody responses, was associated with high pre-existing SARS-CoV-2 immunity. Overall, these results suggest that the steady and sustained CCC responses observed in the study cohort are likely due to a relatively stable pool of CCC-specific memory CD4+ T cells instead of fast decaying responses and frequent reinfections.


Conflict of interest statement

Declaration of Interests

A.Se. is a consultant for Gritstone Bio, Flow Pharma, Arcturus Therapeutics, ImmunoScape, CellCarta, Avalia, Moderna, Fortress and Repertoire. S.C. is a consultant for Avalia. LJI has filed for patent protection for various aspects of SARS-CoV-2 epitope pools design. All other authors declare no conflict of interest.

Materials & Correspondence

Epitope pools used in this study will be made available to the scientific community upon request, and following execution of a material transfer agreement (MTA), by contacting A.S. (alex@lji.org) and R.d.S.A (rantunes@lji.org). Likewise, biomaterials archived from this study may be shared for further research with MTA.

Figures

Fig. 1
Fig. 1. CD4+ T cell responses to four representative CCC are widely detectable in the study cohort and of similar magnitude to other pathogens.
Common cold coronavirus (CCC) and several other human pathogens-specific T cell responses were measured as percentage of AIM+ (OX40+CD137+) CD4+ T cells after stimulation of PBMCs with peptides pools. Graphs show individual response of the four CCC (NL63, 229E, HKU1, and OC43) and other pathogens plotted as background subtracted against DMSO negative control. First time point of the longitudinal series is plotted (n = 32) and associated percentage of positive response for each antigen is indicated. TP=threshold of positivity. Data are represented as geometric mean and SD. Kruskal-Wallis test adjusted with Dunn’s test for multiple comparisons was performed and adjusted p values < 0.05 considered statistically significant. *, p < 0.05, ***, p < 0.001.
Fig. 2
Fig. 2. CCC-specific CD4+ T cells are largely classic memory CD4 T cells.
CCC-specific CD4+ T cell subsets (Tn: CD45RA+ CCR7+, Temra: CD45RA+ CCR7−, Tcm: CD45RA− CCR7+ and Tem: CD45RA− CCR7−) were measured after stimulation of PBMCs with specific peptide pools. (A) Representative FACS plots, gated on the CCC-specific CD4+ T cells (red) measured as percentage of AIM+ (OX40+CD137+) from total CD4 T cells (Left), with the four subsets indicated in each quadrant for AIM+ cells (red) or total CD4+ T cells (black) (Right) are shown. (B) Percentages of T cell subsets from antigen-specific CD4+ T cells (OX40+CD137+) responding to the indicated pools of CCC and with SI>2 in each cohort (n = 32) at first time point are shown. Each dot represents the response of an individual subject to an individual pool and error bars represent median with interquantile range.
Fig. 3
Fig. 3. CD4+ T cells responses to CCC and other antigens are sustained over time.
Antigen-specific T cell responses were measured as percentage of AIM+ (OX40+CD137+) CD4+ T cells after stimulation of PBMCs with peptides pools. Individual responses of the four CCC (A,B) or other pathogens (B,C) are shown. (A,C) Graphs show responses plotted with all time points of the longitudinal series connected with lines for each subject (n = 32). The red line represents the median fitted curve from a nonlinear mixed effects model of longitudinal responses among those with a positive response at ≥ 1 time point, with 95%CI shown in blue dotted lines. t ½ calculated based on linear mixed effects model using R package nlme, t1/2 is shown as the median half-life estimated from the median slope with the associated 95% CI indicated. (B) Longitudinal occurrence of each individual pathogen response distributed in overall percentage (sum of all absolute responses) in relation to the days since follow up.
Fig. 4
Fig. 4. CCC-specific CD4+ T cell responses are stable, not associated with recent activation or yearly changes in prevalence of CCC infections.
(A) The range of fluctuation of CD4+ T cell responses was determined by calculating the fold change of antigen-specific AIM+ (OX40+CD137+) CD4+ T cells. For each antigen, AIM+ CD4+ responses at every time point were normalized to median of total longitudinal responses for each donor (n = 32), and the 5th to 95th percentile range calculated. (B) Graph shows CCC, influenza and tetanus specific CD4+ T cell responses associated with recent activation measured by calculating the % of HLA-DR+CD38+ from AIM+ (OX40+CD137+) CD4+ T cells at all time points of the longitudinal cohort. Each dot represents the response of an individual subject (n=32) to an individual pool at a single time point. Median and interquartile range are represented. (C) The prevalences of CCC infections in the west and midwest regions during 2016–2019 were categorized according to the percent of positive rates from total tests performed,: −, <1%; +, 1–2%, ++, 2–5%; +++, 5–8%; ++++, >8%, and results summarized in the table insert. CCC-specific CD4+ T cell responses for the four CCC were ploted as function of the yearly incidence (2016–2019) in the graph below. Median and interquartile range are represented. Kruskal-Wallis test adjusted with Dunn’s test for multiple comparisons was performed and adjusted p values < 0.05 considered statistically significant.
Fig. 5
Fig. 5. CCC-specific IgG responses are detected in all individuals and sustained overtime.
(A) Plasma IgG titers, measured by the AUC, to the spike receptor binding domain (RBD) protein of the CCC viruses (HCoV-229E, HCoV-NL63, HCoV-HKU1 and HCoV-OC43) are shown for first time point of the longitudinal cohort (n=32). Geometric mean titers with SD are indicated. (B) Graphs show individual CCC antibody responses plotted for all time points of the longitudinal series and connected with lines for each subject (n = 32). The red line represents the median fitted curve from a nonlinear mixed effects model of longitudinal responses among those with a positive response at ≥ 1 time point, with 95%CI shown in blue dotted lines. t ½ calculated based on linear mixed effects model using R package nlme, t1/2 is shown as the median half-life estimated from the median slope with the associated 95% CI indicated.
Fig. 6
Fig. 6. High CD4+ T cell reactivity to OC43 is associated with high pre-existing SARS-CoV-2 immunity.
Antigen-specific T cell responses were measured as percentage of AIM+ (OX40+CD137+) CD4+ T cells after stimulation of PBMCs with peptides pools for (A) CCC (OC43) and SARS-CoV-2 (representing pre-existing immunity in pre-pandemic samples), (B) CMV as a control. (C) Recent activated CCC (OC43) specific T cell responses were measured by calculating the percent of HLA-DR+CD38+ of AIM+ (OX40+CD137+) CD4+ T cells. (D) Plasma IgG titers to CCC viruses (OC43) spike receptor binding domain (RBD) protein were measured by ELISA. (A-D) Each dot represents the response of an individual subject (n=32) at first time point with median bar shown. High responders for OC43 (above median bar in A) are shown in gray, and low responders for OC43 (below median bar in A) are shown in red. The different immune responses between high and low responders were compared using Mann-whitney test, and p values < 0.05 considered statistically significant.

References

    1. van der Hoek L. et al. Identification of a new human coronavirus. Nat Med 10, 368–373, doi:10.1038/nm1024 (2004). - DOI - PMC - PubMed
    1. Walsh E. E., Shin J. H. & Falsey A. R. Clinical impact of human coronaviruses 229E and OC43 infection in diverse adult populations. J Infect Dis 208, 1634–1642, doi:10.1093/infdis/jit393 (2013). - DOI - PMC - PubMed
    1. Woo P. C. et al. Characterization and complete genome sequence of a novel coronavirus, coronavirus HKU1, from patients with pneumonia. J Virol 79, 884–895, doi:10.1128/JVI.79.2.884-895.2005 (2005). - DOI - PMC - PubMed
    1. Graat J. M. et al. A prospective, community-based study on virologic assessment among elderly people with and without symptoms of acute respiratory infection. J Clin Epidemiol 56, 1218–1223, doi:10.1016/s0895-4356(03)00171-9 (2003). - DOI - PMC - PubMed
    1. Pene F. et al. Coronavirus 229E-related pneumonia in immunocompromised patients. Clin Infect Dis 37, 929–932, doi:10.1086/377612 (2003). - DOI - PMC - PubMed

Publication types