. 2022 May 2;12(5):1314-1335.
doi: 10.1158/2159-8290.CD-21-1006.

Melanoma-Secreted Amyloid Beta Suppresses Neuroinflammation and Promotes Brain Metastasis

Affiliations

Melanoma-Secreted Amyloid Beta Suppresses Neuroinflammation and Promotes Brain Metastasis

Kevin Kleffman et al. Cancer Discov. .

Abstract

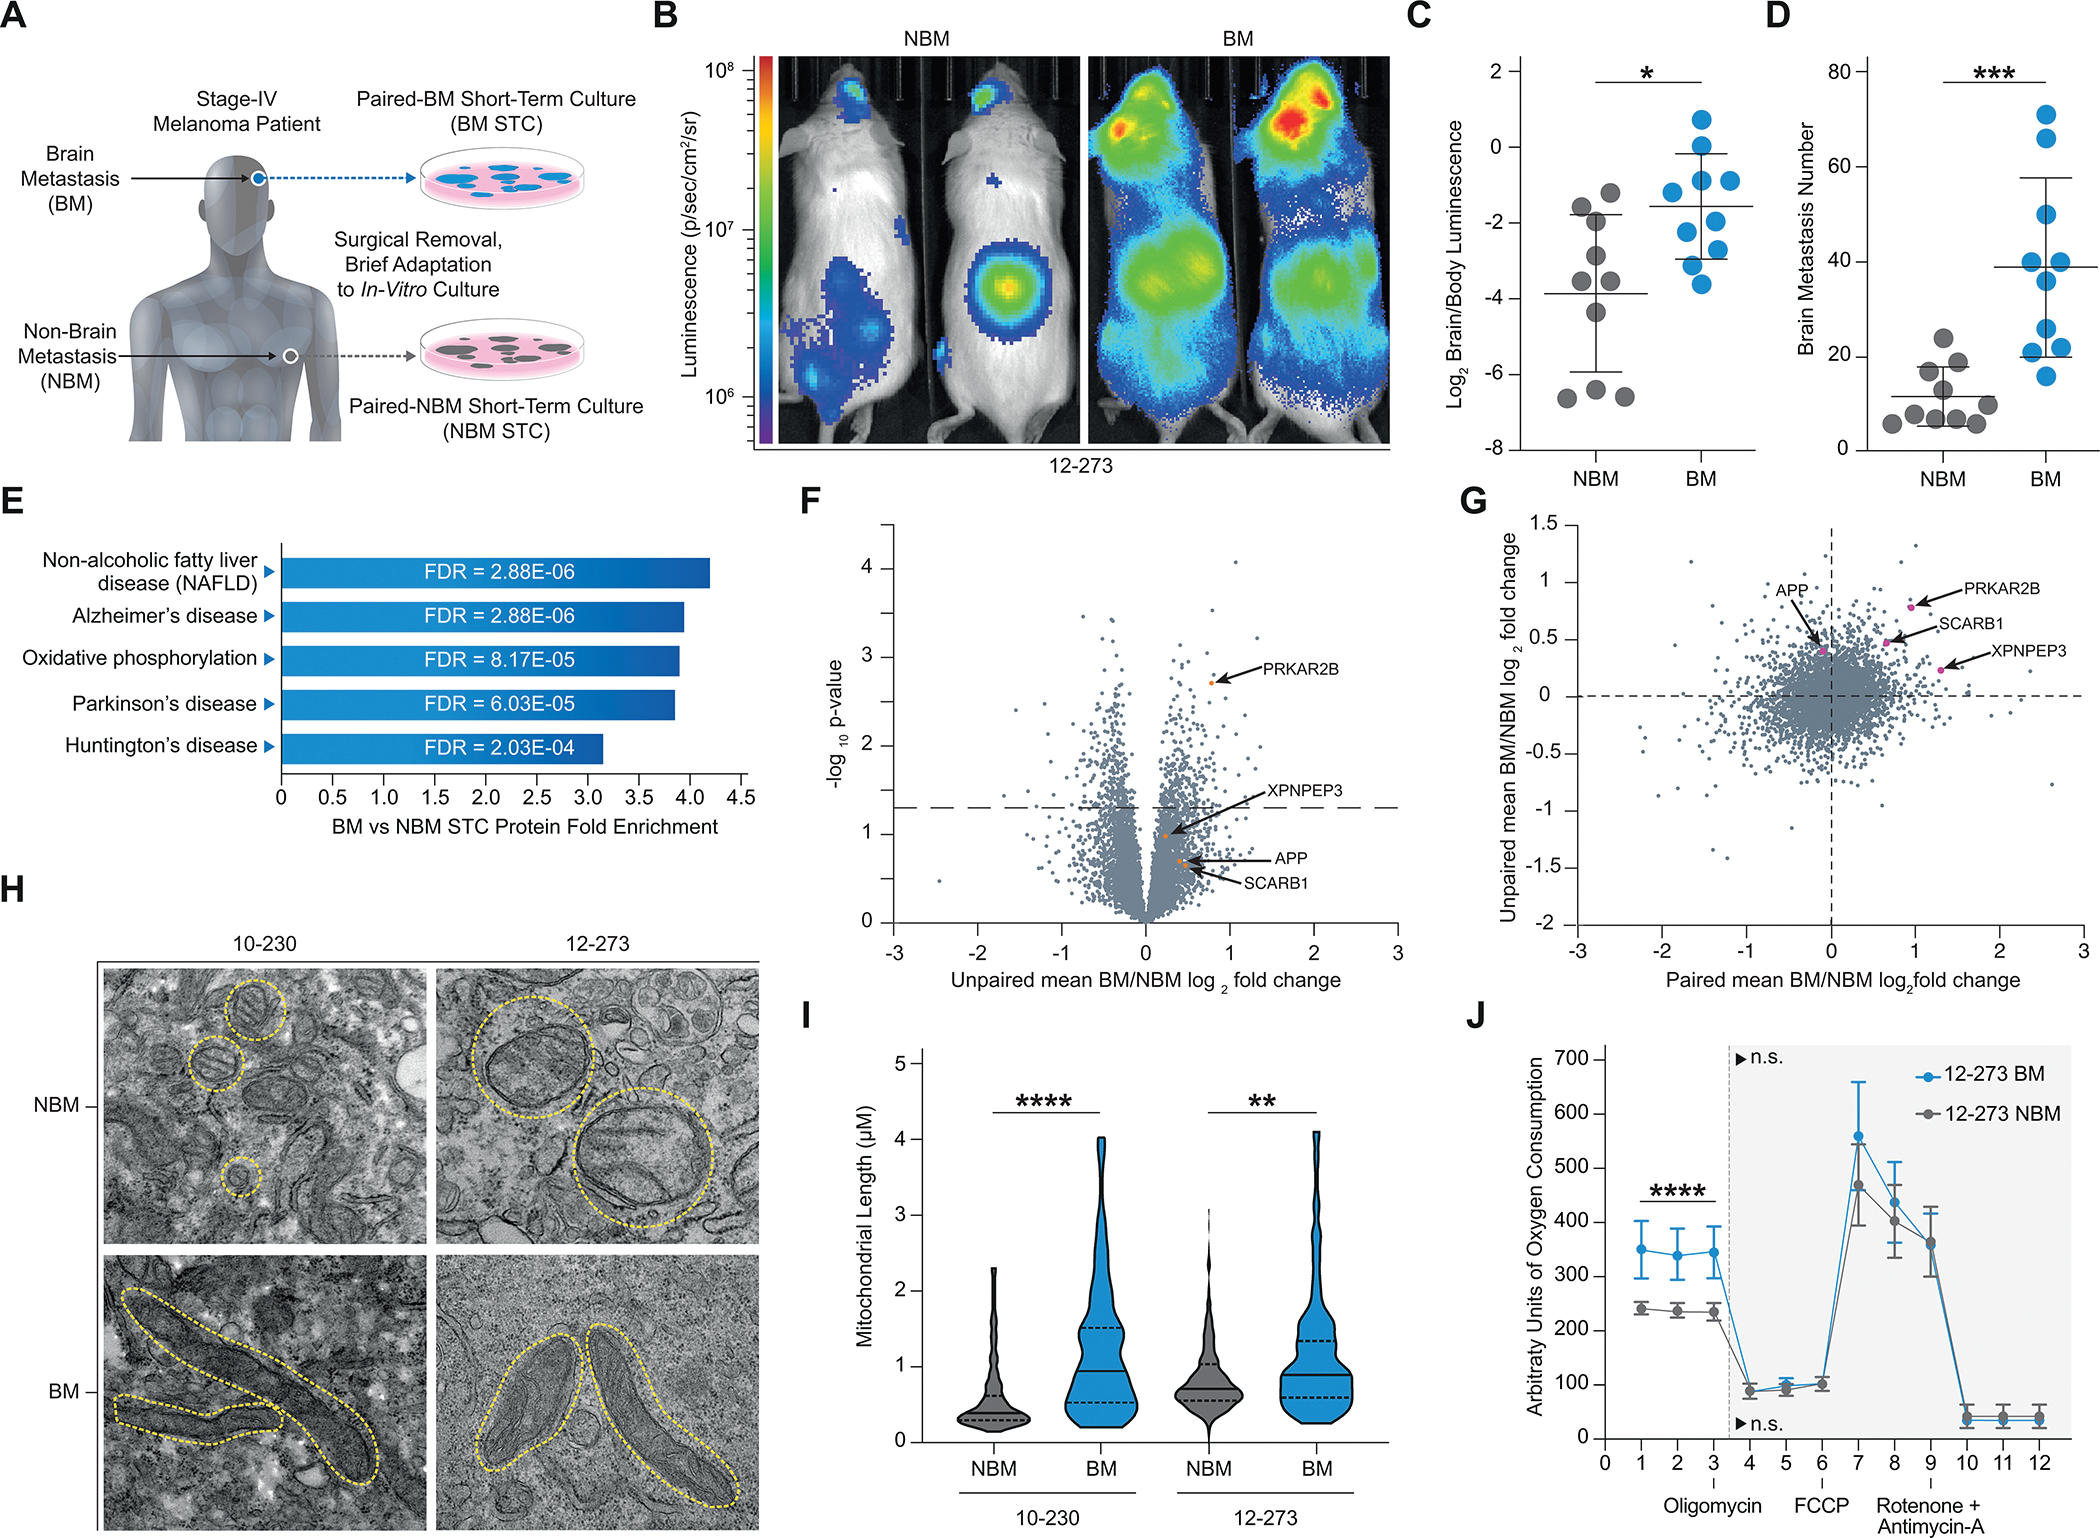
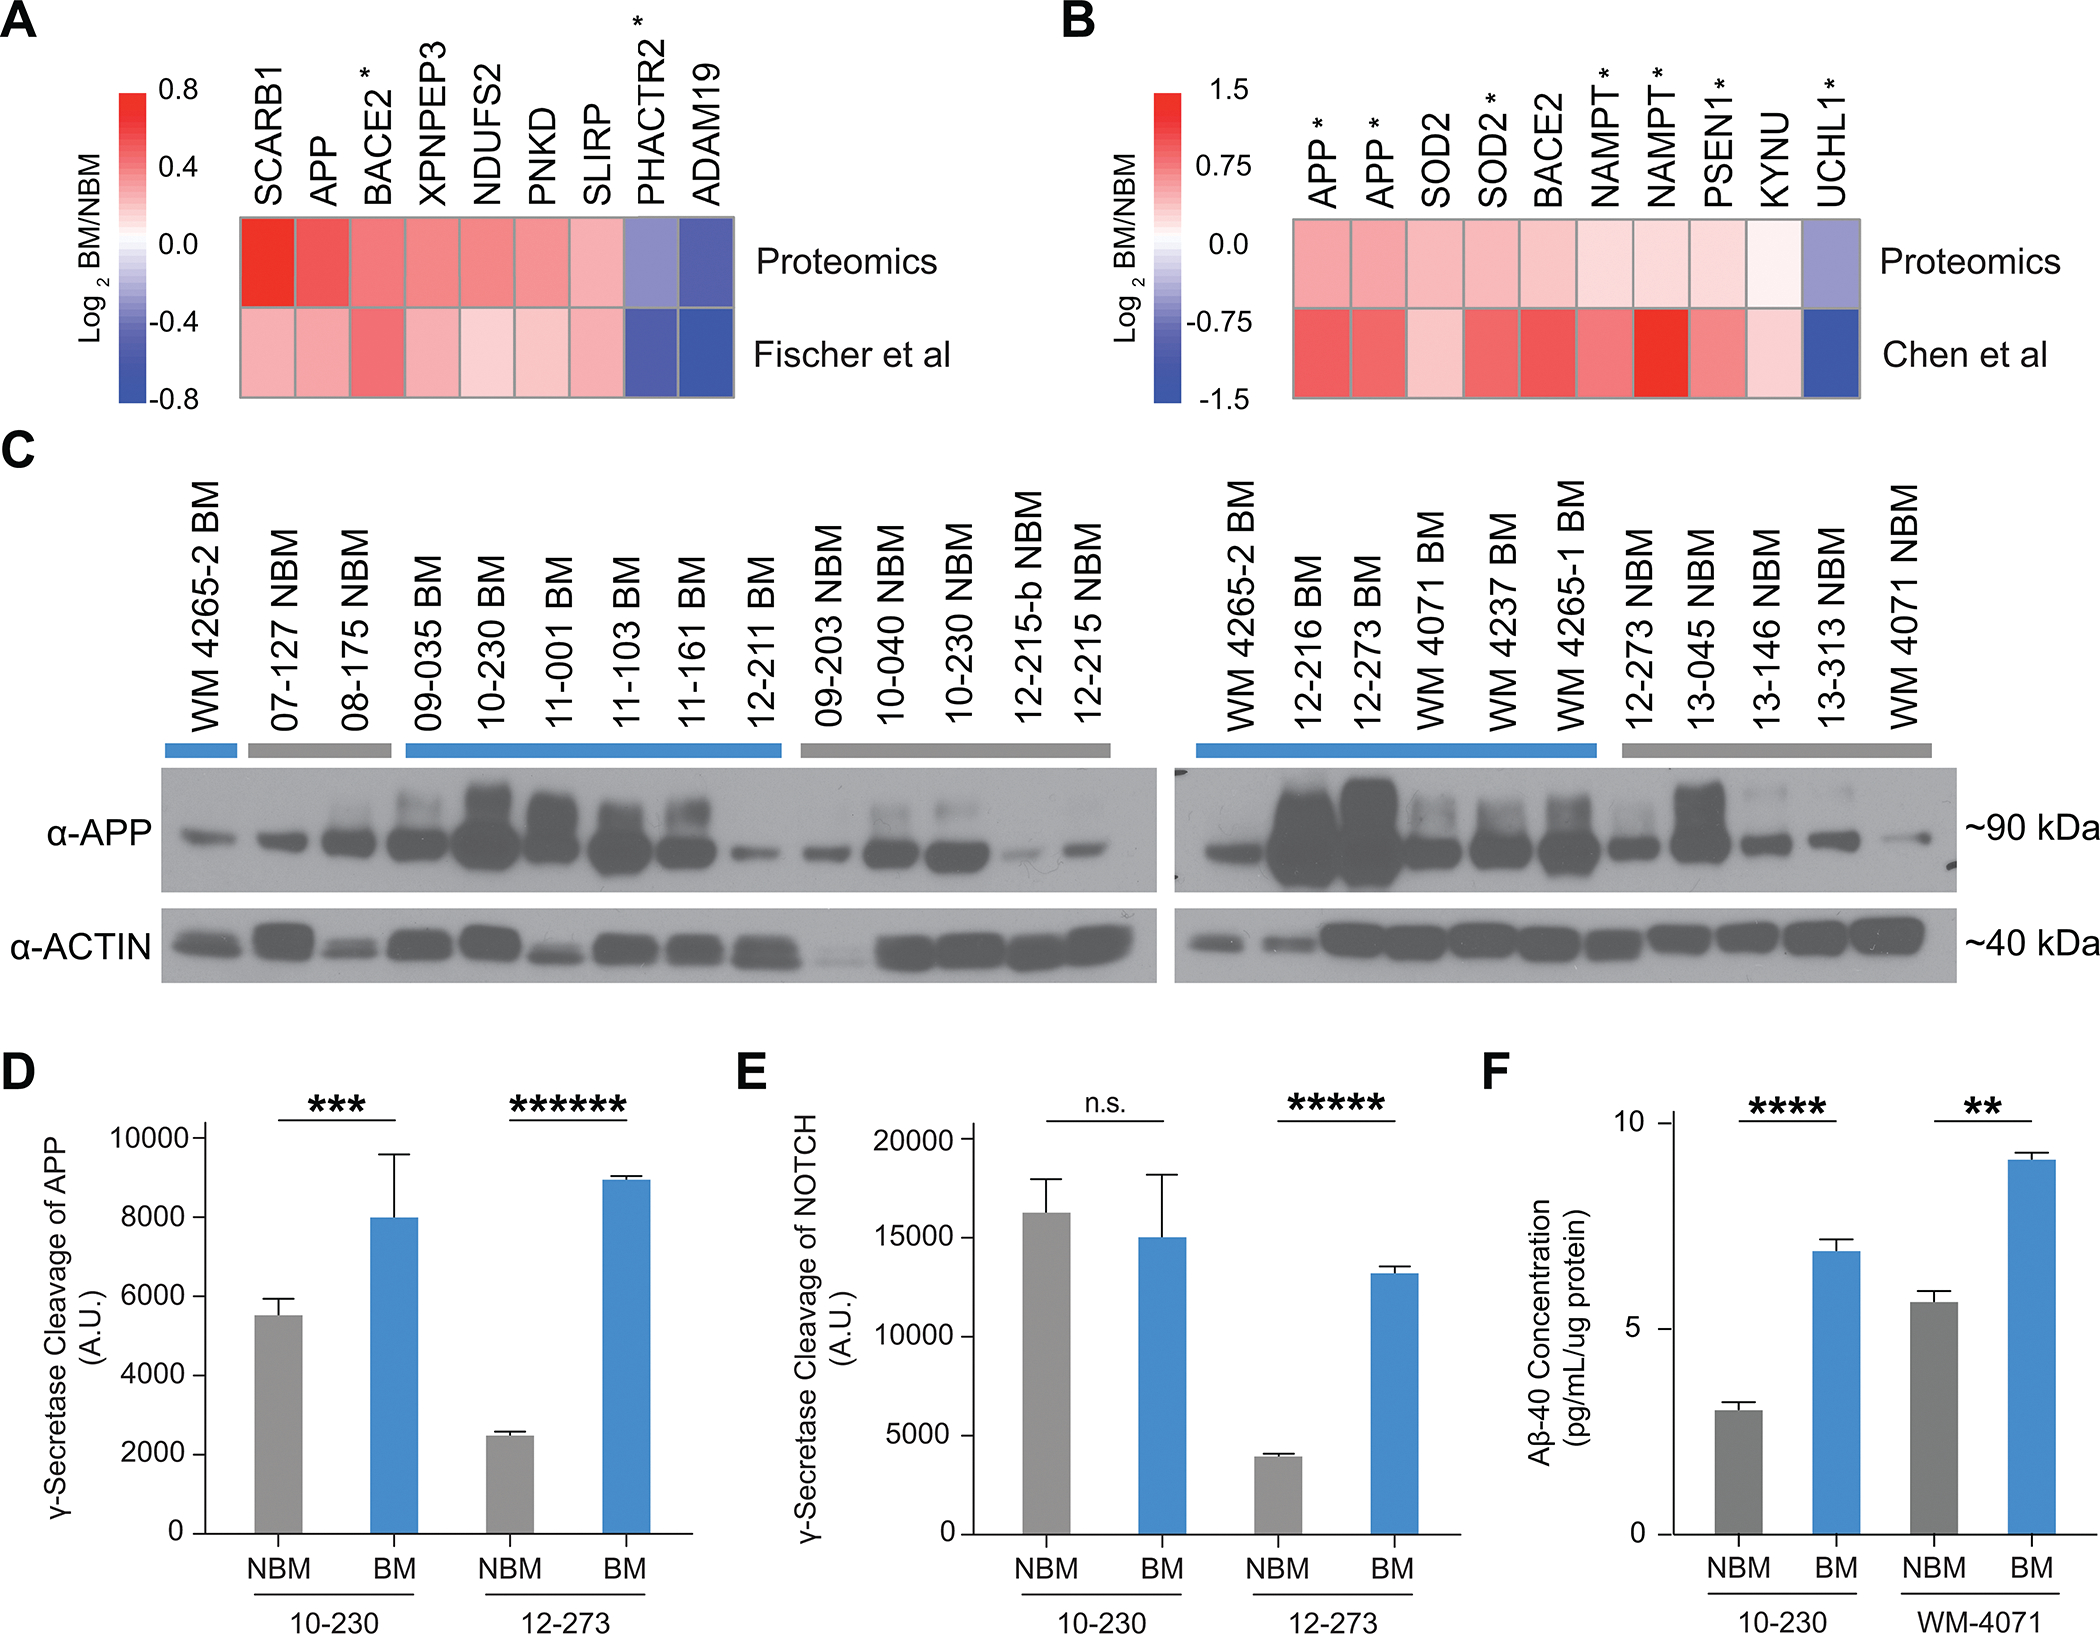
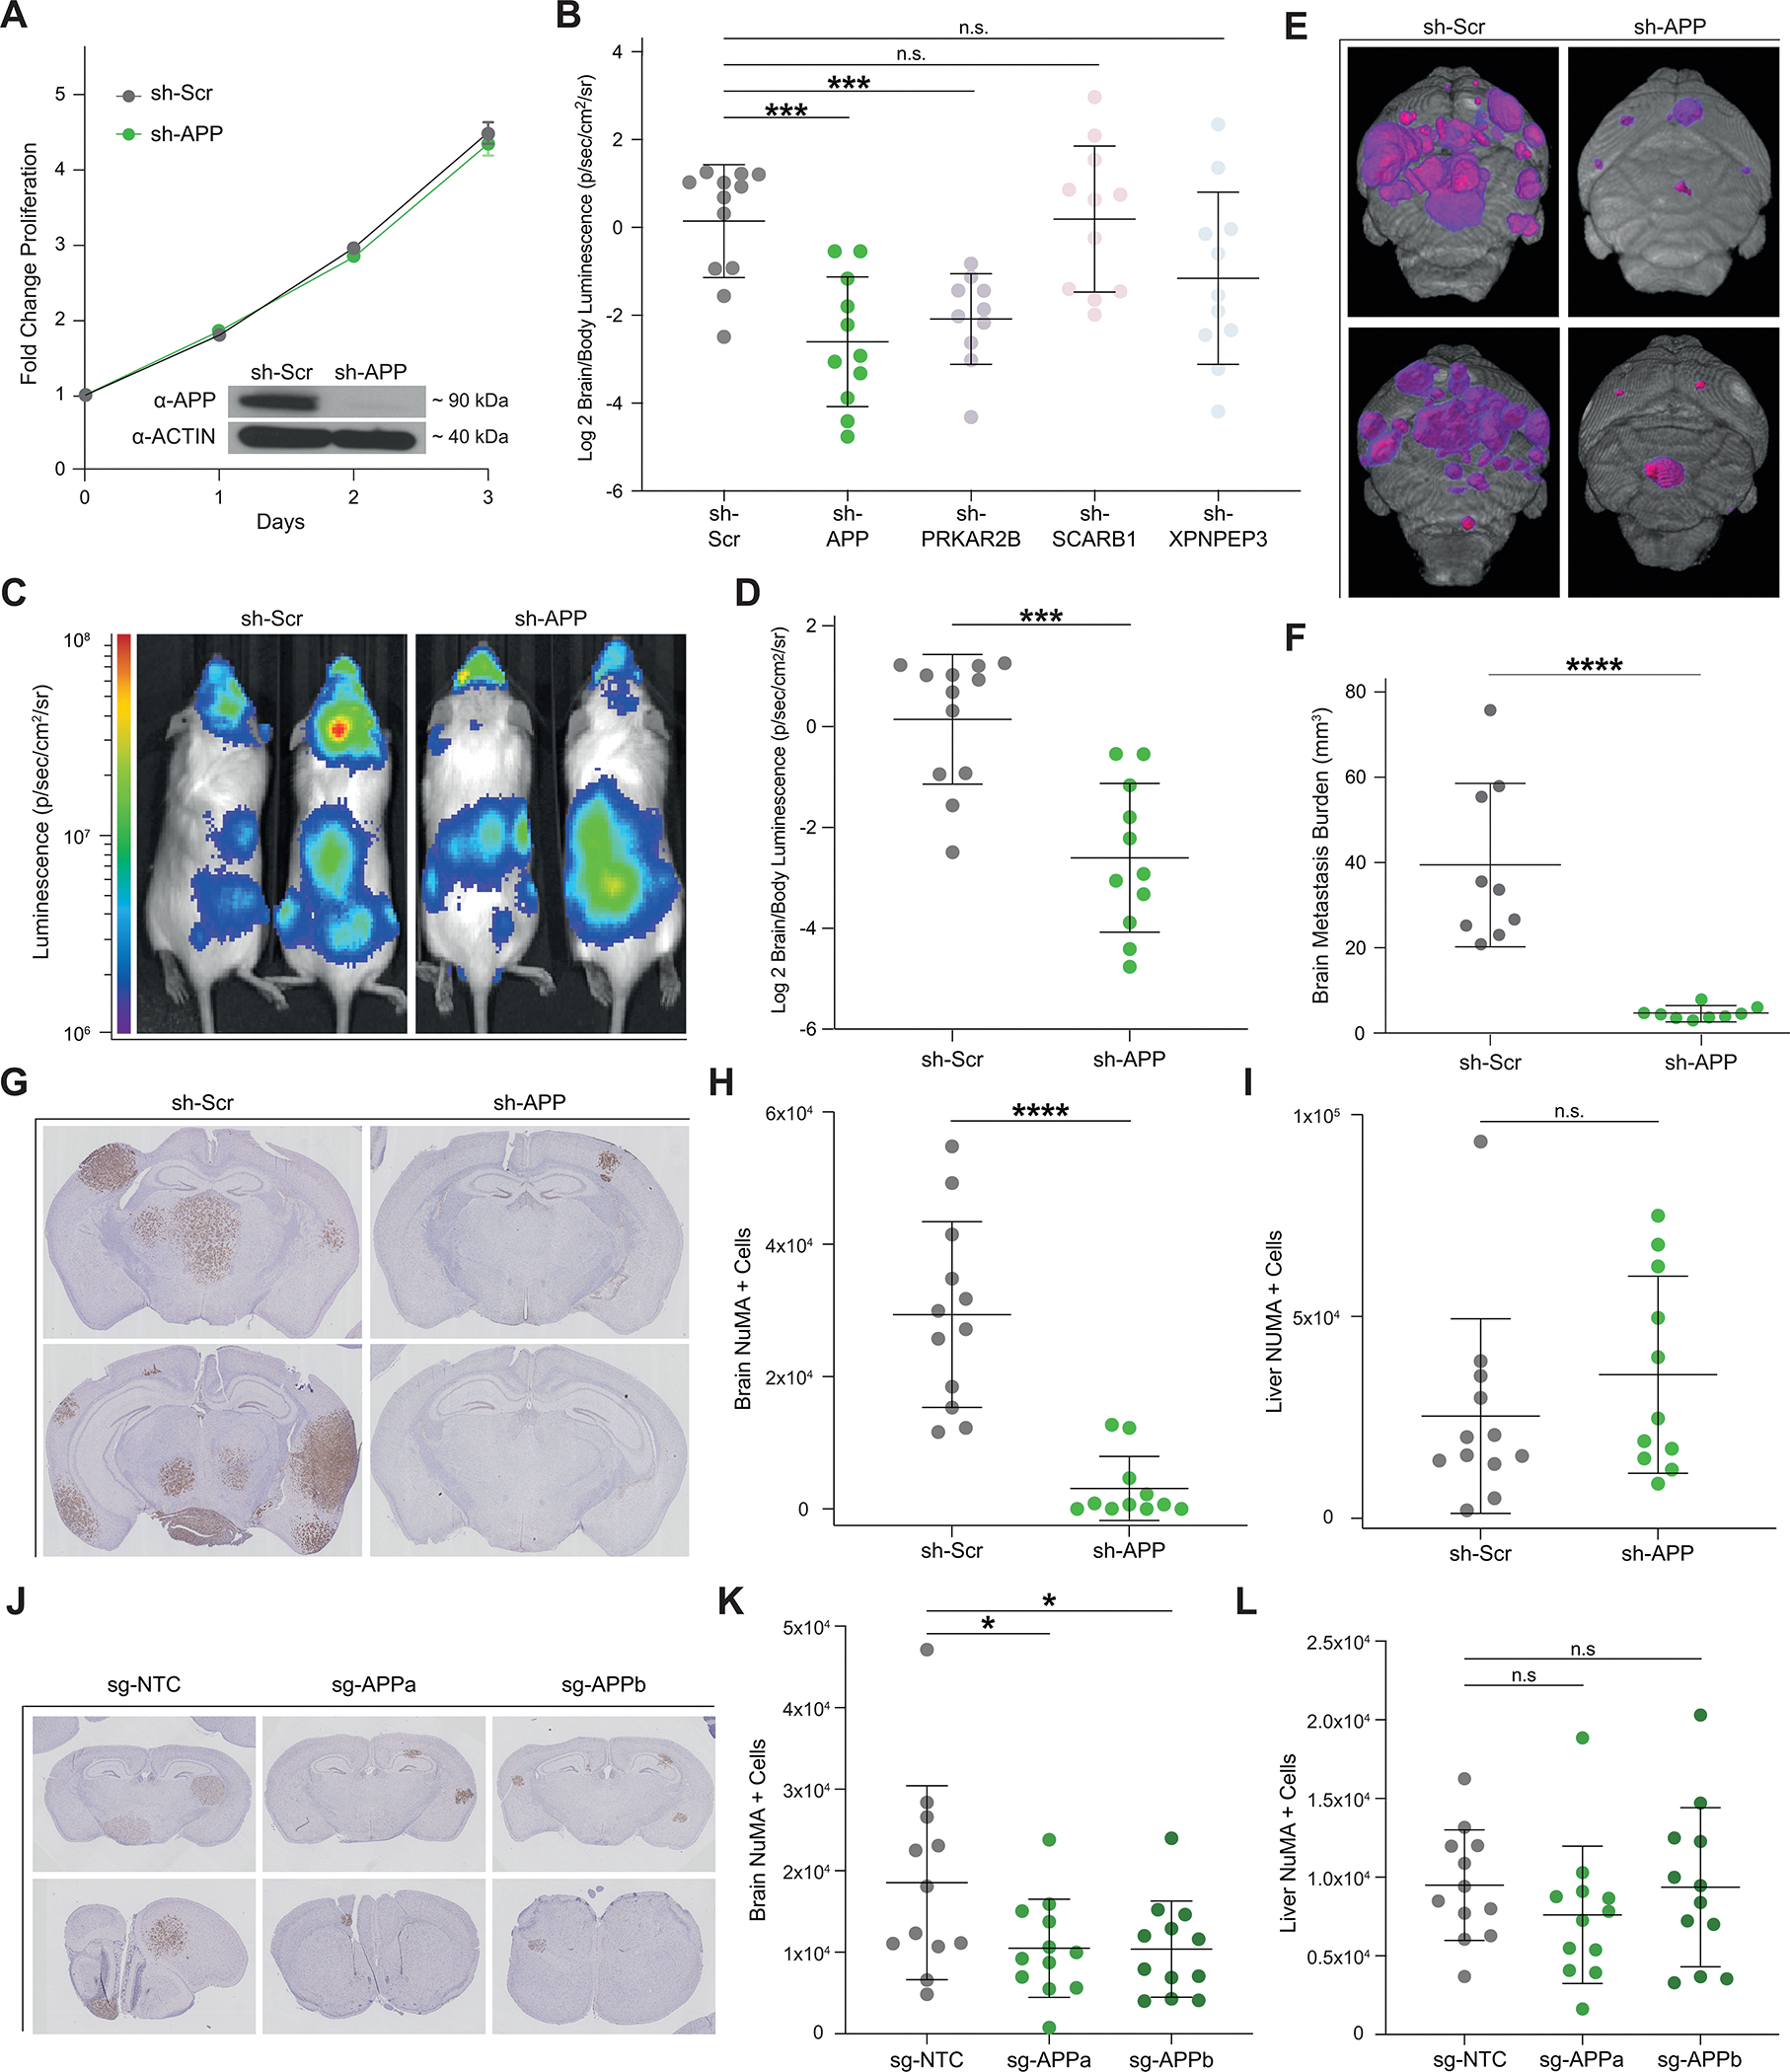
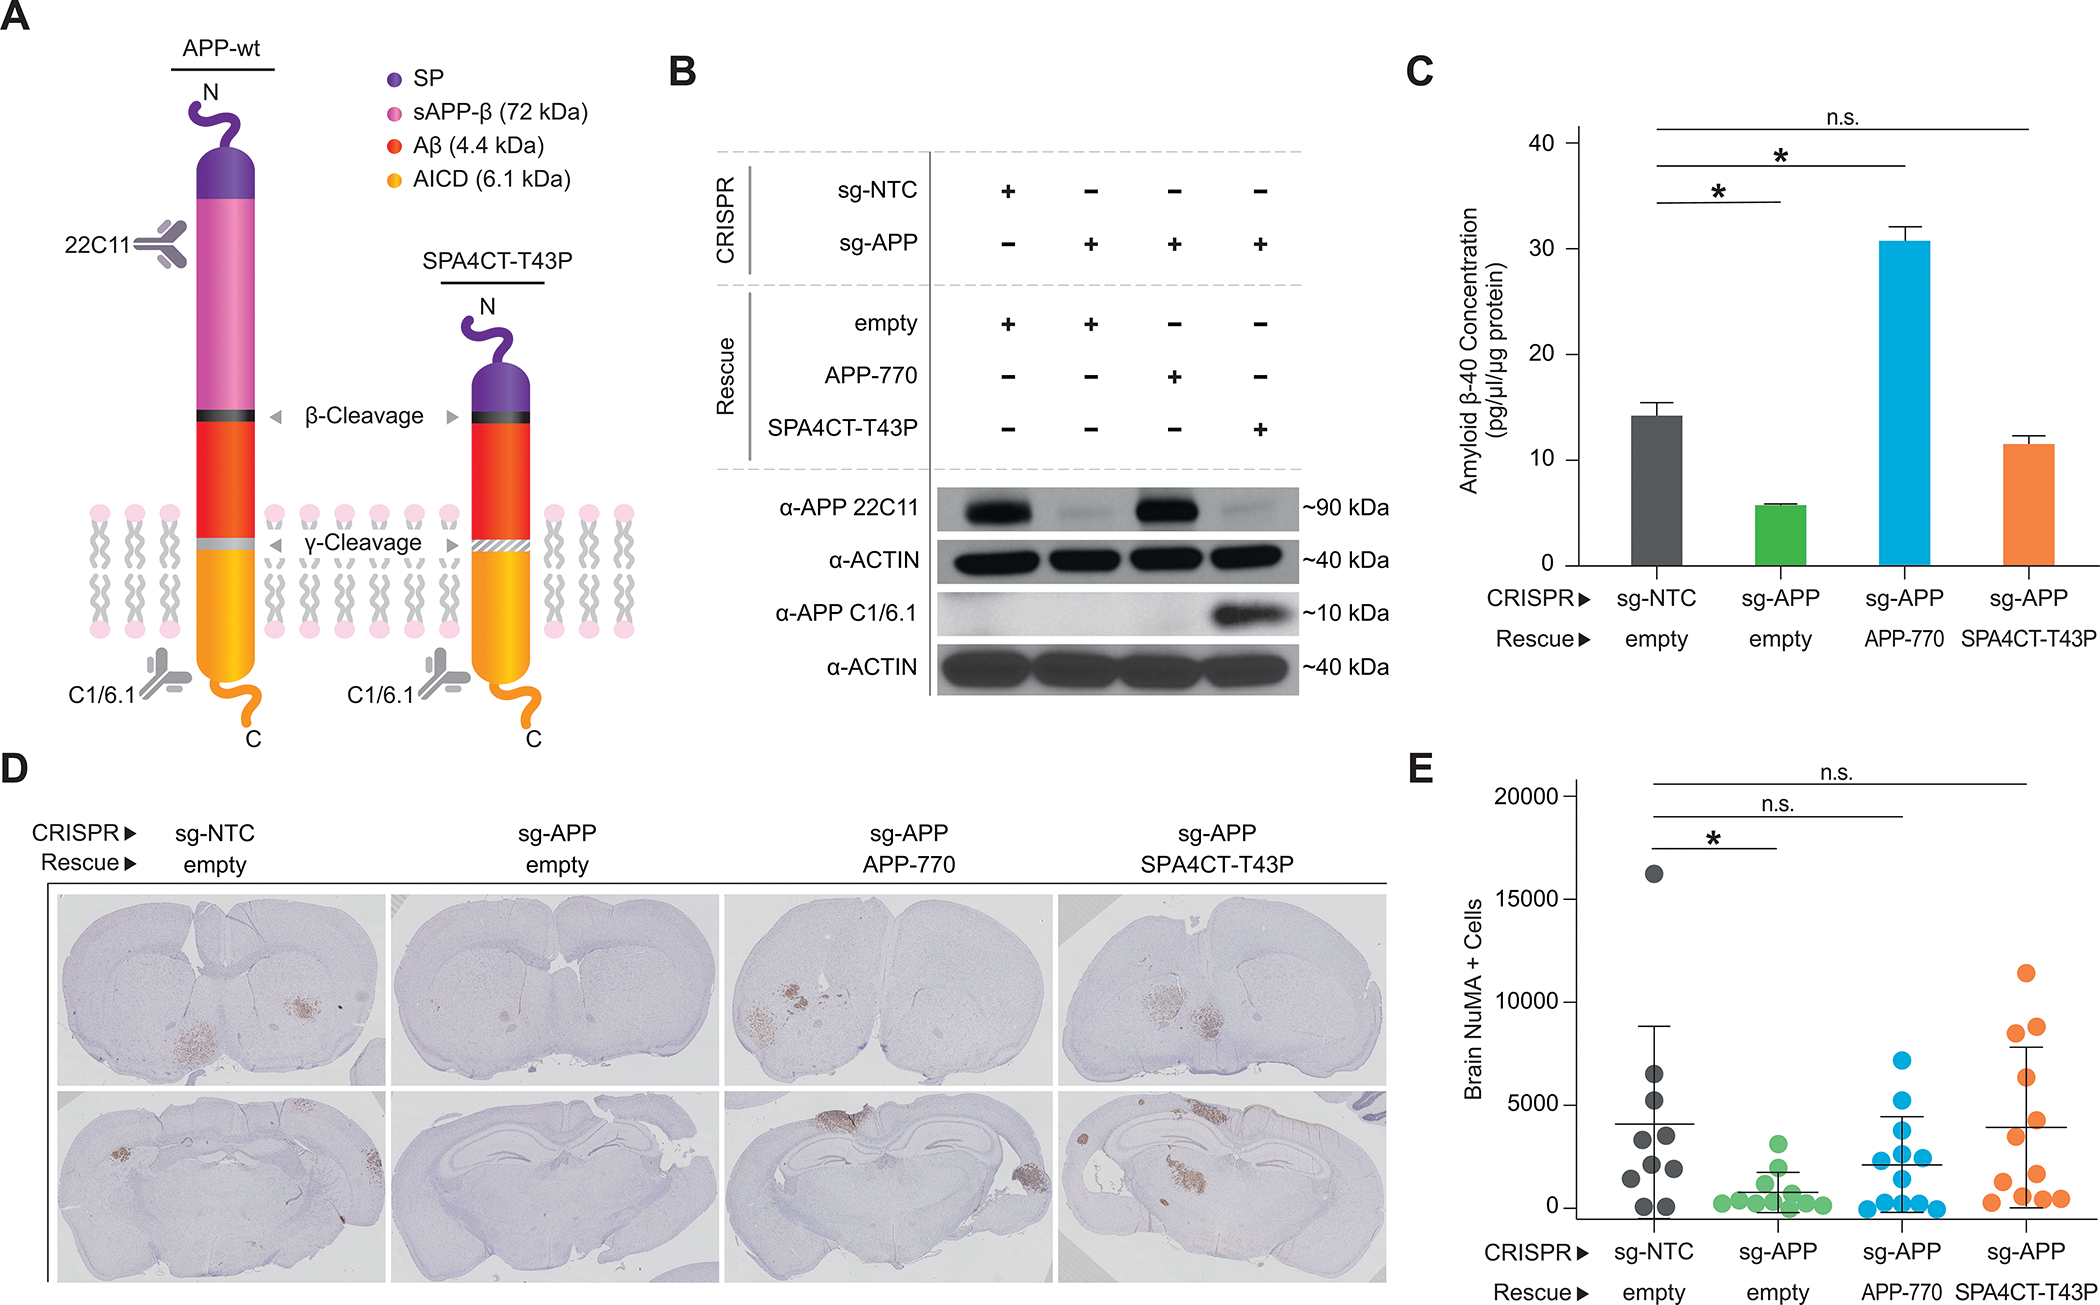
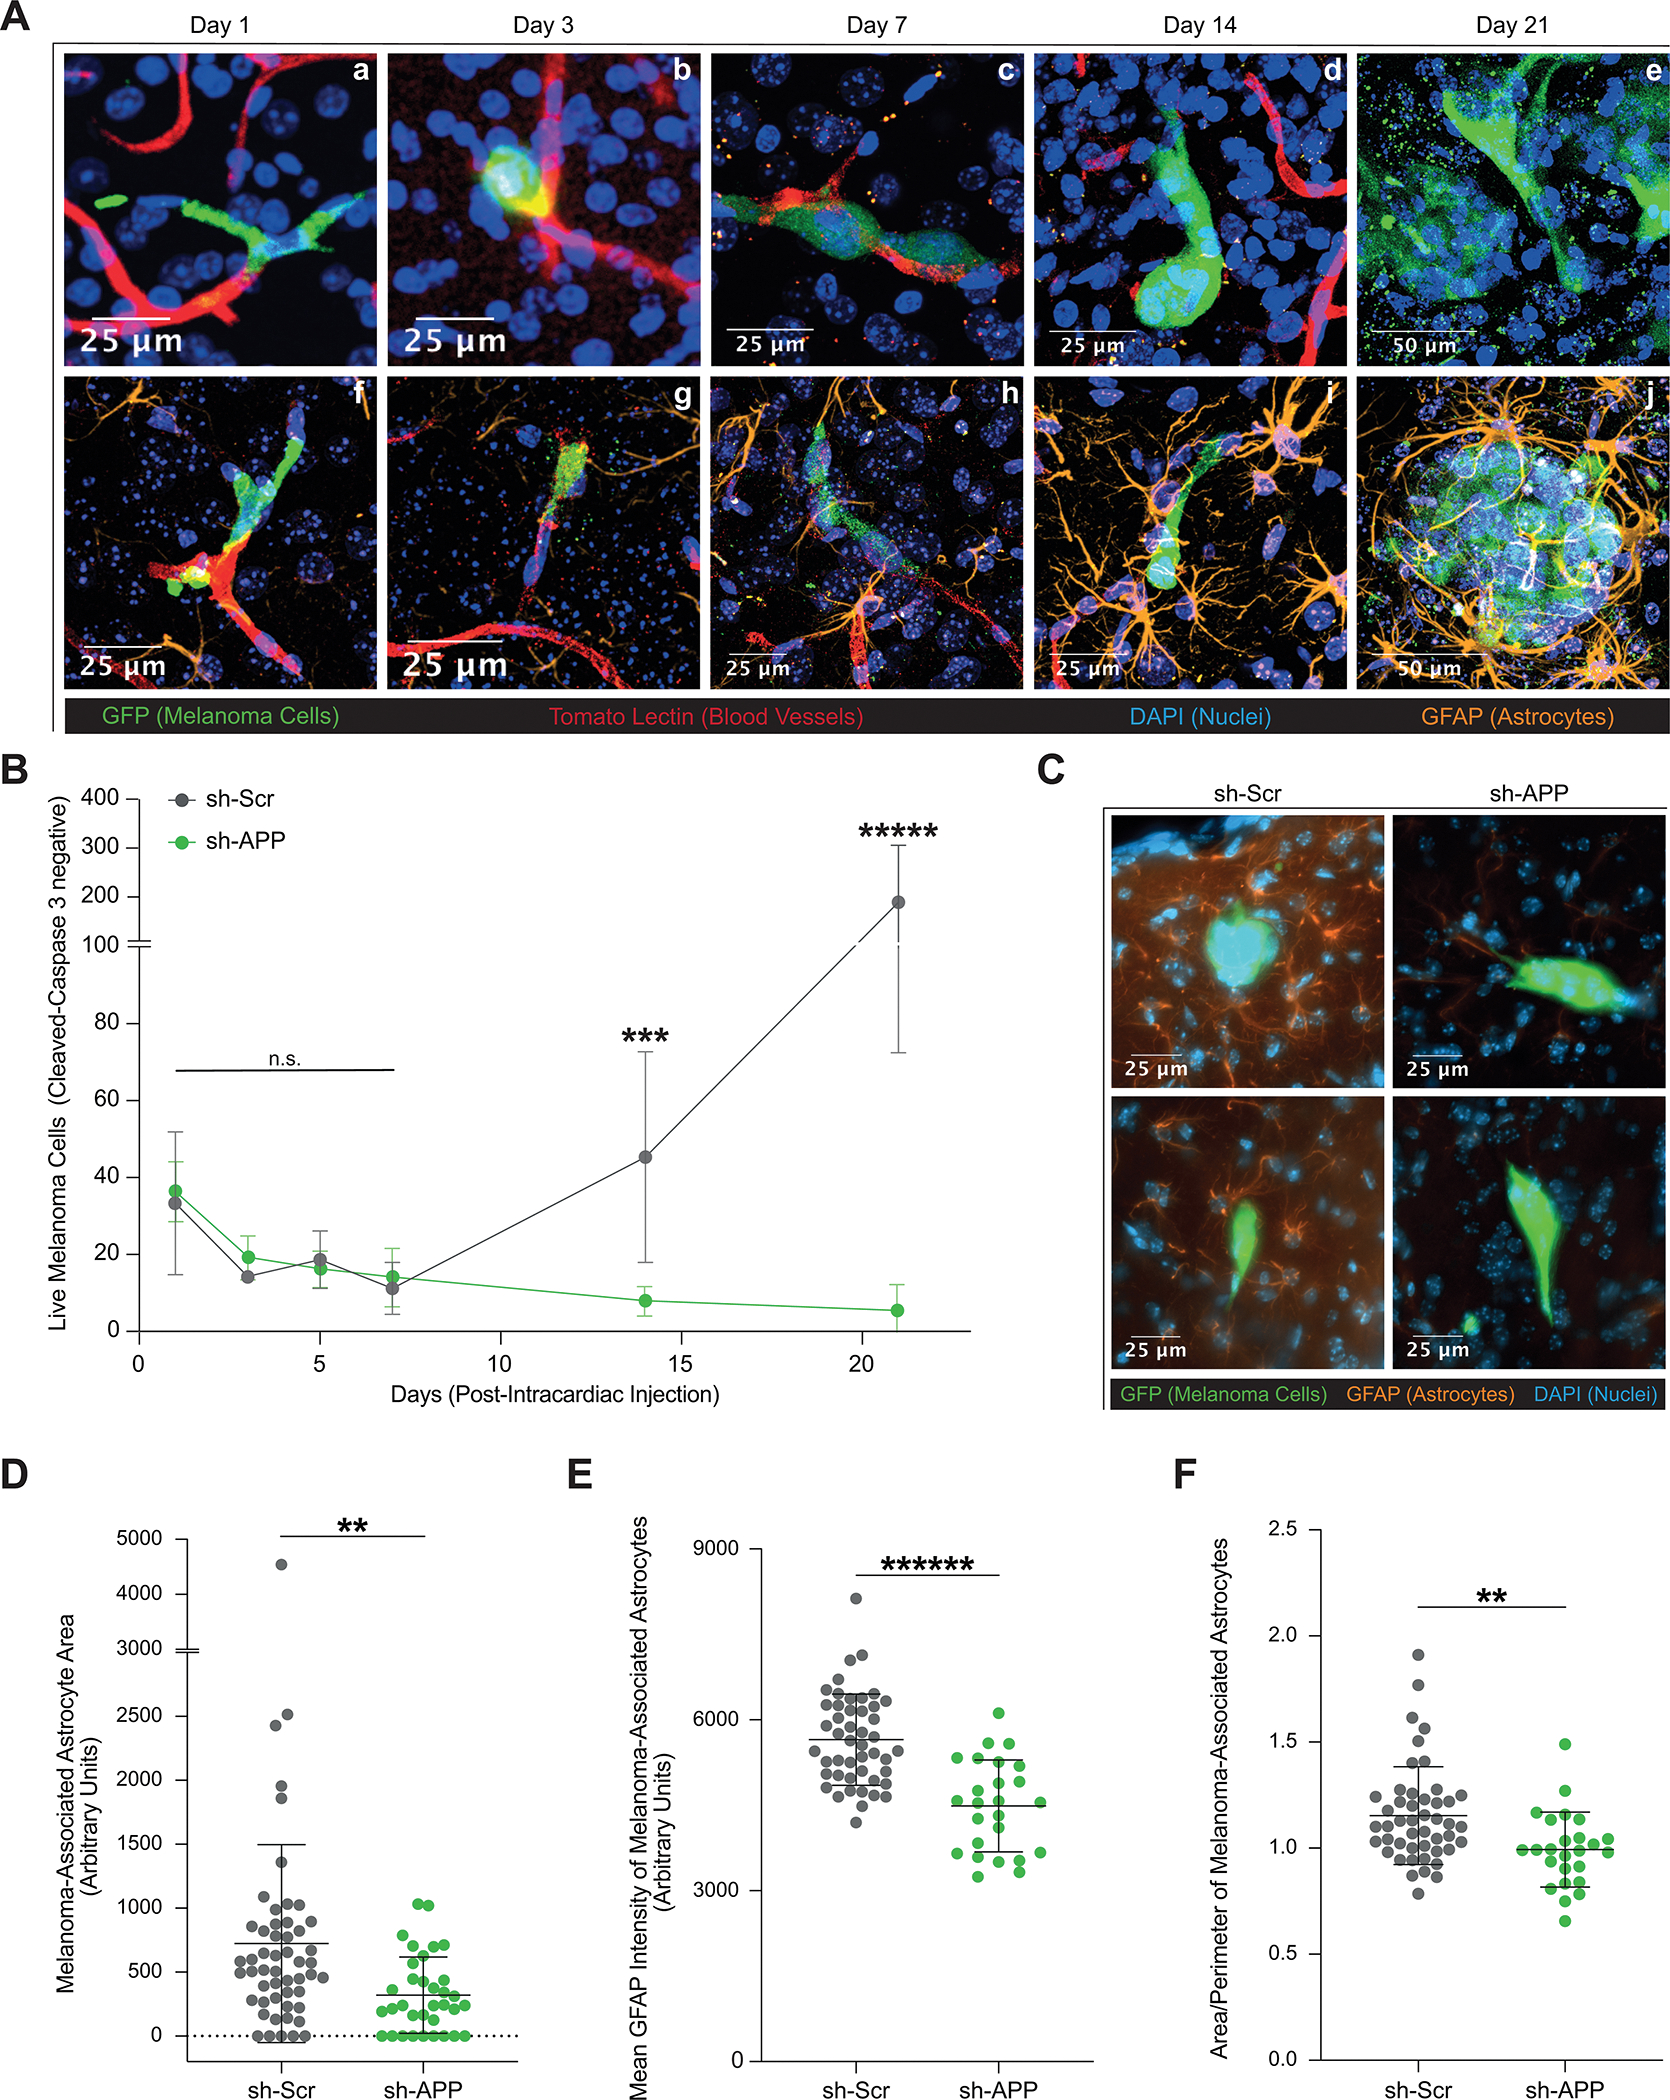
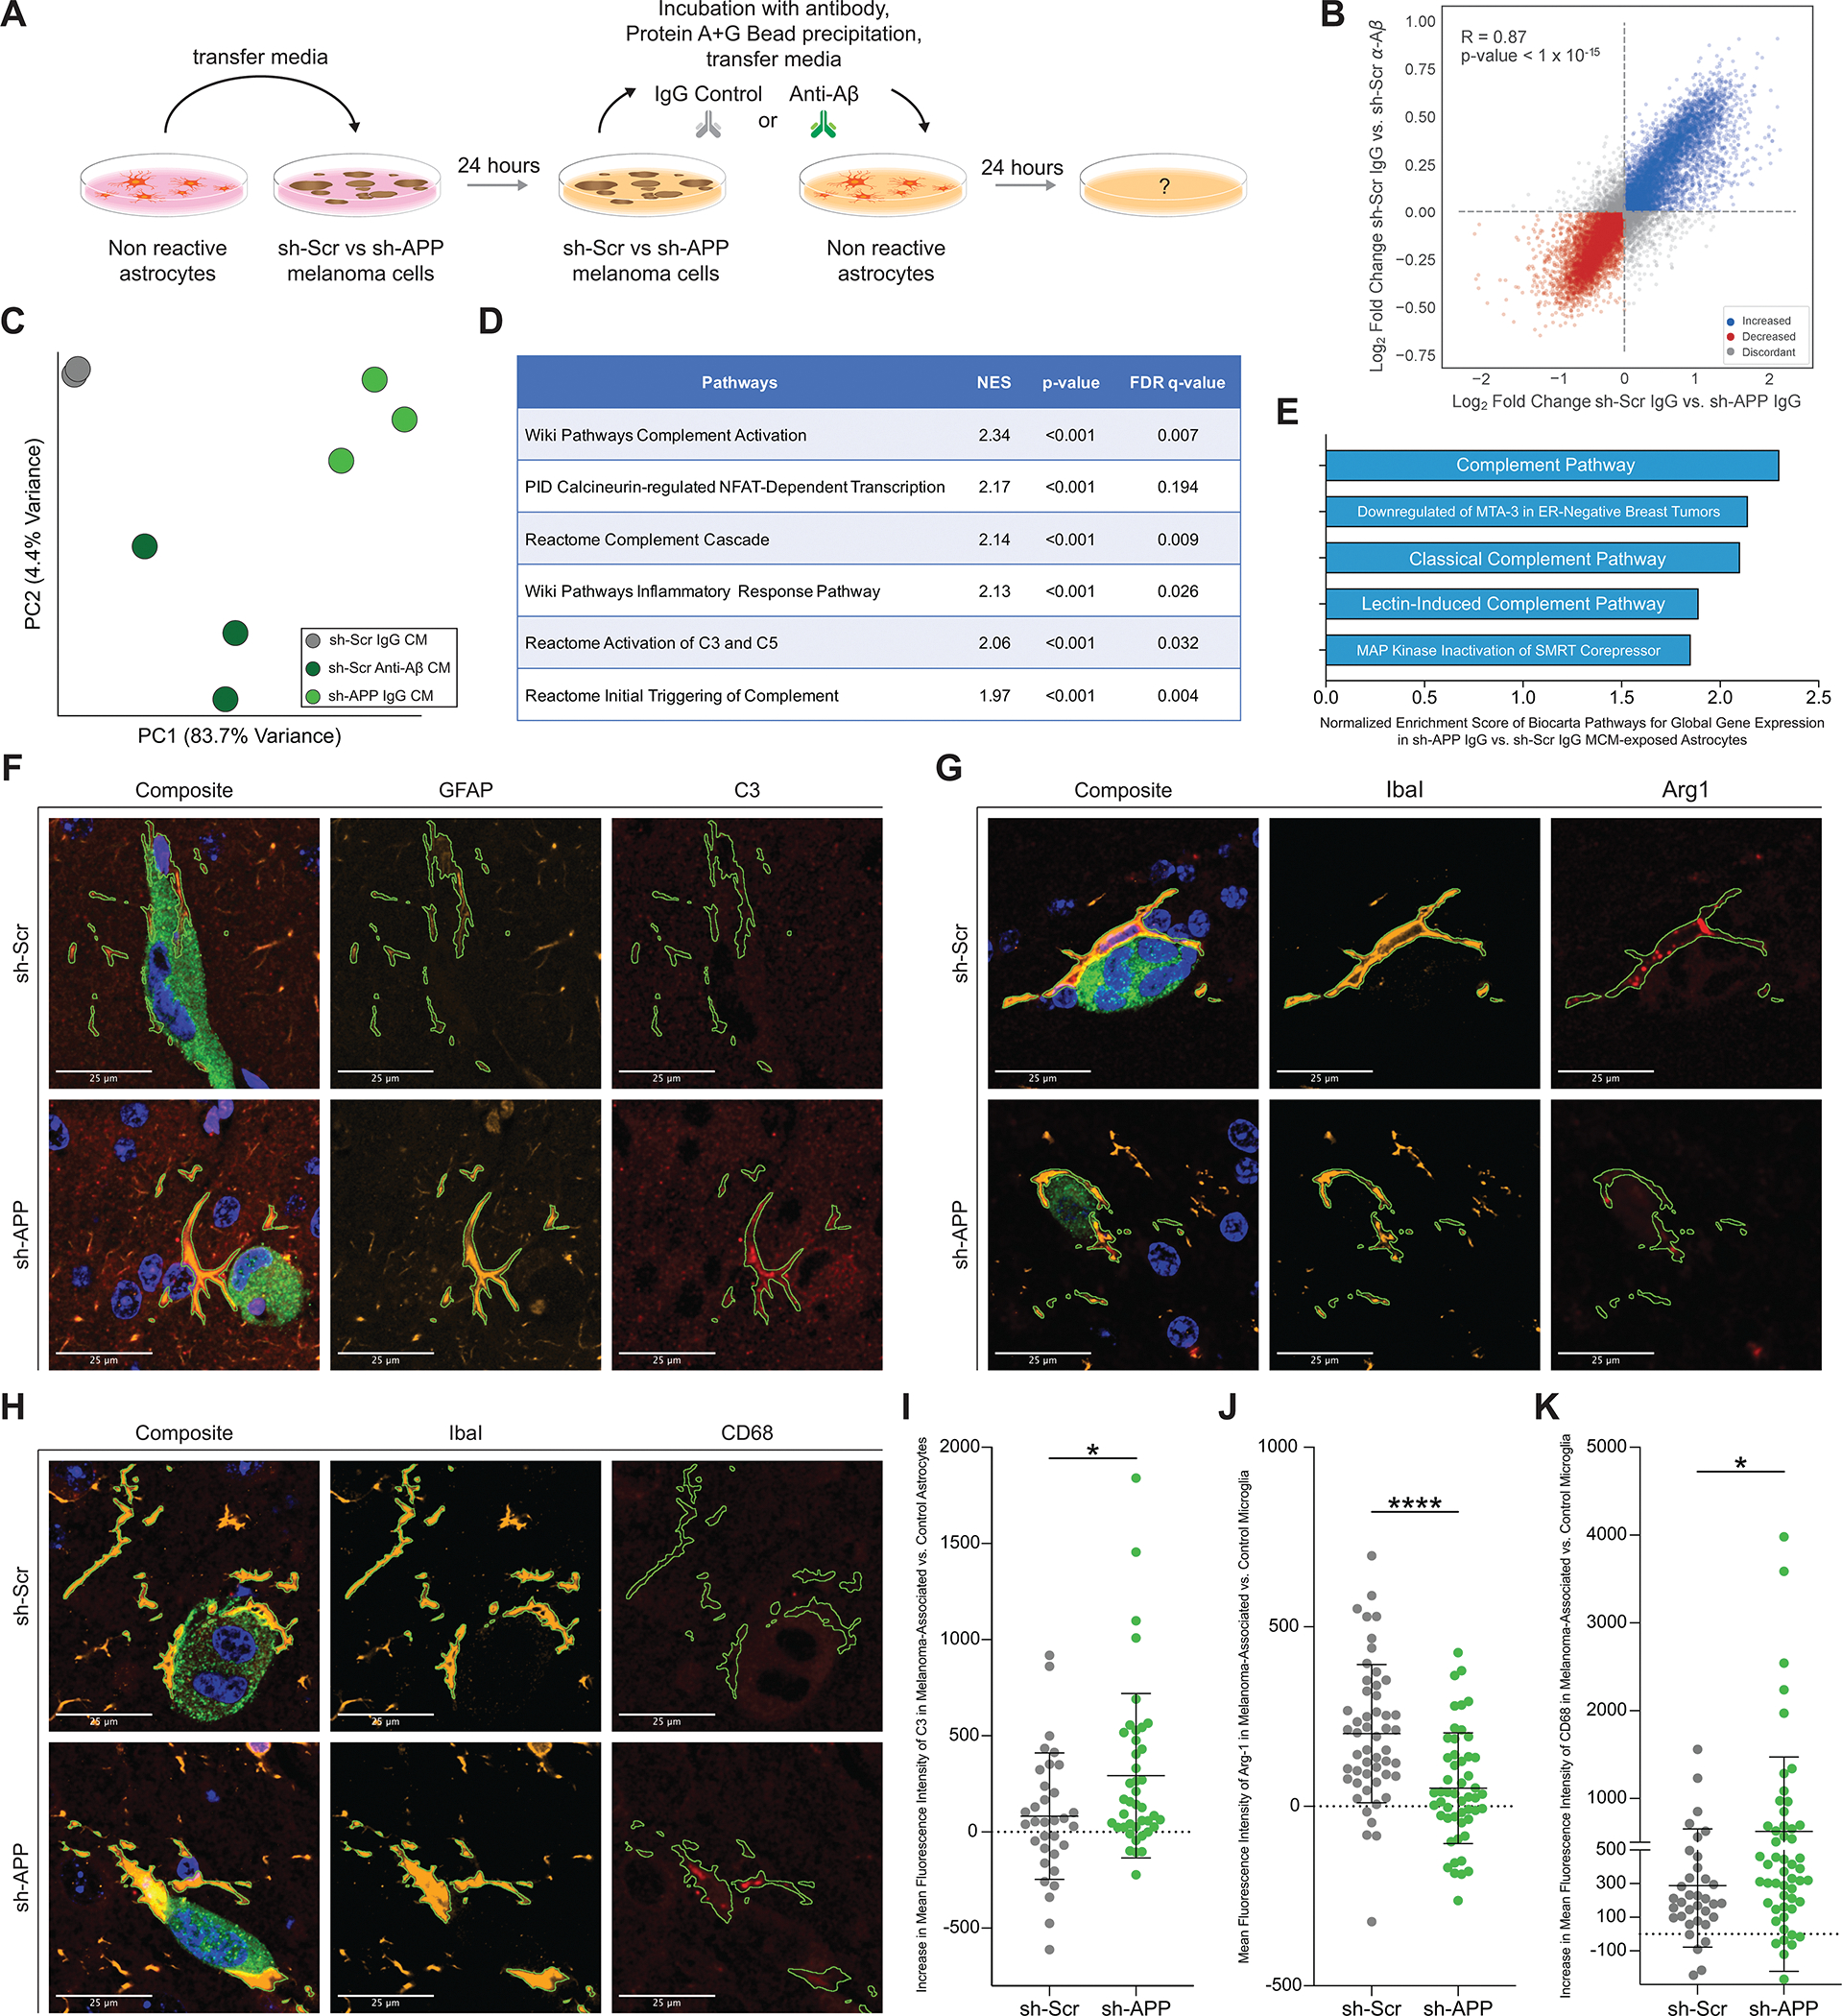
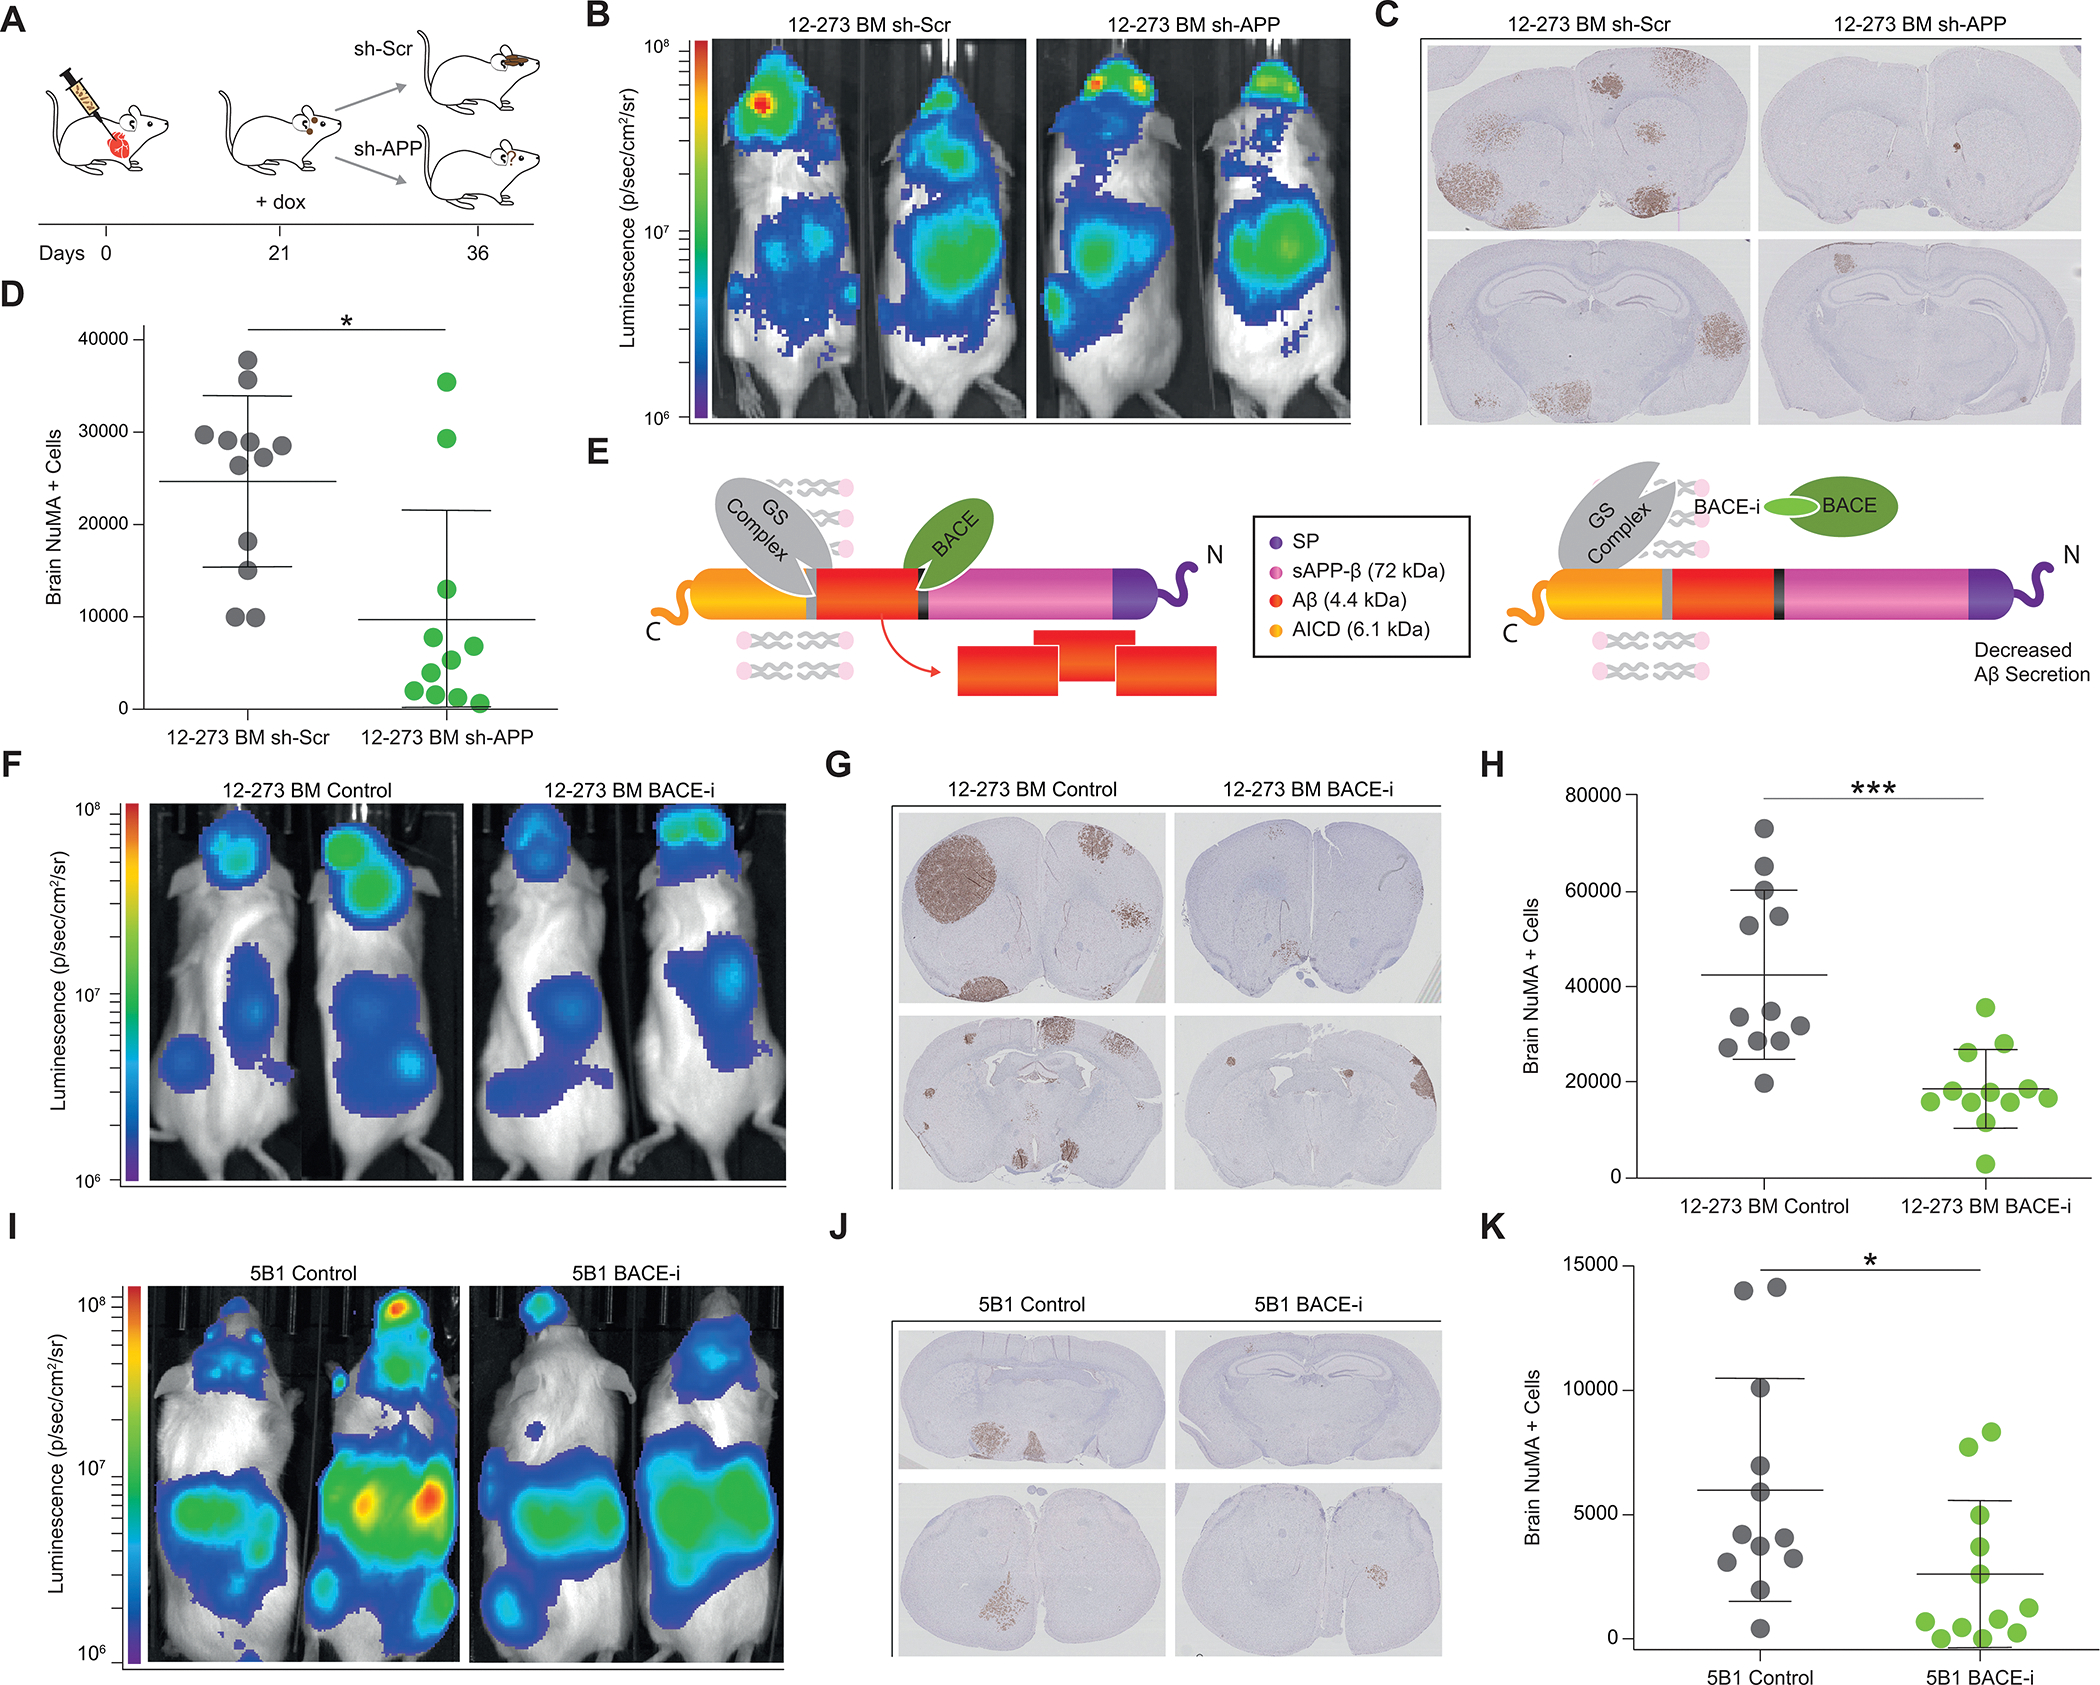
Brain metastasis is a significant cause of morbidity and mortality in multiple cancer types and represents an unmet clinical need. The mechanisms that mediate metastatic cancer growth in the brain parenchyma are largely unknown. Melanoma, which has the highest rate of brain metastasis among common cancer types, is an ideal model to study how cancer cells adapt to the brain parenchyma. Our unbiased proteomics analysis of melanoma short-term cultures revealed that proteins implicated in neurodegenerative pathologies are differentially expressed in melanoma cells explanted from brain metastases compared with those derived from extracranial metastases. We showed that melanoma cells require amyloid beta (Aβ) for growth and survival in the brain parenchyma. Melanoma-secreted Aβ activates surrounding astrocytes to a prometastatic, anti-inflammatory phenotype and prevents phagocytosis of melanoma by microglia. Finally, we demonstrate that pharmacologic inhibition of Aβ decreases brain metastatic burden.

Significance: Our results reveal a novel mechanistic connection between brain metastasis and Alzheimer's disease, two previously unrelated pathologies; establish Aβ as a promising therapeutic target for brain metastasis; and demonstrate suppression of neuroinflammation as a critical feature of metastatic adaptation to the brain parenchyma. This article is highlighted in the In This Issue feature, p. 1171.


Conflict of interest statement

Conflicts of Interest: R.D. is a full-time employee at Eli Lilly. All other authors have no financial interests. E.H., R.J.S. and K.K. are inventors on a pending International Patent Application No. PCT/US2019/033377 filed on May 21, 2019. SAL is a Founder of AstronauTx Ltd, a company making therapies to target astrocytes in neurodegenerative disease.

Figures

Figure 1.
Figure 1.
Proteomics Links Melanoma Brain Metastasis and Neurodegeneration. A, Diagram of the generation of patient-matched STC pairs. B-D, Intracardiac injection of 12–273 paired STCs in mice (10 NSG mice per group, representative experiment shown). B, Representative IVIS images of 12–273 STC pair at 29 days post intracardiac injection. C, Quantified brain/body luminescence ratio on day 29. 12–273 NBM vs. BM (* p<0.05). D, Number of brain metastases quantified by microscopy of serial FFPE sections with H&E staining. 12–273 NBM vs. BM (***, p<0.0005). E-G, Mass spectrometry analysis of whole cell lysates from a cohort of 12 BM and 12 NBM STCs, including 3 patient-matched pairs. E, Top enriched pathways (p<0.001) in BM vs NBM STCs identified by KEGG Pathway analysis of global protein levels. F, Volcano plot of mean Log2 BM/NBM fold change of global protein levels and -Log10 p-values. Orange – candidates selected for in-vivo mini-screen. G, Comparison of mean paired STC BM/NBM Log2 fold change to unpaired STC BM/NBM mean Log2 fold change. Pink – candidates selected for in-vivo mini-screen. H, Representative electron microscopy images of paired STCs. Yellow circles outline mitochondria. I, Quantification of average mitochondrial length in paired STCs. 10–230 NBM vs. BM (**** p<.00005), 12–273 NBM vs. BM (** p<.005). J, Seahorse MitoStress analysis of oxygen consumption rate in 12–273 NBM vs. BM. Basal oxygen consumption rate. 12–273 NBM vs BM (**** p<.00005).
Figure 2.
Figure 2.
Production of Aβ by Melanoma Cells is Associated with Brain Metastasis. A,B, Heatmap comparing unpaired Log 2 BM/NBM protein levels from proteomics dataset (Figure 1E–G) to Log 2 BM/NBM gene expression from previously published Fischer et al (20)(A) (EGA Accession #EGAS00001003672) and Chen et al (19) (B) (GEO Accession # GSE50496), respectively. * = p-value < 0.05 for BM vs NBM gene expression in Fischer et al (A) or Chen et al (B). C, Western blot analysis of APP (22C11) in full cohort of STCs (12 BM and 12 NBM). WM4265–2 included twice (once in each blot) for reference of signal across blots. D-E, Quantification of gamma-secretase cleavage of APP (D) and NOTCH (E) (n=4 biological replicates per group, representative experiment shown). D, APP cleavage. 10–230 NBM vs. BM (*** p<0.0005). E, NOTCH cleavage. 12–273 NBM vs BM (***** p<0.000005). F, Quantification of Aβ-40 secretion by ELISA (n=2–3 biological replicates per group). 10–230 NBM vs BM (**** p<0.00005), WM-4071 NBM vs BM (** p<0.005).
Figure 3.
Figure 3.
APP is Specifically Required for Melanoma Brain Metastasis. A, In vitro proliferation curve and western blot analysis of 12–273BM cells transduced with sh-APP vs. sh-Scr. B, Quantified Log2 Brain/Body luminescence 35 days post intracardiac injection in NSG mice of 12–273 BM with shRNA-mediated silencing of selected candidates or scrambled hairpin control (sh-Scr) (10–12 NSG mice per group). sh-Scr vs. sh-APP (*** p<0.0005), sh-Scr vs. sh-PRKAR2B (*** p<0.0005). C, Representative IVIS images at day 35. D, Quantified Log2 Brain/Body luminescence at day 35 of mice injected with 12–273 BM cells transduced with sh-Scr vs. sh-APP lentivirus (*** p<0.0005). E-F, Ex-vivo brain MRI of mice injected with 12–273 BM sh-Scr vs. sh-APP (9 mice per group). E, Representative images. Pink-purple – brain metastasis. F, Quantification of brain metastatic burden by MRI. sh-Scr vs. sh-APP (**** p<0.00005). (G-I), Staining of metastatic cells by anti-NuMA immunohistochemistry on FFPE sections of mice injected with sh-Scr vs. sh-APP (10–12 NSG mice per group). G, Representative brain images. H-I, Quantification of NuMA+ metastatic cells in mouse brains (H), sh-Scr vs. sh-APP (**** p<0.00005), and livers (I). J-L, Staining of metastatic cells by anti-NuMA immunohistochemistry on FFPE brain sections of mice injected with 12–273 BM cells with CRISPR/Cas9 mediated knockdown using a non-targeting control single guide RNA (sg-NTC) or one of two single guide RNAs targeting APP (sg-APPa, sg-APPb) (11–12 mice per group). J, Representative brain images. K-L, Quantification of NuMA+ metastatic cells in mouse brains (K), sg-NTC vs. sg-APPa (* p<0.05) and sg-NTC vs. sg-APPb (* p<0.05), and livers (L).
Figure 4.
Figure 4.
Aβ is the form of APP required for Melanoma Brain Metastasis. A, Diagram of wildtype APP and SPA4CT-T43P. B, Western blot analysis using anti-APP 22C11 and APP C1/6.1 in 12–273 BM cells transduced with the indicated constructs. C, Quantification of Aβ secretion by ELISA in 12–273 BM infected cells. sg-NTC empty vs. sg-APP empty (* p<0.05), sg-NTC empty vs. sg-APP APP-770 (* p<0.05). D-E, Intracardiac injection in mice of 12–273 BM sg-NTC or sg-APP transduced with indicated constructs (10–12 NSG mice per group). D, Representative images of FFPE brain slides with metastatic cells stained by anti-NuMA immunohistochemistry. D, Quantification of NuMA+ metastatic cells in mouse brains. sg-NTC vs. sg-APP (* p<0.05).
Figure 5.
Figure 5.
Melanoma-secreted Aβ is Required for Growth and Survival in the Brain Parenchyma. A, Representative images of brain slice immunofluorescence of 12–273 BM cells post intracardiac injection in NSG mice at days 1(Aa,Af), 3 (Ab,Ag), 7(Ac,Ah), 14 (Ad,Ai), and 21 (Ae,Aj). Fluorescent markers: green = anti-GFP (melanoma cells), red = tomato lectin (blood vessels), blue = DAPI (nuclei), orange = anti-GFAP (astrocytes). B, Quantification of live 12–273 BM cells in the brain parenchyma over time after intracardiac injection (6 mice per group per experiment, 4 50uM-thick brain slices per mouse). Day 14 sh-Scr vs. sh-APP (*** p< 0.0005), day 21 sh-Scr vs. sh-APP (***** p<0.000005). C, Representative images of brain slice immunofluorescence at day 10 post intracardiac injection. D-F, Two-dimensional quantification of parameters of astrocyte reactivity in sh-Scr vs. sh-APP melanoma-associated astrocytes (2 mice per group, 3 50uM-thick brain slices per mouse). D, Area. sh-Scr vs. sh-APP (** p<0.005). E, Mean GFAP Intensity. sh-Scr vs. sh-APP (****** p<0.0000005). F, Area/Perimeter – a proxy measurement for hypertrophy. sh-Scr vs. sh-APP (** p<0.005).
Figure 6.
Figure 6.
Melanoma-secreted Aβ suppresses inflammatory signaling in astrocytes and protects melanoma from microglial phagocytosis. A, Diagram of experimental method for exposing astrocytes to melanoma-conditioned media with and without Aβ (2–3 biological replicates per group, representative experiment shown B-E). B, Gene expression changes induced in astrocytes upon removal of Aβ from melanoma conditioned media (CM) by genetic silencing of APP in 12–273 BM melanoma cells (x axis – 12–273 BM sh-Scr IgG CM vs. sh-APP IgG CM) compared to changes induced by direct immunodepletion of Aβ from conditioned media (y axis – 12–273 BM sh-Scr IgG CM vs. sh-Scr Anti-Aβ CM). Correlation coefficient r=0.89 (p<1×10–15). C, Unsupervised principal component analysis of gene expression in astrocytes exposed to control melanoma-conditioned media. D, Selected pathways from Gene Set Enrichment Analysis found to be significantly enriched in 12–273 BM sh-APP IgG CM vs. sh-Scr IgG CM exposed astrocytes (NES=Normalized Enrichment Score, FDR=False Discovery Rate). E, Top five Biocarta pathways with the highest Normalized Enrichment Score in 12–273 BM sh-APP IgG CM vs. sh-Scr IgG CM exposed astrocytes. F-H, Representative images of brain slice immunofluorescence at day 10 post intracardiac injection (12–273 BM, 3 mice per group). Fluorescent Markers: green = anti-GFP (melanoma cells), blue = DAPI (nuclei), orange = anti-GFAP (F, astrocytes) or anti-Iba1 (G-H, microglia), red = Complement-3 (F) or Arginase-1 (G) or CD68 (H). I, 3D-quantification of mean fluorescence intensity of Complement-3 in melanoma-associated vs. control astrocytes. 12–273 BM sh-Scr vs. sh-APP (* p<0.05). J, 3D-quantification of mean fluorescence intensity of Arginase-1 in melanoma-associated vs. control microglia. 12–273 BM sh-Scr vs. sh-APP (* p<0.00005). K, 3D-quantification of mean fluorescence intensity of CD68 in melanoma-associated vs. control microglia. 12–273 BM sh-Scr vs. sh-APP (* p<0.05).
Figure 7.
Figure 7.
Aβ is a Promising Therapeutic Target for Treatment of Brain Metastasis. A, Diagram of therapeutic simulation experiment inducing silencing of APP in established brain metastases. B-D, Induction of silencing of APP in established brain metastases (11–12 NSG mice per group). B, Representative IVIS images at day 37 post intracardiac injection. C, Representative images of FFPE brain slides with labeling of metastatic cells by anti-NuMA immunohistochemistry. D, Quantification of NuMA+ metastatic cells in mouse brains. sh-Scr vs. sh-APP (* p<0.05). E, Diagram of APP cleavage and beta-secretase inhibition of Aβ production. F, Representative IVIS images at Day 28 post intracardiac injection with 12–273 BM STC (12 NSG mice per group). G, Representative images of FFPE brain slides with 12–273 BM metastatic cells stained by anti-NuMA immunohistochemistry. H, Quantification of NuMA+ metastatic cells in mouse brains. 12–273 BM Control vs BACE-i (*** p<0.0005). I, Representative IVIS images at Day 28 post intracardiac injection with 5B1 melanoma cell line (12 NSG mice per group). J, Representative images of FFPE brain slides with 5B1 metastatic cells stained by anti-NuMA immunohistochemistry. K, Quantification of NuMA+ metastatic cells in mouse brains. 5B1 Control vs BACE-i (* p<0.05).

References

    1. Barnholtz-Sloan JS, Sloan AE, Davis FG, Vigneau FD, Lai P, Sawaya RE. Incidence proportions of brain metastases in patients diagnosed (1973 to 2001) in the Metropolitan Detroit Cancer Surveillance System. J Clin Oncol 2004;22(14):2865–72 doi 10.1200/JCO.2004.12.149. - DOI - PubMed
    1. Patel JK, Didolkar MS, Pickren JW, Moore RH. Metastatic pattern of malignant melanoma. A study of 216 autopsy cases. Am J Surg 1978;135(6):807–10 doi 10.1016/0002-9610(78)90171-x. - DOI - PubMed
    1. de la Monte SM, Moore GW, Hutchins GM. Patterned distribution of metastases from malignant melanoma in humans. Cancer Res 1983;43(7):3427–33. - PubMed
    1. Davies MA, Saiag P, Robert C, Grob JJ, Flaherty KT, Arance A, et al. Dabrafenib plus trametinib in patients with BRAF(V600)-mutant melanoma brain metastases (COMBI-MB): a multicentre, multicohort, open-label, phase 2 trial. Lancet Oncol 2017;18(7):863–73 doi 10.1016/S1470-2045(17)30429-1. - DOI - PMC - PubMed
    1. Tawbi HA, Forsyth PA, Algazi A, Hamid O, Hodi FS, Moschos SJ, et al. Combined Nivolumab and Ipilimumab in Melanoma Metastatic to the Brain. N Engl J Med 2018;379(8):722–30 doi 10.1056/NEJMoa1805453. - DOI - PMC - PubMed

Publication types

Substances