. 2022 Jul;70(7):1267-1288.
doi: 10.1002/glia.24167. Epub 2022 Mar 9.

Microglia integration into human midbrain organoids leads to increased neuronal maturation and functionality

Affiliations

Microglia integration into human midbrain organoids leads to increased neuronal maturation and functionality

Sonia Sabate-Soler et al. Glia. 2022 Jul.

Abstract

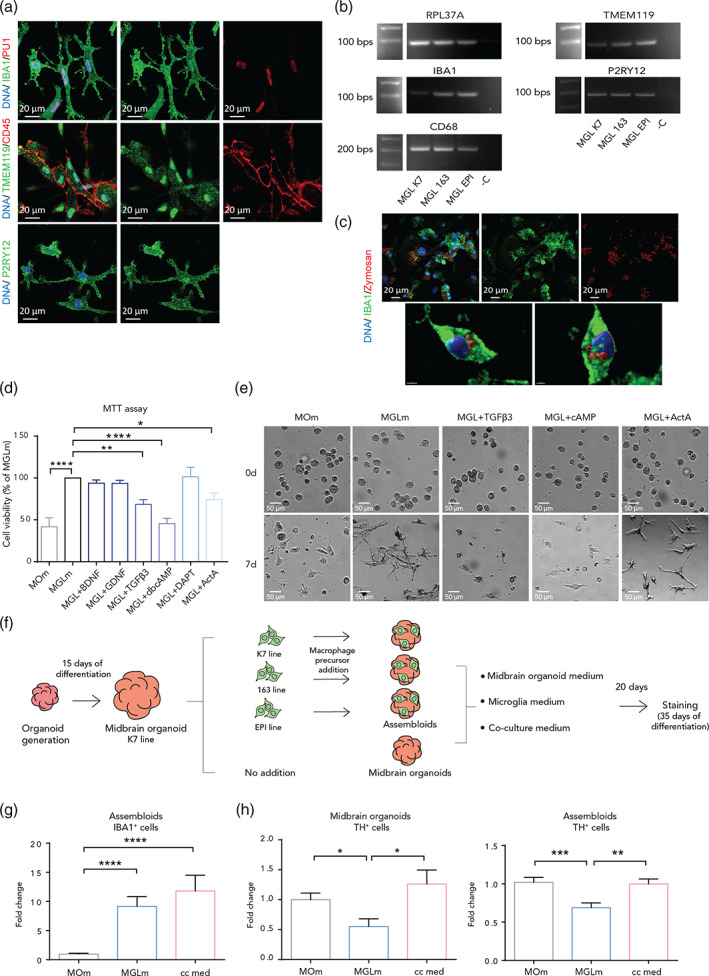
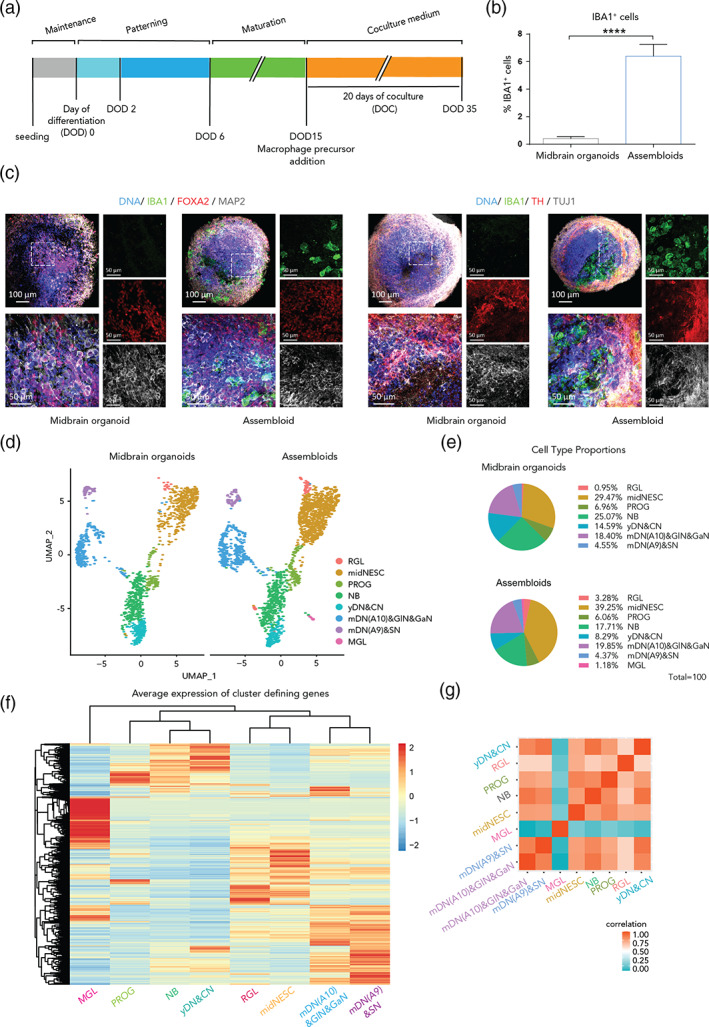
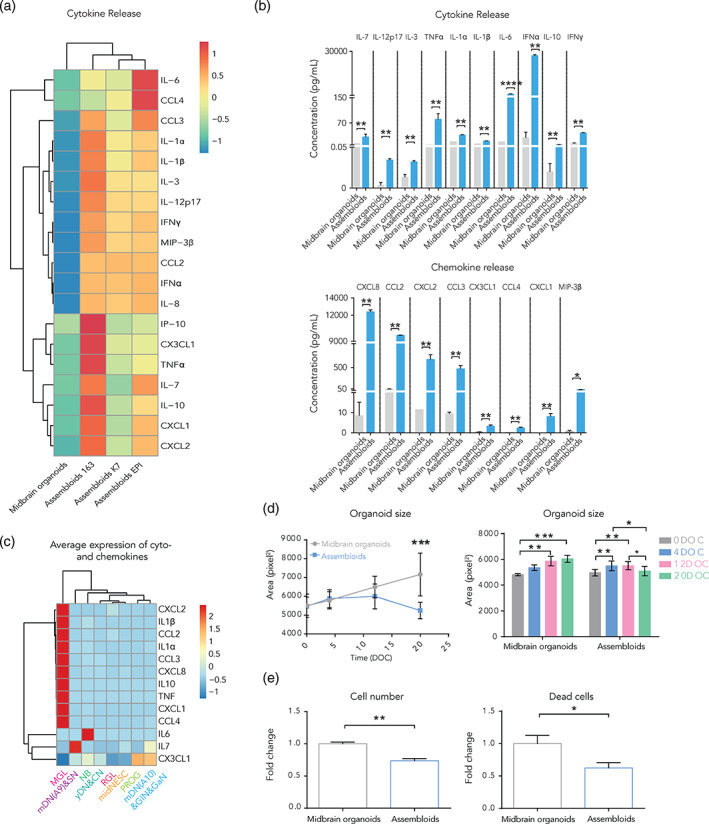
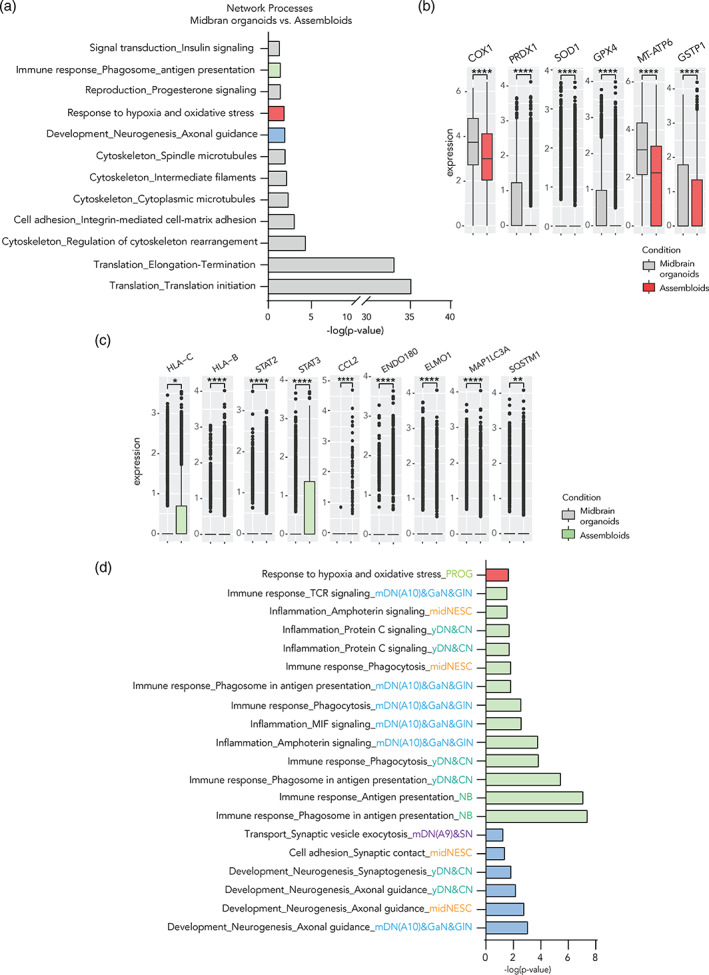
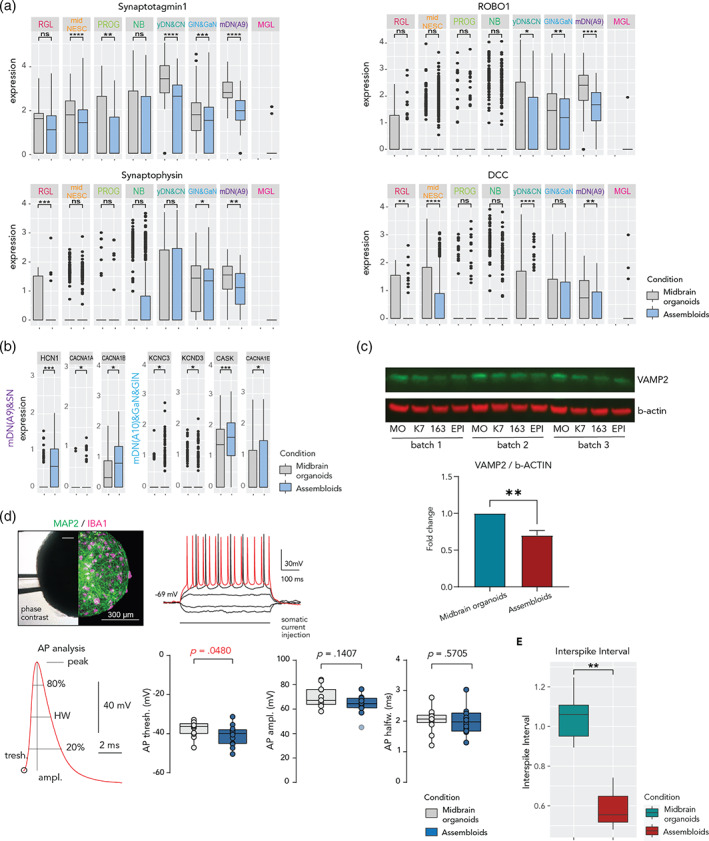
The human brain is a complex, three-dimensional structure. To better recapitulate brain complexity, recent efforts have focused on the development of human-specific midbrain organoids. Human iPSC-derived midbrain organoids consist of differentiated and functional neurons, which contain active synapses, as well as astrocytes and oligodendrocytes. However, the absence of microglia, with their ability to remodel neuronal networks and phagocytose apoptotic cells and debris, represents a major disadvantage for the current midbrain organoid systems. Additionally, neuroinflammation-related disease modeling is not possible in the absence of microglia. So far, no studies about the effects of human iPSC-derived microglia on midbrain organoid neural cells have been published. Here we describe an approach to derive microglia from human iPSCs and integrate them into iPSC-derived midbrain organoids. Using single nuclear RNA Sequencing, we provide a detailed characterization of microglia in midbrain organoids as well as the influence of their presence on the other cells of the organoids. Furthermore, we describe the effects that microglia have on cell death and oxidative stress-related gene expression. Finally, we show that microglia in midbrain organoids affect synaptic remodeling and increase neuronal excitability. Altogether, we show a more suitable system to further investigate brain development, as well as neurodegenerative diseases and neuroinflammation.

Keywords: 3D models; brain organoids; iPSC; inflammation; microglia.


Conflict of interest statement

Jens C. Schwamborn and Javier Jarazo are co‐founders and shareholders of the biotech company Organo Therapeutics SARL. This company uses midbrain organoids and assembloids for in vitro disease modeling and drug discovery.

Figures

FIGURE 1
FIGURE 1
iPSC‐derived microglia express specific markers, have phagocytosis ability and are compatible with the engineered coculture medium. (a) Immunofluorescence staining of microglia from line 163 for IBA1, PU.1 (upper panels), TMEM119 and CD45 (middle panels) and P2RY12 (bottom panels). (b) IBA1, CD68, TMEM119, and P2RY12 gene expression in microglia from the three used lines. The ribosomal protein RPL37A coding gene was used as a housekeeping gene due to its stable expression. (c) Immunofluorescence staining of microglia from the EPI line for IBA1 and Zymosan (upper panels. For lines K7 and 163 see Figure S1B). 3D reconstruction of a microglia cell from the line K7 with Zymosan particles in its cytoplasm (bottom panels, scale bar left = 4 μm, scale bar right = 3 μm). (d) Cell viability of 2D microglia from lines 163 and EPI (MTT assay) after 10 days of treatment with midbrain organoid media (MOm) or microglia medium (MGLm) without further supplementation or supplemented with neurotrophic factors. (n = 3, 3 batches). (e) Representative bright field images of the microglia morphology (line 163) at day 0 and 7 of culture with MOm, MGLm, MGLm supplemented with TGFβ3 (MGL + TGFβ3), with cAMP (MGL + cAMP), or with Activin a (MGL + ActA). (f) Schematic diagram of the steps for the media optimization in assembloids and midbrain organoids. (g) IBA1 positive (IBA1+) population in assembloids upon culture with MOm, MGLm or coculture medium (cc med). Y‐axis represents the fold change with respect to the control (MOm). (h) TH positive (TH+) neuron population in midbrain organoids (left) and assembloids (right). Y‐axis represents the fold change with respect to the control (MOm) (n [midbrain organoids] = 2, 2 batches, n [assembloids] = 5, 2 batches and three cell lines). Data are represented as mean ± SEM. *p <.05, **p <.01, ***p <.001, ****p <.0001 using a two‐way ANOVA with Dunnett's multiple comparisons test. Abbreviations: BDNF, brain‐derived neurotrophic factor; GDNF, glial cell‐derived neurotrophic factor; TGFβ3, transforming growth factor beta‐3, cAMP, cyclic adenosine monophosphate; ActA, activin A
FIGURE 2
FIGURE 2
The coculture medium allows a successful microglia integration and seven other neural cell populations in assembloids. (a) Timeline of the coculture of midbrain organoids with macrophage precursors. DOD = day of differentiation, DOC = day of coculture. (b) IBA1 positive (IBA1+) cell percentage in midbrain organoids and assembloids. Assembloids present around 6.4% of IBA1+ cells (n [midbrain organoids] = 5, 5 batches, n [assembloids] = 15, 5 batches, 3 cell lines). Data are represented as mean ± SEM. (c). Immunofluorescence staining of midbrain organoids and assembloids with microglia from the line K7 for IBA1, FOXA2 and MAP2 (left panels), and for TH and TUJ1 (right panels). For lines 163 and EPI see Figure S1H. (d). UMAP visualization of scRNA‐seq data—split by microglial presence—shows eight different defined cell clusters in assembloids. RGL, radial glia; midNESC, midbrain specific neural epithelial stem cells; PROG, neuronal progenitors; NB, neuroblasts; yDN&CN, young dopaminergic and cholinergic neurons; mDN(A10)&gaN&GlN, mature A10 specific dopaminergic neurons, gabaergic and glutamatergic neurons; mDN(A9)&SN, mature A9 specific dopaminergic neurons and serotonergic neurons, MGL, microglia. (e) Proportions of different cell types in midbrain organoids and assembloids. (f) Average expression of cluster defining genes in assembloids. (g). Spearman's correlation between different cell types in assembloids. *p <.05, **p <.01, ***p <.001, ****p <.0001 using a Kruskal‐Wallis one‐way ANOVA with Dunn's multiple comparisons test (for MGLm and cc med vs. MOm), and a Mann–Whitney test (for MGLm vs. cc med) in (a) and (b), and a Mann–Whitney test in (e)
FIGURE 3
FIGURE 3
Microglia in assembloids have phagocytic capacities and release cytokines and chemokines. (a) Heatmap representing the measured levels of cytokines and chemokines in cell culture media (pg/ml) shows two different clusters corresponding to midbrain organoids and assembloids (n = 9, 3 batches, 3 lines). (b) Cytokine (upper graph) and chemokine (bottom graph) levels in midbrain organoids and assembloids (n = 9, 3 batches, 3 lines). (c) Average expression of cytokine and chemokine genes across cell types. (d) Organoid surface area in midbrain organoids and assembloids over time (left graph, n = 3, 3 batches). Comparison of the organoid size, measuring the same organoids and assembloids, in four time points during culture (right graph, n = 3, 3 batches). (e) Cell number (total nuclei count, left panel) and dead cells (pyknotic nuclei, right panel) in midbrain organoids and assembloids after 20 days of culture (n [midbrain organoids] = 5, 5 batches, n [assembloids] =15, 5 batches, 3 lines). Data are represented as mean ± SEM. *p <.05, **p <.01, ***p <.001, ****p <.0001 using a Mann–Whitney test in (a) and (b), a multiple t test with the Holm‐Sidak method for (d) (left panel), a two‐way ANOVA with Tukey's multiple comparisons test for (d) (right panel) and a Mann–Whitney test in (e)
FIGURE 4
FIGURE 4
Microglia affect the expression of oxidative stress and immune response‐related genes in assembloids. (a) Differentially expressed gene enrichment analysis in assembloids against midbrain organoids reveals 12 significant network process pathways (FDR <0.05). (b) Expression of genes related to response to oxidative stress in assembloids compared with midbrain organoids. (c) Gene expression of genes related to immune response of assembloids. The presence of microglia increases the expression of genes related to antigen presentation and immune response, and decreases the expression of those related to autophagy in non‐microglia cells. Box plots show mean expression and SD. (d) Enrichment analysis of cluster specific DEG p <.05 between assembloids and midbrain organoids reveals significant FDR <0.05 network processes involved in oxidative stress, immune response as well as synaptic regulation. Dots represent single cells. Data are represented as mean ± SD. *p <.05, **p <.01, ***p <.001, ****p <.0001 using a Wilcox test
FIGURE 5
FIGURE 5
Microglia affect the expression of genes related to synaptic remodeling in assembloids and develop mature electrophysiological characteristics. (a) Gene expression of general synaptic markers such as Synaptotagmin (SYT1) and Synaptophysin (SYP), and the dopaminergic neuron circuit formation genes ROBO1 and DCC across cell clusters in midbrain organoids and assembloids. Data are represented as mean ± SD. *p <.05 using a Wilcox test. Dots represent single cells. (b) Expression of genes involved in action potential (CASK, CACNA1A, CACNA1E, CACNA1B) and active zones (HCN1, KCNC3, KCND3) within synapses in the dopaminergic neuron cluster (mDN(A9)&SN) in midbrain organoids and assembloids. Data are represented as mean ± SD. *p <.05 using a Wilcox test. Dots represent single cells. (c) Western blot showing protein levels of the synaptic vesicle marker VAMP2 and the housekeeping protein β‐actin (upper panels). Bar graph showing the Western blot quantification from the upper panels (n [midbrain organoids] = 3, 3 batches, n [assembloids] = 9, 3 batches, 3 cell lines). **p <.01 using a Mann–Whitney test. Data are represented as mean ± SEM. (d) Fixation of organoid during recording and post hoc verification of microglia presence. The left half shows an infrared phase‐contrast life image with the fixation pipette (upper left panel). The right half shows the same organoid after immunofluorescence staining for MAP2 and IBA1. Example traces show voltage response to hyperpolarizing and depolarizing current injections of a neuron inside an assembloid measured by whole‐cell patch‐clamp. Voltage responses that exhibited action potential (AP) following 50 ms after stimulus onset were used for AP analysis (upper right panel). Analysis of AP waveform characteristics (bottom left panel). Voltage thresholds were significantly more depolarized in assembloid neurons (bottom middle‐left panel, n = 14 neurons in midbrain organoids and n = 13 cells in assembloids), although analysis of AP amplitude (bottom middle‐right panel) and half width (bottom right panel) shows no systematic differences between both groups. Box plots indicate median, 25th, and 75th percentiles and raw data points. Outliers deviating 2.5 SD are marked translucent and were excluded from statistical analysis for normally distributed data. p‐values were determined using unpaired t tests or Mann–Whitney rank test (indicated as p). (e) Multi‐electrode array results showed a lower inter‐spike interval in assembloids compared with midbrain organoids (n [midbrain organoids] = 3, 3 batches, n [assembloids] = 9, 3 batches, 3 cell lines). ***p = .001, **p = .01, *p = .05 using a Wilcox test. Boxes cover data from the first to the third quartile. The whiskers go from each quartile to the minimum or maximum

References

    1. Abud, E. M. , Ramirez, R. N. , Martinez, E. S. , Healy, L. M. , Nguyen, C. H. H. , Newman, S. A. , Yeromin, A. V. , Scarfone, V. M. , Marsh, S. E. , Fimbres, C. , Caraway, C. A. , Fote, G. M. , Madany, A. M. , Agrawal, A. , Kayed, R. , Gylys, K. H. , Cahalan, M. D. , Cummings, B. J. , Antel, J. P. , … Blurton‐Jones, M. (2017). iPSC‐derived human microglia‐like cells to study neurological diseases. Neuron, 94(2), 278–293.e9. 10.1016/j.neuron.2017.03.042 - DOI - PMC - PubMed
    1. Alliot, F. , Godin, I. , & Pessac, B. (1999). Microglia derive from progenitors, originating from the yolk sac, and which proliferate in the brain. Developmental Brain Research, 117(2), 145–152. 10.1016/S0165-3806(99)00113-3 - DOI - PubMed
    1. Arnò, B. , Grassivaro, F. , Rossi, C. , Bergamaschi, A. , Castiglioni, V. , Furlan, R. , Greter, M. , Favaro, R. , Comi, G. , Becher, B. , Martino, G. , & Muzio, L. (2014). Neural progenitor cells orchestrate microglia migration and positioning into the developing cortex. Nature Communications, 5, 5611. 10.1038/ncomms6611 - DOI - PubMed
    1. Becht, E. , McInnes, L. , Healy, J. , Dutertre, C. A. , Kwok, I. W. H. , Ng, L. G. , Ginhoux, F. , & Newell, E. W. (2019). Dimensionality reduction for visualizing single‐cell data using UMAP. Nature Biotechnology, 37(1), 38–44. 10.1038/nbt.4314 - DOI - PubMed
    1. Berger, E. , Magliaro, C. , Paczia, N. , Monzel, A. S. , Antony, P. , Linster, C. L. , Bolognin, S. , Ahluwalia, A. , & Schwamborn, J. C. (2018). Millifluidic culture improves human midbrain organoid vitality and differentiation. Lab on a Chip, 18(20), 3172–3183. 10.1039/c8lc00206a - DOI - PubMed

Publication types