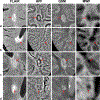
Quantitative susceptibility mapping versus phase imaging to identify multiple sclerosis iron rim lesions with demyelination
- PMID: 35262241
- PMCID: PMC9308704
- DOI: 10.1111/jon.12987
Quantitative susceptibility mapping versus phase imaging to identify multiple sclerosis iron rim lesions with demyelination
Abstract
Background and purpose: To compare quantitative susceptibility mapping (QSM) and high-pass-filtered (HPF) phase imaging for (1) identifying chronic active rim lesions with more myelin damage and (2) distinguishing patients with increased clinical disability in multiple sclerosis.
Methods: Eighty patients were scanned with QSM for paramagnetic rim detection and Fast Acquisition with Spiral Trajectory and T2prep for myelin water fraction (MWF). Chronic lesions were classified based on the presence/absence of rim on HPF and QSM images. A lesion-level linear mixed-effects model with MWF as the outcome was used to compare myelin damage among the lesion groups. A multiple patient-level linear regression model was fit to establish the association between Expanded Disease Status Scale (EDSS) and the log of the number of rim lesions.
Results: Of 2062 lesions, 188 (9.1%) were HPF rim+/QSM rim+, 203 (9.8%) were HPF rim+/QSM rim-, and the remainder had no rim. In the linear mixed-effects model, HPF rim+/QSM rim+ lesions had significantly lower MWF than both HPF rim+/QSM rim- (p < .001) and HPF rim-/QSM rim- (p < .001) lesions, while the MWF difference between HPF rim+/QSM rim- and HPF rim-/QSM rim- lesions was not statistically significant (p = .130). Holding all other factors constant, the log number of QSM rim+ lesion was associated with EDSS increase (p = .044). The association between the log number of HPF rim+ lesions and EDSS was not statistically significant (p = .206).
Conclusions: QSM identifies paramagnetic rim lesions that on average have more myelin damage and stronger association with clinical disability than those detected by phase imaging.
Keywords: chronic active lesions; high-pass-filtered phase imaging; multiple sclerosis; myelin water fraction (MWF); paramagnetic rim; quantitative susceptibility mapping (QSM).
© 2022 American Society of Neuroimaging.
Figures


Similar articles
-
Combining Quantitative Susceptibility Mapping with Automatic Zero Reference (QSM0) and Myelin Water Fraction Imaging to Quantify Iron-Related Myelin Damage in Chronic Active MS Lesions.AJNR Am J Neuroradiol. 2018 Feb;39(2):303-310. doi: 10.3174/ajnr.A5482. Epub 2017 Dec 14. AJNR Am J Neuroradiol. 2018. PMID: 29242359 Free PMC article.
-
Disease correlates of rim lesions on quantitative susceptibility mapping in multiple sclerosis.Sci Rep. 2022 Mar 15;12(1):4411. doi: 10.1038/s41598-022-08477-6. Sci Rep. 2022. PMID: 35292734 Free PMC article.
-
Impact of Lesion Location on Longitudinal Myelin Water Fraction Change in Chronic Multiple Sclerosis Lesions.J Neuroimaging. 2020 Jul;30(4):537-543. doi: 10.1111/jon.12716. Epub 2020 Jun 24. J Neuroimaging. 2020. PMID: 32579281 Free PMC article.
-
Central Vein Sign and Paramagnetic Rim Lesions: Susceptibility Changes in Brain Tissues and Their Implications for the Study of Multiple Sclerosis Pathology.Diagnostics (Basel). 2024 Jun 27;14(13):1362. doi: 10.3390/diagnostics14131362. Diagnostics (Basel). 2024. PMID: 39001252 Free PMC article. Review.
-
MR myelin imaging in multiple sclerosis: A scoping review.J Neurol Sci. 2023 Dec 15;455:122807. doi: 10.1016/j.jns.2023.122807. Epub 2023 Nov 26. J Neurol Sci. 2023. PMID: 38035651
Cited by
-
Chronic active lesions in multiple sclerosis: classification, terminology, and clinical significance.Ther Adv Neurol Disord. 2024 Dec 19;17:17562864241306684. doi: 10.1177/17562864241306684. eCollection 2024. Ther Adv Neurol Disord. 2024. PMID: 39711984 Free PMC article. Review.
-
Recommended implementation of quantitative susceptibility mapping for clinical research in the brain: A consensus of the ISMRM electro-magnetic tissue properties study group.Magn Reson Med. 2024 May;91(5):1834-1862. doi: 10.1002/mrm.30006. Epub 2024 Jan 21. Magn Reson Med. 2024. PMID: 38247051 Free PMC article.
-
Associations between chronic active lesions and clinical outcomes in multiple sclerosis: A systematic literature review.J Manag Care Spec Pharm. 2025 Jul;31(7):694-721. doi: 10.18553/jmcp.2025.24294. Epub 2025 May 13. J Manag Care Spec Pharm. 2025. PMID: 40357663 Free PMC article.
-
Lesion-level correspondence and longitudinal properties of paramagnetic rim and slowly expanding lesions in multiple sclerosis.Mult Scler. 2023 May;29(6):680-690. doi: 10.1177/13524585231162262. Epub 2023 Apr 10. Mult Scler. 2023. PMID: 37036134 Free PMC article.
-
Current and future role of MRI in the diagnosis and prognosis of multiple sclerosis.Lancet Reg Health Eur. 2024 Aug 22;44:100978. doi: 10.1016/j.lanepe.2024.100978. eCollection 2024 Sep. Lancet Reg Health Eur. 2024. PMID: 39444702 Free PMC article. Review.
References
-
- Lassmann H The pathologic substrate of magnetic resonance alterations in multiple sclerosis. Neuroimaging Clin N Am 2008;18:563–76. - PubMed
Publication types
MeSH terms
Substances
Grants and funding
LinkOut - more resources
Full Text Sources
Medical

