. 2022 Mar 9:11:e55199.
doi: 10.7554/eLife.55199.

Pum2 and TDP-43 refine area-specific cytoarchitecture post-mitotically and modulate translation of Sox5, Bcl11b, and Rorb mRNAs in developing mouse neocortex

Affiliations

Pum2 and TDP-43 refine area-specific cytoarchitecture post-mitotically and modulate translation of Sox5, Bcl11b, and Rorb mRNAs in developing mouse neocortex

Kawssar Harb et al. Elife. .

Abstract

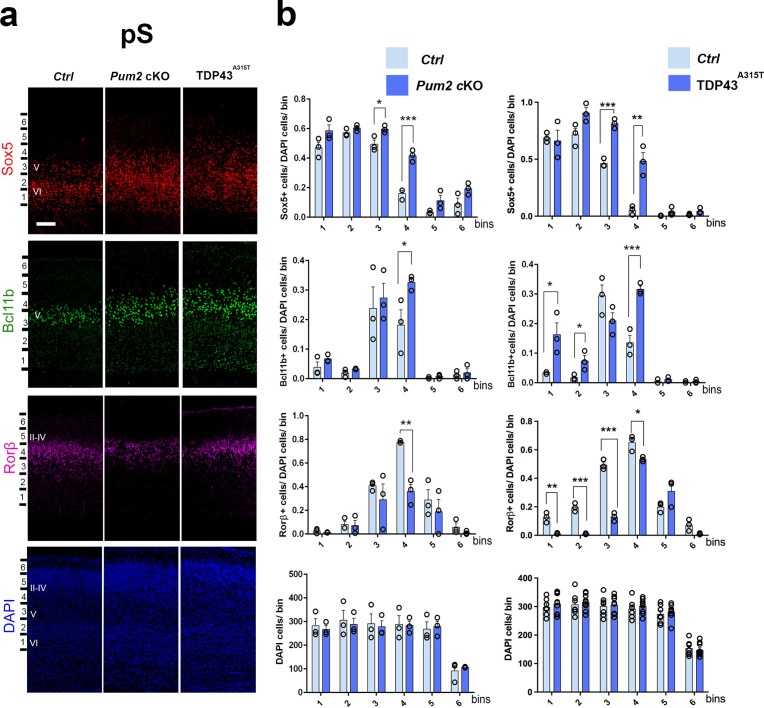
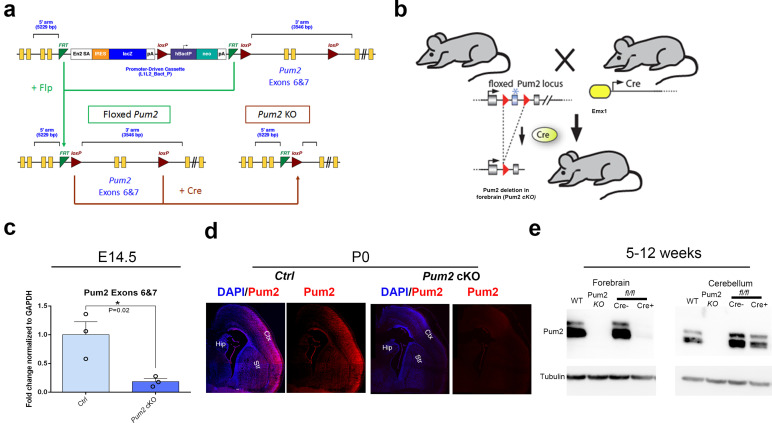
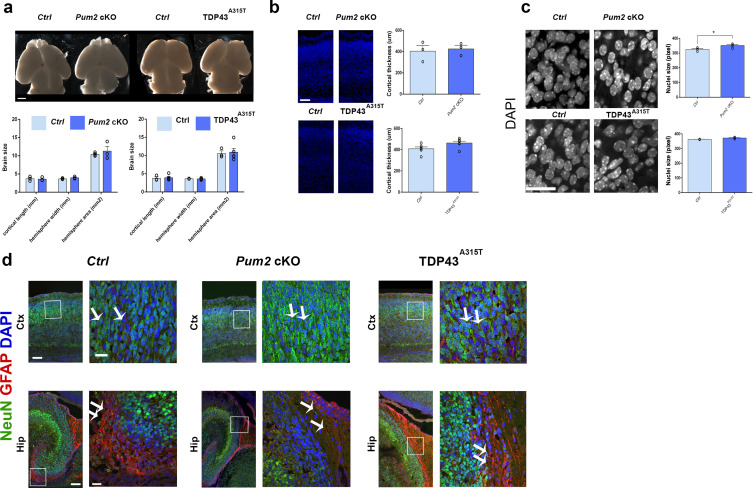
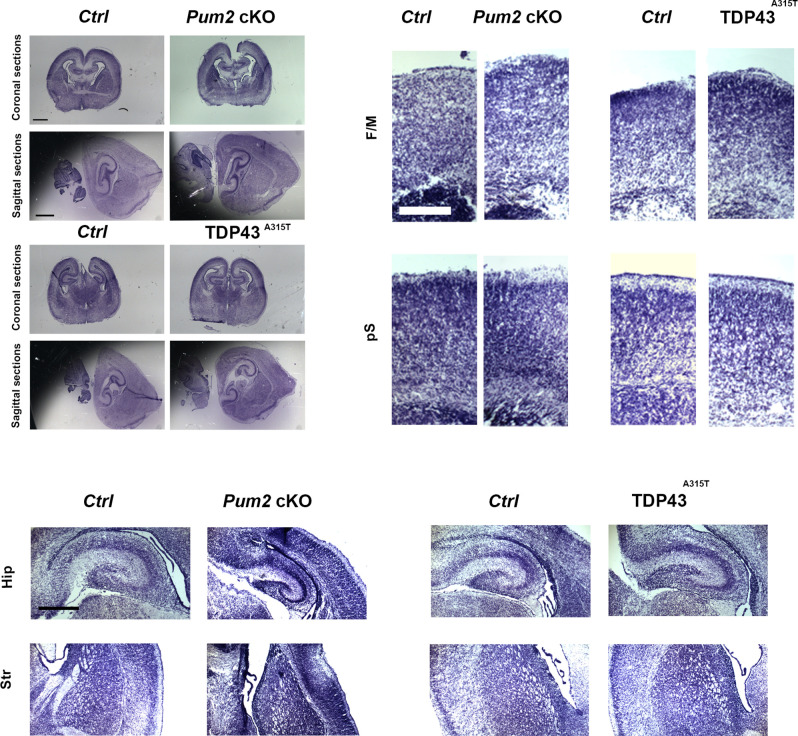
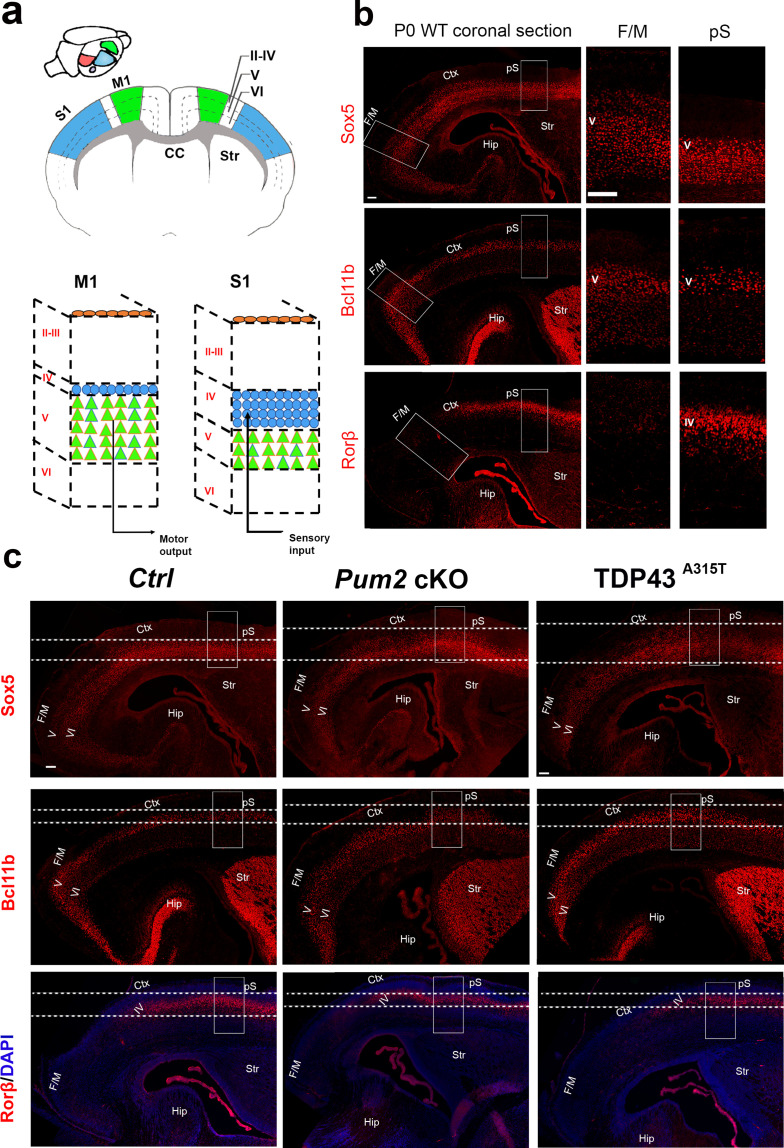
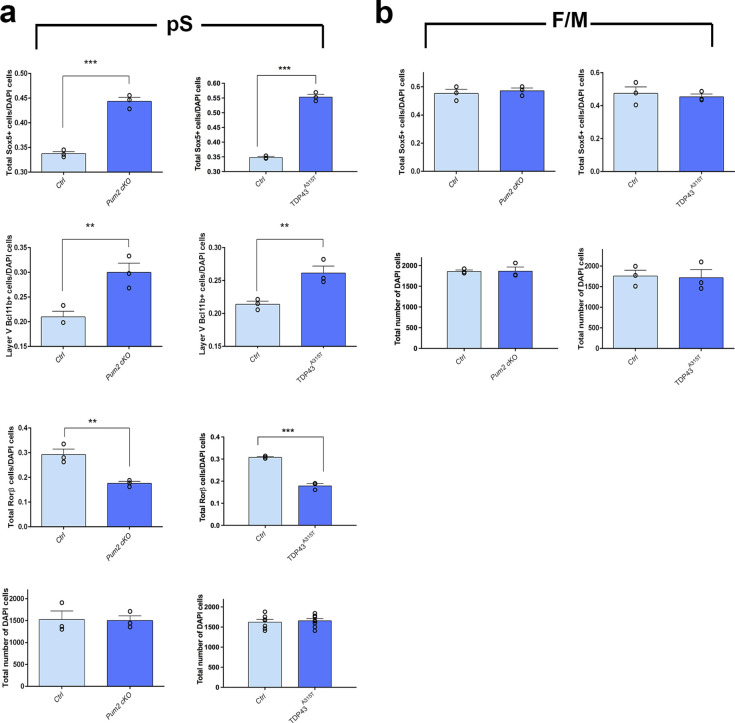
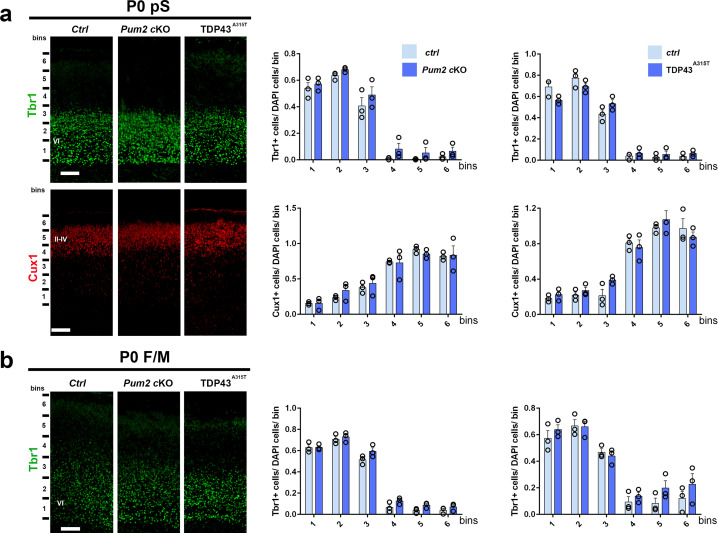
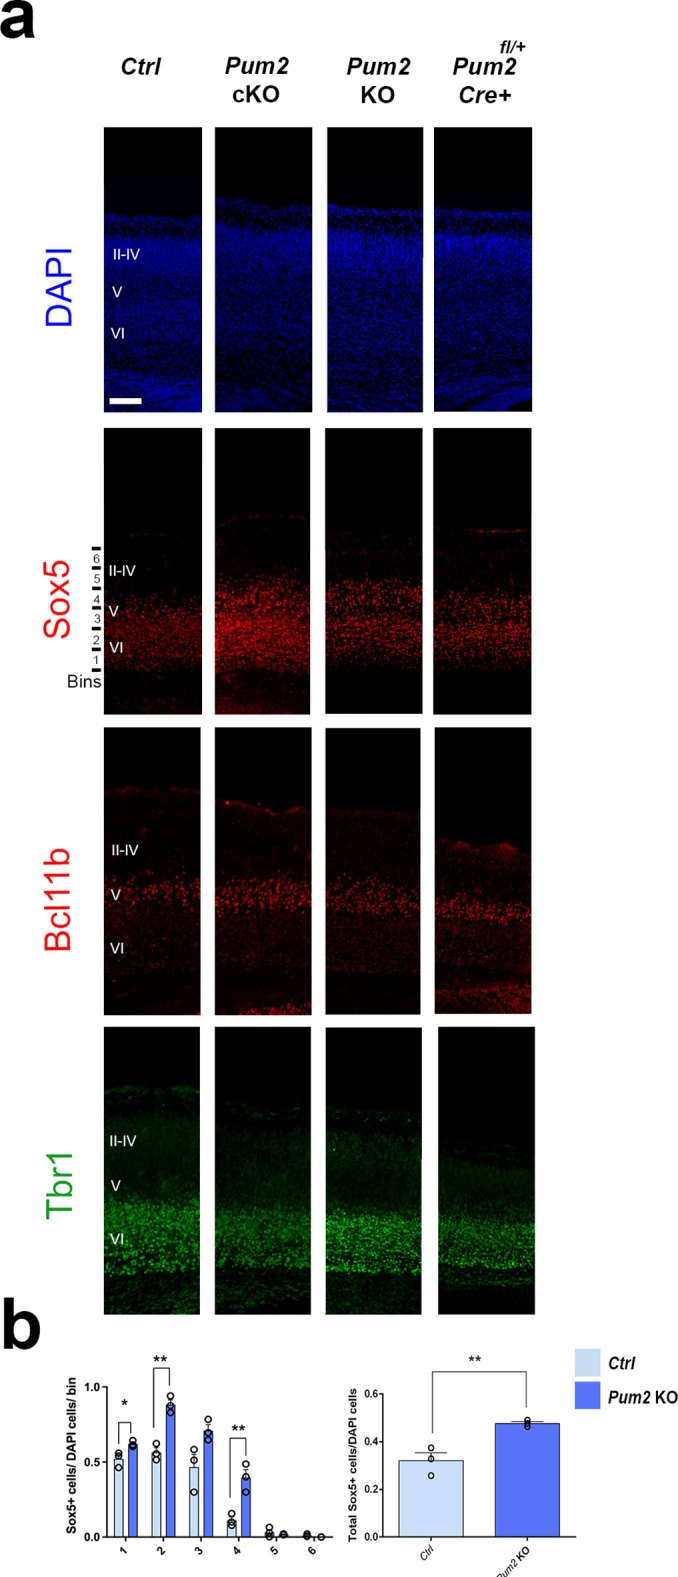
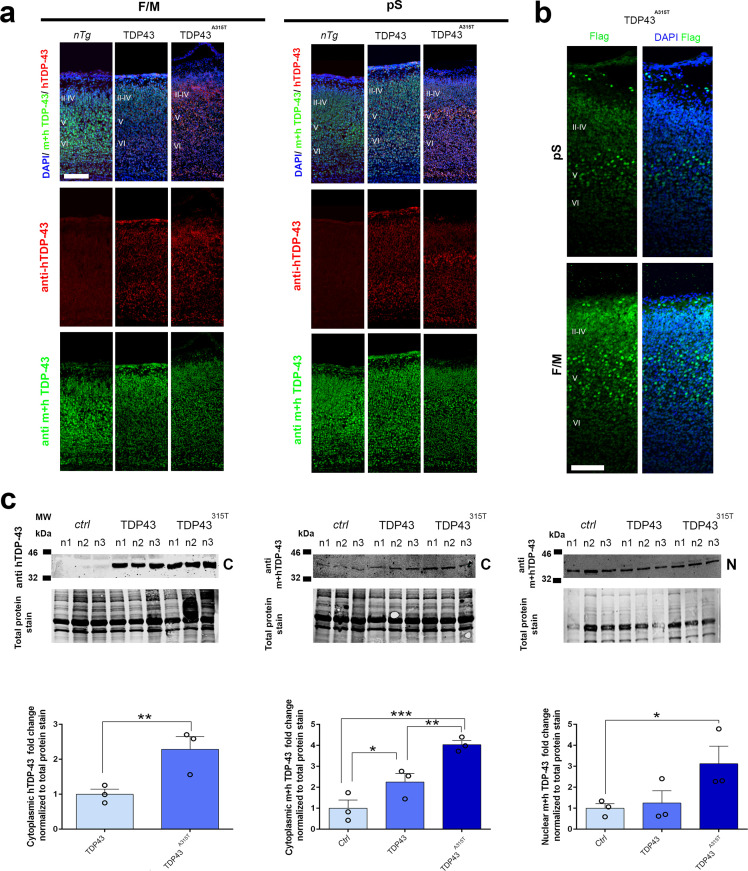
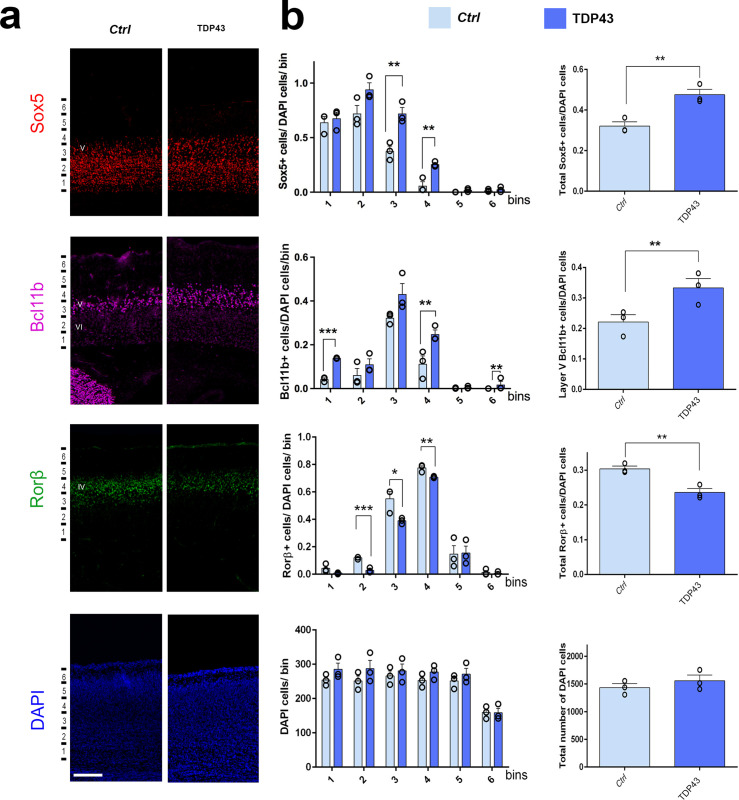
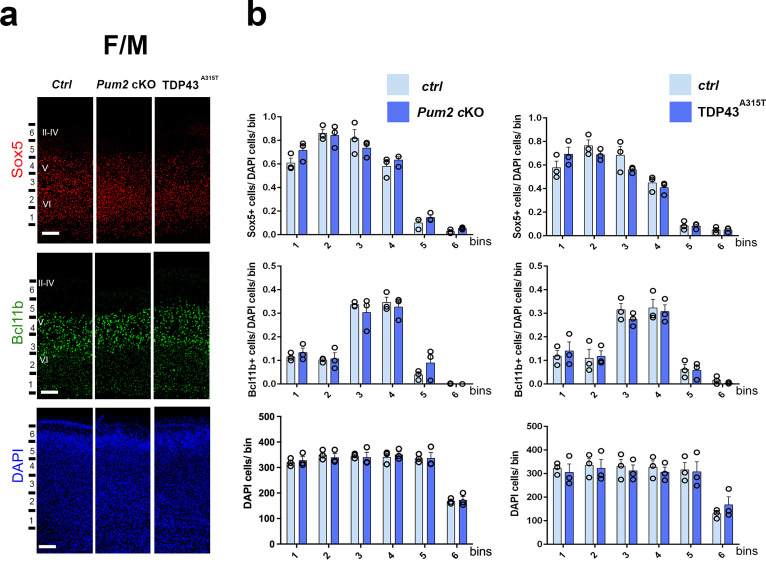
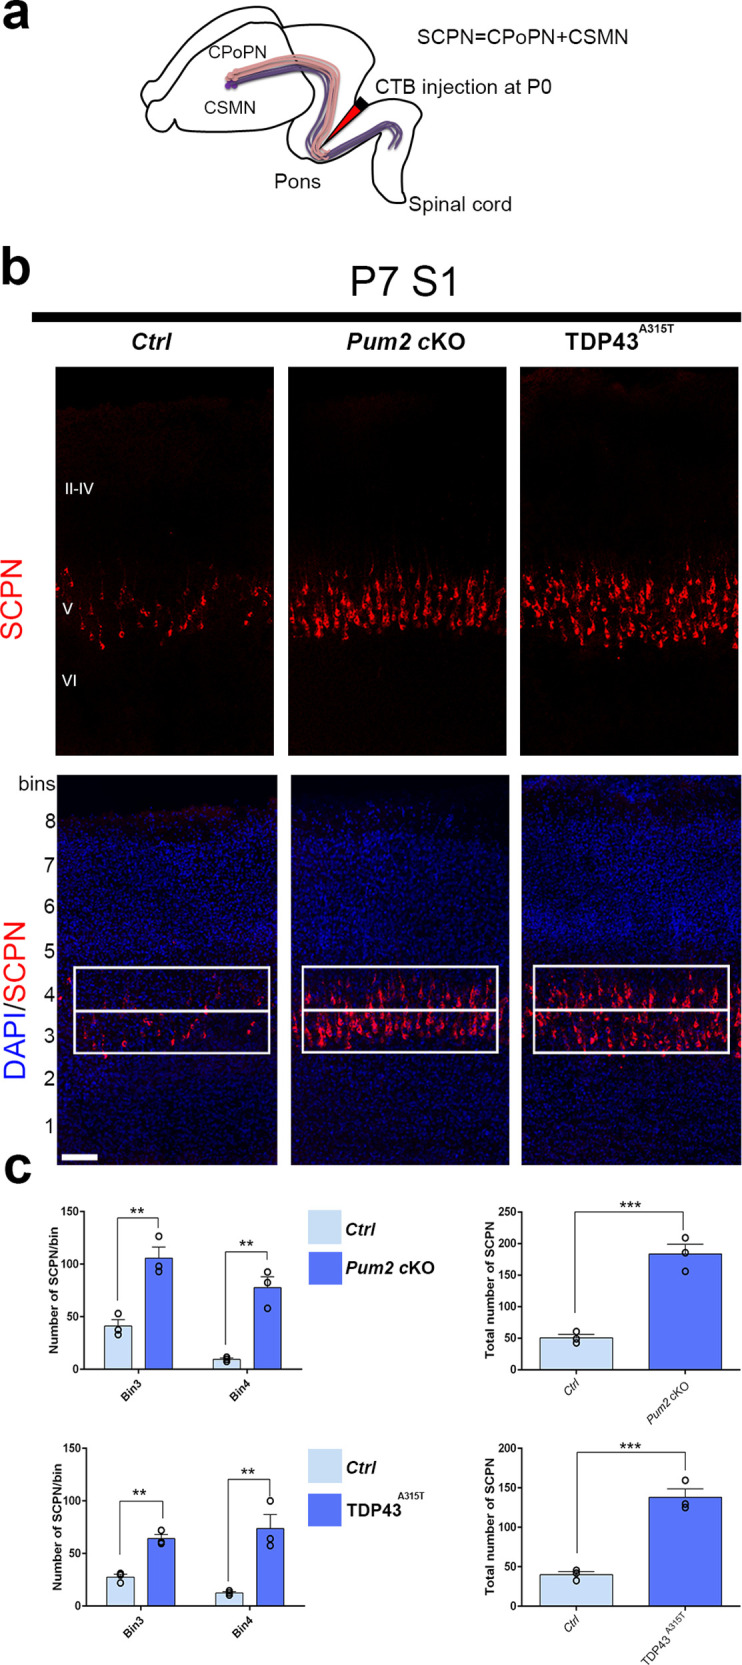
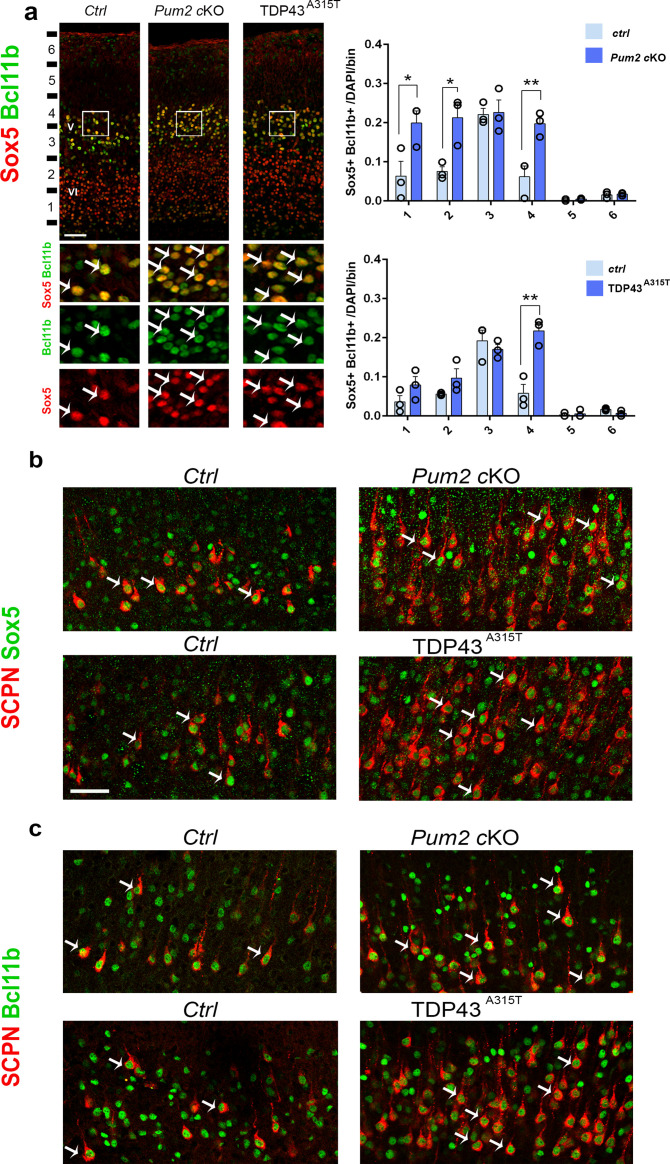
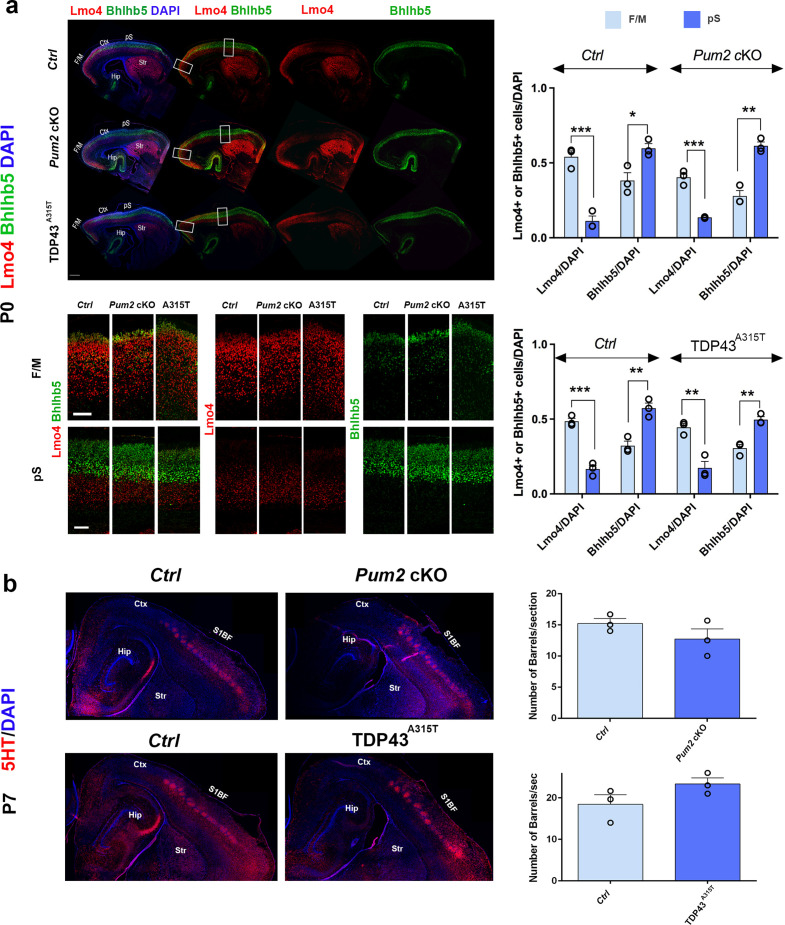
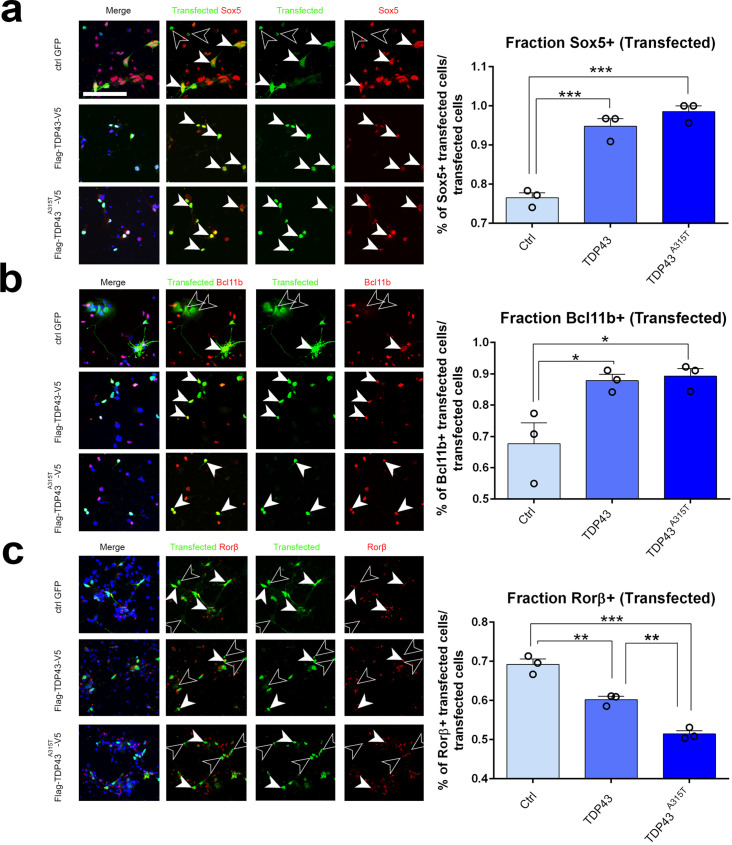
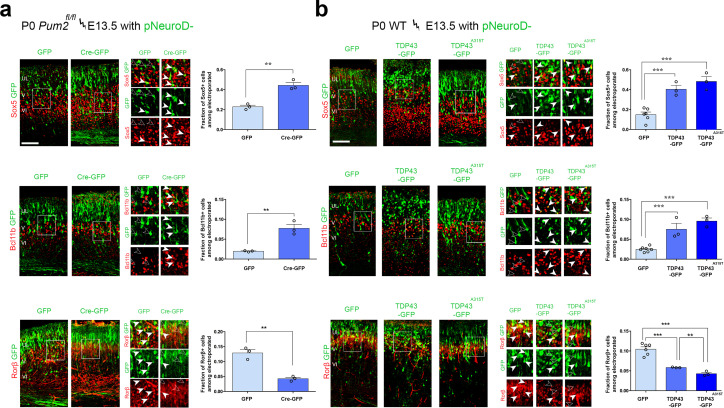
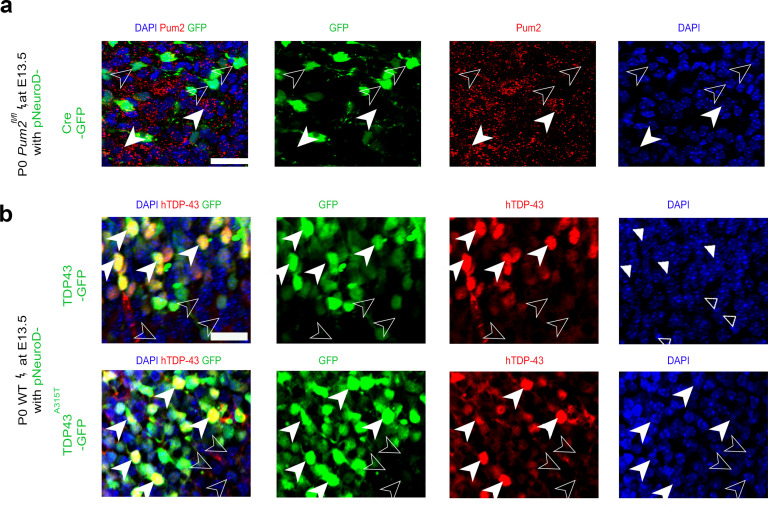
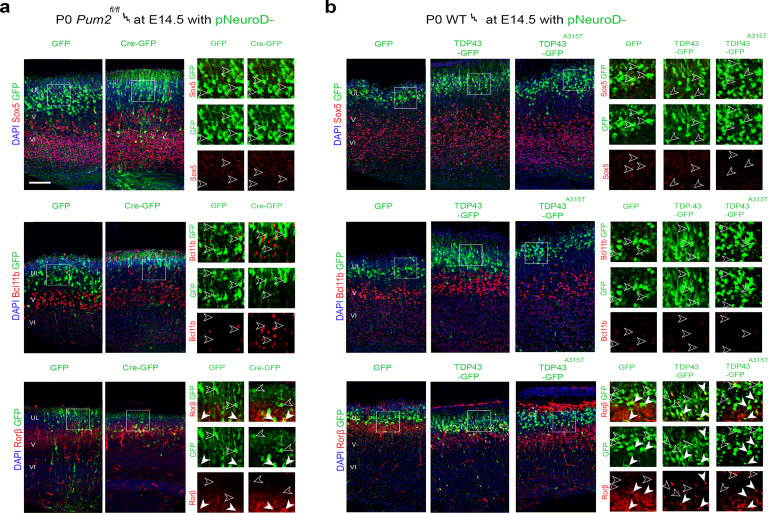
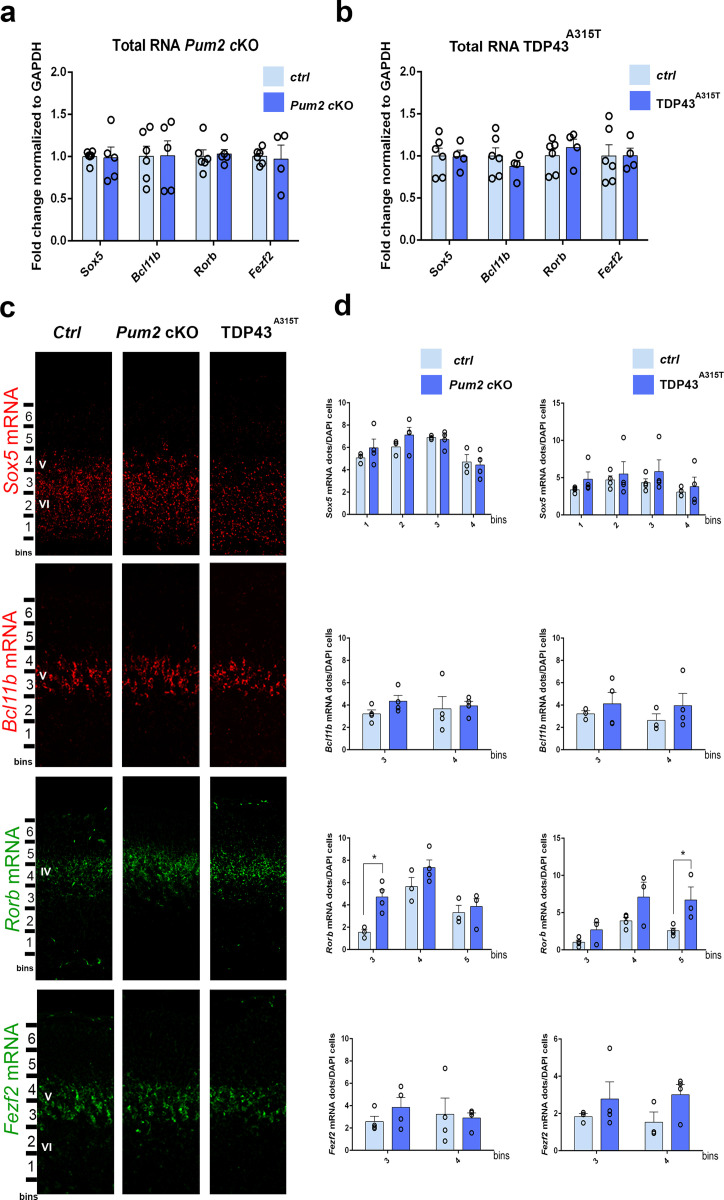
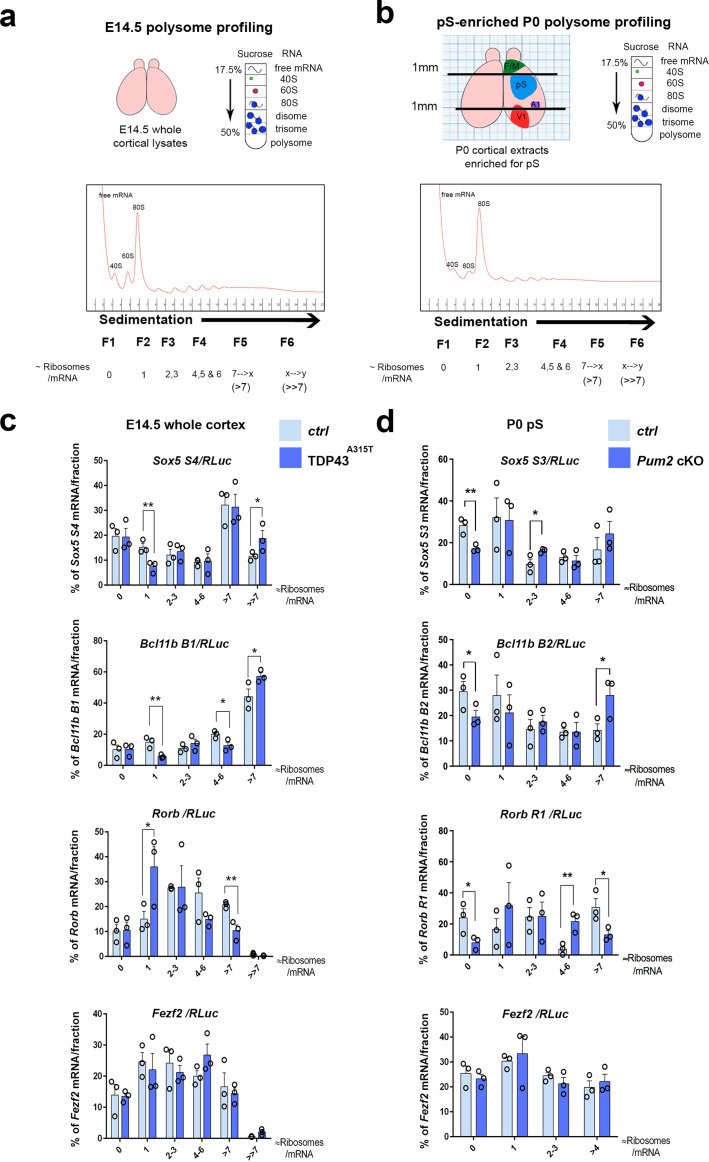
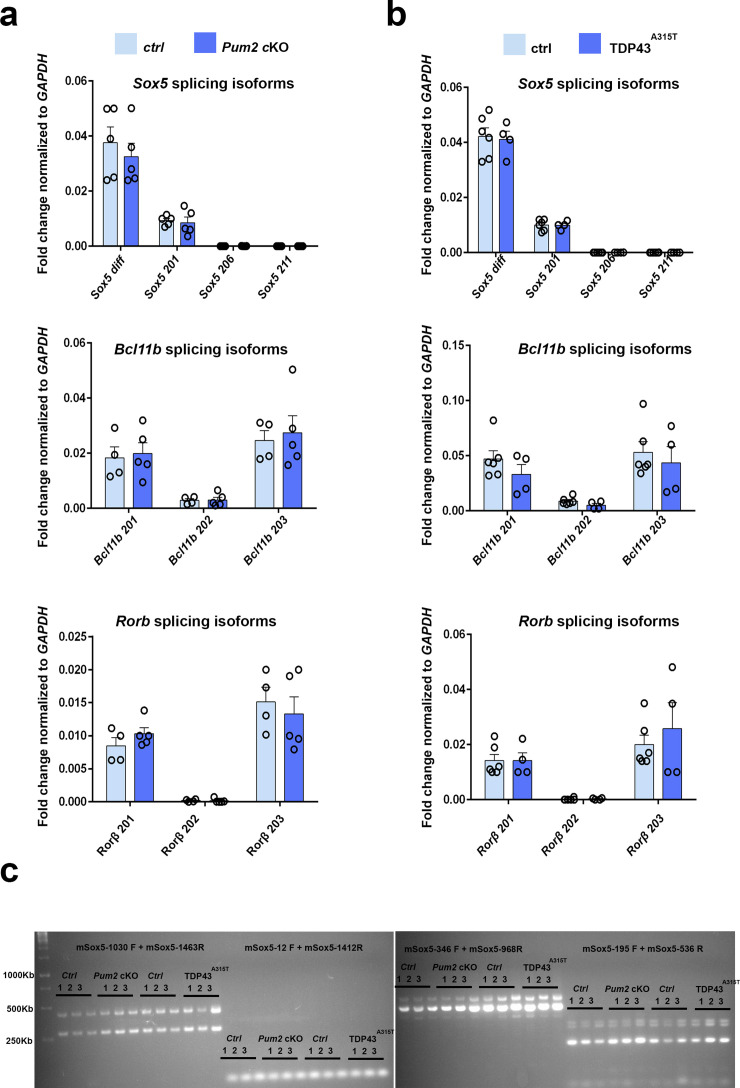
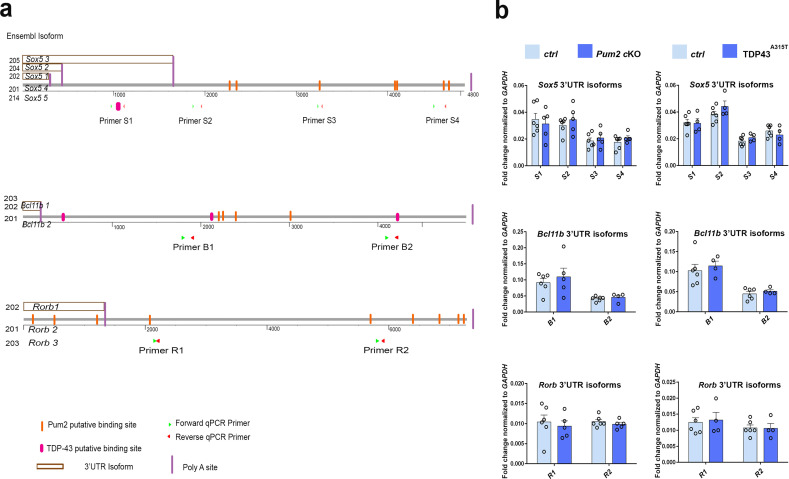
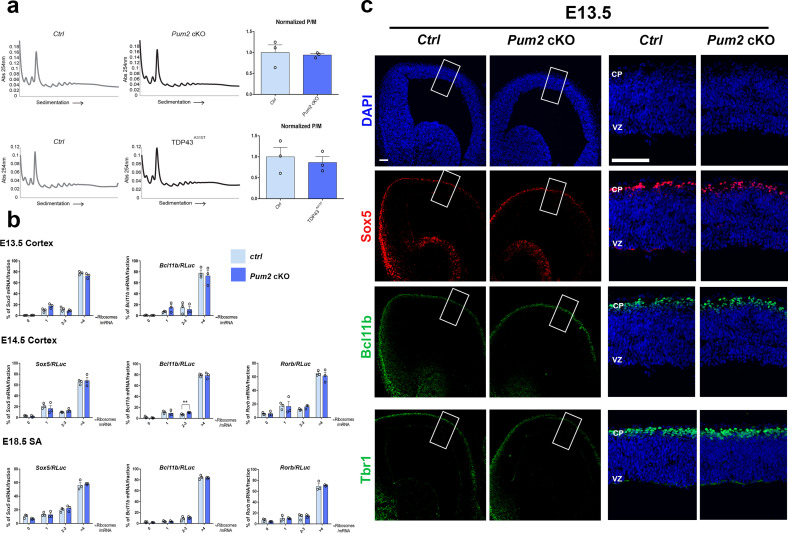
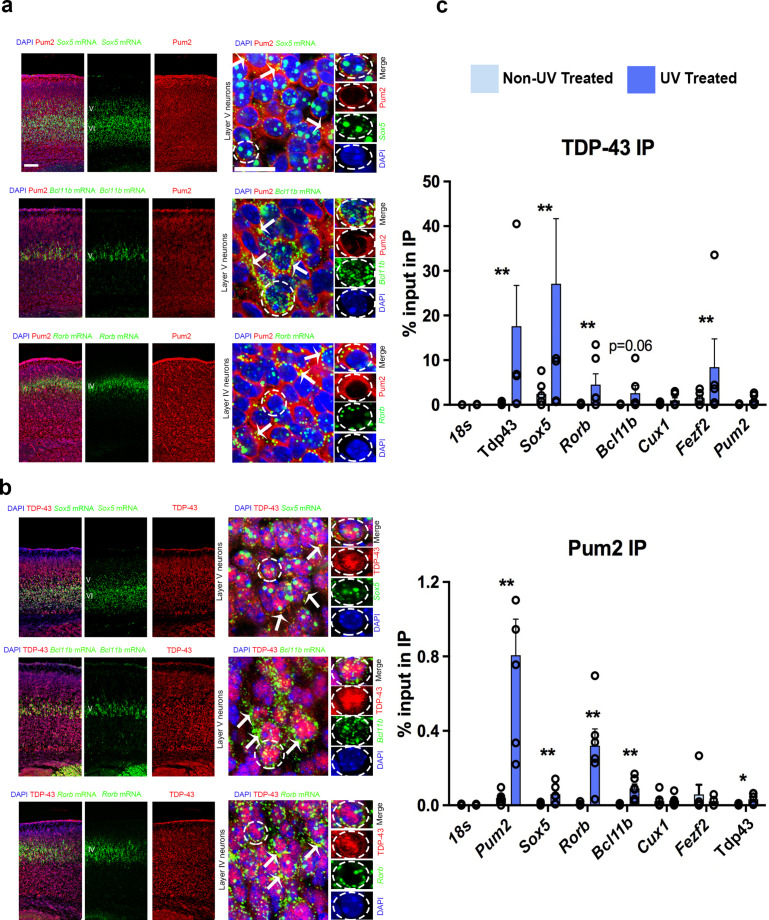
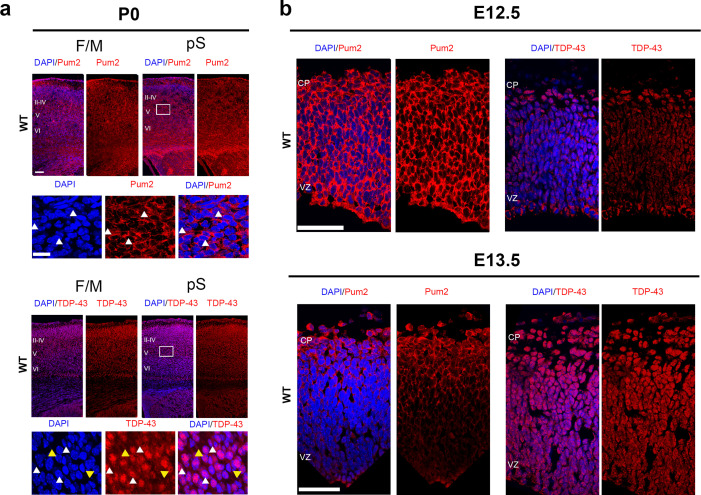
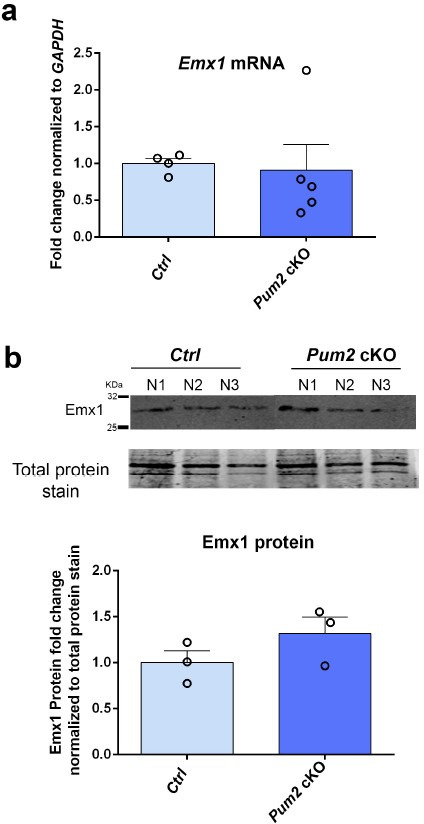
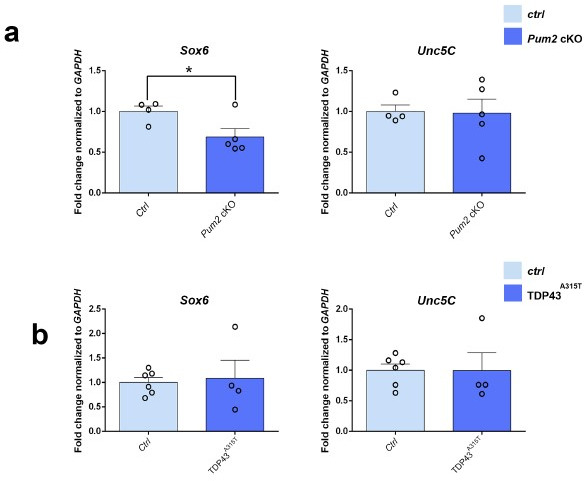
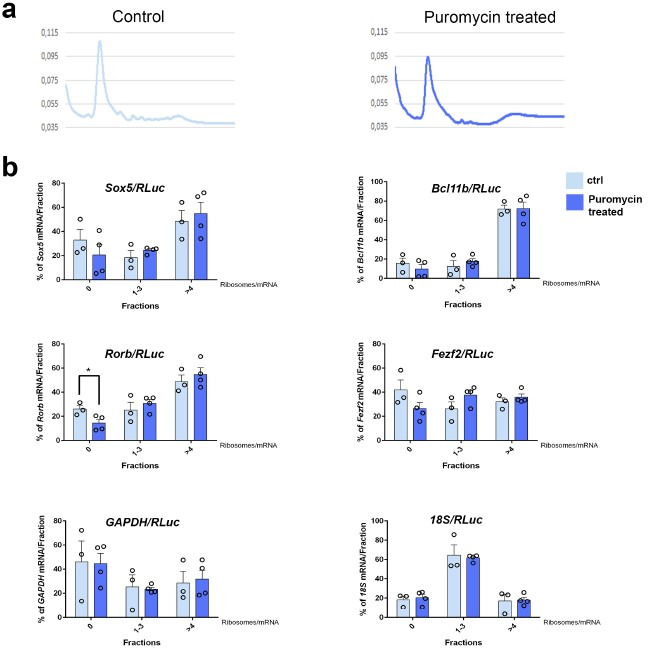
In the neocortex, functionally distinct areas process specific types of information. Area identity is established by morphogens and transcriptional master regulators, but downstream mechanisms driving area-specific neuronal specification remain unclear. Here, we reveal a role for RNA-binding proteins in defining area-specific cytoarchitecture. Mice lacking Pum2 or overexpressing human TDP-43 show apparent 'motorization' of layers IV and V of primary somatosensory cortex (S1), characterized by dramatic expansion of cells co-expressing Sox5 and Bcl11b/Ctip2, a hallmark of subcerebral projection neurons, at the expense of cells expressing the layer IV neuronal marker Rorβ. Moreover, retrograde labeling experiments with cholera toxin B in Pum2; Emx1-Cre and TDP43A315T mice revealed a corresponding increase in subcerebral connectivity of these neurons in S1. Intriguingly, other key features of somatosensory area identity are largely preserved, suggesting that Pum2 and TDP-43 may function in a downstream program, rather than controlling area identity per se. Transfection of primary neurons and in utero electroporation (IUE) suggest cell-autonomous and post-mitotic modulation of Sox5, Bcl11b/Ctip2, and Rorβ levels. Mechanistically, we find that Pum2 and TDP-43 directly interact with and affect the translation of mRNAs encoding Sox5, Bcl11b/Ctip2, and Rorβ. In contrast, effects on the levels of these mRNAs were not detectable in qRT-PCR or single-molecule fluorescent in situ hybridization assays, and we also did not detect effects on their splicing or polyadenylation patterns. Our results support the notion that post-transcriptional regulatory programs involving translational regulation and mediated by Pum2 and TDP-43 contribute to elaboration of area-specific neuronal identity and connectivity in the neocortex.

Keywords: RNA binding proteins; arealization; cell type specification; developmental biology; molecular determinants; mouse; mouse neocortex; neuroscience; translation.


Conflict of interest statement

KH, MR, NN, EM, HH, KK, MH, IH, FC, KD No competing interests declared

Figures

Figure 1.
Figure 1.. Neocortical neuronal identity of somatosensory cortex is altered in Pum2 cKO and TDP43A315T mice.
(a) Coronal sections from neonatal (P0) brains of controls (Ctrl), Pum2 cKO, or Prnp-TARDBPA315T (TDP43A315T) mice were stained with antibodies recognizing Sox5, Bcl11b, or Rorβ or with DAPI to mark nuclei in the prospective somatosensory cortex (pS). (b) Quantification of results from n = 3 mice of each genotype is shown to the right of the relevant marker. Distribution of cells across six equal-sized bins is shown. For Bcl11b, only high-expressing neurons were counted. Data are shown as means ± standard error of the mean (SEM), n = 3 for each genotype. *p≤0.05, **p≤0.01, ***p≤0.001, two-tailed t-test. Pum2 cKO: Pum2fl/fl; Emx1Cre; II–IV, V, VI: layers II–IV, V, and VI. Scale bar: 100 μm.
Figure 1—figure supplement 1.
Figure 1—figure supplement 1.. Generation of Pum2 cKO mice.
(a, b) Deleting the targeting cassette with Flp recombinase leaves a ‘floxed allele’ of Pum2 for cKO. Mating directly to mice expressing Cre recombinase in the germline generates a general Pum2-KO line. Floxed Pum2 mice were mated to Emx1Cre mice to create a forebrain-specific KO. (c) qRT-PCR of E14.5 cortical RNA from controls (Ctrl) vs. Pum2 cKO using primers to the floxed exons. The fold change in expression levels of Pum2 mRNA normalized to GAPDH mRNA in the Pum2 cKO is shown relative to the Cre- control (Ctrl). (d) Coronal sections from controls and Pum2 cKO cortices at P0 immunostained with Pum2 antibody are shown, verifying both antibody specificity and showing the efficiency of Pum2 KO. (e) Immunoblotting of different brain regions confirms forebrain-specific deletion of Pum2 in Pum2flox/flox; Emx1Cre mice. Pum2 cKO: Pum2fl/fl; Emx1Cre.
Figure 1—figure supplement 2.
Figure 1—figure supplement 2.. General cortical developmental features are unaltered in Pum2 and TDP-43 mutants.
(a) Bright-field images of controls (Ctrl), Pum2 cKO, and TDP43A315T mice brains at P0. Quantification of the brain anatomy including hemisphere length, width, and area is shown below. Scale bar: 1 mm. (b) Coronal sections of the somatosensory cortex stained for DAPI of controls (Ctrl), Pum2 cKO, and TDP43A315T mice at P0. Quantification of cortical thickness is shown to the right. Scale bar: 100 μm. (c) DAPI staining of the neocortical nuclei in the somatosensory cortex of controls (Ctrl), Pum2 cKO, and TDP43A315T mice at P0. Quantification of nuclei size is shown to the right. Scale bar: 25 μm. (d) Coronal sections from controls, Pum2 cKO, and TDP43A315T cortices in prospective somatosensory cortex and hippocampus at P0 immunostained with antibodies for NeuN and GFAP and DAPI. Selected cortical and hippocampal regions are marked by white boxes, and high-magnification views of cortex and hippocampus are shown to the right of the respective image. Magnification at the level of the cortex and hippocampus showing only NeuN expression in the cortex, indicating that most cortical cells are neurons and not glia, while GFAP expression is detected in the hippocampus indicating the presence of both glia and neurons in controls and mutants. Scale bars: 100 μm and 25 μm for low- and high-magnification images, respectively. Data are represented as means ± standard error of the mean (SEM), n = 3–6 samples of each genotype. *p≤0.05, two-tailed t-test. Pum2 cKO: Pum2fl/fl; Emx1Cre; ctx: cortex; Hip: hippocampus.
Figure 1—figure supplement 3.
Figure 1—figure supplement 3.. Cortical morphology of Pum2 and TDP-43 mutants is not affected.
Nissl staining of coronal (top) and sagittal (bottom) sections of controls (Ctrl), Pum2 cKO, and TDP43A315T mice at P0 (coronal) and P7 (sagittal). To the right and below, higher-magnification levels of coronal sections of controls (Ctrl), Pum2 cKO, and TDP43A315T mice at P0 for frontal/motor cortex (F/M), prospective somatosensory cortex (pS), hippocampus (Hip), and striatum (Str). Pum2 cKO: Pum2fl/fl; Emx1Cre.
Figure 1—figure supplement 4.
Figure 1—figure supplement 4.. Specialized neocortical architecture of S1 and M1 is altered in Pum2 cKO and TDP43A315T mutant mice.
(a) Schematic representations of a mouse brain are shown. The upper left is a top-down view with different primary areas in neocortex indicated: primary motor area (M1) in green, primary somatosensory area (S1) in blue, primary auditory area (A1) in purple, and primary visual area (V1) in red. In the middle, a coronal brain section is shown with M1 and S1 neocortical areas indicated. Dashed lines delineate the approximate boundaries of layer V in the two areas. The bottom images show a magnification of neocortical layers in M1 and S1 emphasizing the change in the thickness of layers IV (blue) and V (green) in the two areas. (b) Coronal sections from P0 wild-type (C57BL/6J) brains immunostained for Sox5, Bcl11b, and Rorβ are shown. Selected regions are marked by white rectangles, and high-magnification views of frontal motor (F/M) and prospective somatosensory (pS) areas are shown to the right of the respective image. (c) Coronal sections at P0 from controls (Ctrl), Pum2 cKO, or TDP43A315T brains immunolabeled for Sox5, Bcl11b, or Rorβ, with dashed lines delineating the thickness of their expression. White rectangles indicate pS. Ctx: cortex; Hip: hippocampus; Str: striatum; CC: corpus callosum; II–III, IV, V, VI: layers II–III, IV, V, and VI; Pum2 cKO: Pum2fl/fl; Emx1Cre. Scale bars: 100 μm.
Figure 1—figure supplement 5.
Figure 1—figure supplement 5.. Quantitative analysis of neocortical layer neuron identity in prospective somatosensory cortex (pS) vs. frontal/motor area (F/M) at P0.
(a, b) Quantification of total Sox5-, Rorβ-, and DAPI-positive neurons and layer V Bcl11b+ neurons in controls (Ctrl), Pum2 cKO, or TDP43A315T mice in pS (a) or F/M) (b. The total number of Sox5+ or Rorβ+ neurons was normalized to the total number of DAPI cells. Layer V Bcl11b+ neurons in bins 3 and 4 were normalized to the number of DAPI cells in both bins. The absolute number of DAPI cells was also analyzed in equal-width areas in all animals. Data are represented as means ± standard error of the mean (SEM). **p≤0.01, ***p≤0.001, two-tailed t-test. Pum2 cKO: Pum2fl/fl; Emx1Cre.
Figure 1—figure supplement 6.
Figure 1—figure supplement 6.. Normal layer VI and upper layers in Pum2 cKO and TDP43A315T mice.
(a, b) Coronal sections at P0 from controls (Ctrl), Pum2 cKO, and TDP43A315T brains immunolabeled for Tbr1 and Cux1 in prospective somatosensory cortex (pS) (a) or frontal/motor area (F/M) (b). To the right, a quantification of Tbr1- and Cux1-positive neurons normalized to the number of DAPI-positive cells in six equal bins. Scale bars: 100 μm. Data are represented as means ± standard error of the mean (SEM), two-tailed t-test. II–IV, VI: layers II–IV and VI; Pum2 cKO: Pum2fl/fl; Emx1Cre.
Figure 1—figure supplement 7.
Figure 1—figure supplement 7.. Prospective somatosensory cortex (pS) layer IV/V phenotypes are also observed in Pum2 KO, but not Pum2fl/+; Emx1Cre transgenic mouse line.
(a) Coronal sections of pS at P0 from controls, Pum2 cKO, Pum2 KO, or heterozygous Pum2 cKO (Pum2fl/+; Emx1Cre) animals stained with DAPI or immunostained for Sox5, Bcl11b, or Tbr1. (b) Histograms show quantification of Sox5 expression normalized to DAPI in Pum2 KO animals either in bins (left) or in total (right). Data are represented as means ± standard error of the mean (SEM). *p≤0.05, **p≤0.01 by two-tailed t-test. Ctrl: controls; Pum2 cKO: Pum2fl/fl; Emx1Cre; Pum2 KO: Pum2 constitutive knockout; II–IV, V, VI: layers II–IV, V, and VI. Scale bars: 100 μm.
Figure 1—figure supplement 8.
Figure 1—figure supplement 8.. Expression patterns and relative levels of TDP-43 and transgenic hTDP-43 proteins in developing mouse neocortex.
Coronal sections from neonatal (P0) brains of non-transgenic controls (nTg), Prnp-TARDBP (TDP43), and hTARDBPA315T (TDP43A315T) mice were stained with antibodies recognizing either human TDP-43 (anti-hTDP-43) or both mouse and human TDP-43 (anti m + h TDP-43) and with DAPI to mark nuclei in either the frontal/motor area (F/M) or prospective somatosensory cortex (pS). (b) Coronal sections from neonatal (P0) brains of hTARDBPA315T (TDP43A315T) mice were stained with antibody recognizing the Flag tag coupled with the hTDP-43A315T transgene in either the pS or the F/M. Note the stronger signal for this transgenic protein in layer V of the pS, which is also observed with the human-specific anti-TDP-43 antibody in (a). II–IV, V, VI: layers II–IV, V, and VI. Scale bars: 100 μm. (c) Immunoblots of nuclear (N) or cytoplasmic (C) fractions from three mice (n1–3) of each genotype (Ctrl, TDP43, or TDP43A315T) are shown. Signal for antibodies recognizing exclusively human TDP-43 (hTDP-43) or both mouse and human (m + h) TDP-43 is indicated. Approximate molecular weights in kDa based on marker migration are indicated on the left. Quantification of corresponding fold changes in protein levels normalized to total protein is shown below. Data are shown as means ± standard error of the mean (SEM), n = 3 for each genotype. *p≤0.05, **p≤0.01, ***p≤0.001 by one-tailed t-test.
Figure 1—figure supplement 9.
Figure 1—figure supplement 9.. Neuronal identity of layers IV and V is affected by TDP-43 gain of function.
(a) Coronal sections from neonatal (P0) brains of control mice (Ctrl) or mice from a transgenic line expressing, Prnp-TARDBP (TDP43), were stained with antibodies recognizing Sox5, Bcl11b, or Rorβ and co-stained with DAPI to mark nuclei in the prospective somatosensory cortex (pS). (b) Quantification from (a) shown by six equal-sized bins (left panel) and the total number of Sox5- or Rorβ- or DAPI-positive cells in all bins and in layer V for Bcl11b (right panel). Only high-expressing Bcl11b+ neurons were counted. Data are shown as means ± standard error of the mean (SEM), n = 3 for each genotype. *p≤0.05, **p≤0.01, ***p≤0.001 by two-tailed t-test. IV, V, VI: layers IV, V, and VI. Scale bar: 100 μm.
Figure 2.
Figure 2.. Neocortical neuronal identity remains unaffected in the motor cortex of Pum2 and TDP-43 mutants.
(a) Coronal sections from neonatal (P0) brains of controls (Ctrl), Pum2 cKO, or Prnp-TARDBPA315T (TDP43A315T) mice were stained with antibodies recognizing Sox5, Bcl11b, or with DAPI to mark nuclei in the frontal/motor area (F/M). (b) Quantification of results from n = 3 mice of each genotype is shown to the right of the relevant marker. Distribution of cells across six equal-sized bins is shown. For Bcl11b, only high-expressing neurons were counted. Data are shown as means ± standard error of the mean (SEM), n = 3 for each genotype, two-tailed t-test. Pum2 cKO: Pum2fl/fl; Emx1Cre; II–IV, V, VI: layers II–IV, V, and VI. Scale bar: 100 μm.
Figure 3.
Figure 3.. Increased subcerebral connectivity in somatosensory cortex of Pum2 cKO and TDP43A315T mice.
(a) Schematic representation of cholera toxin subunit B (CTB) injections at the midbrain/hindbrain junction (pons) for retrograde labeling of subcerebral projection neurons (SCPNs), including corticospinal PNs (CSMN) and corticopontine PNs (CPoPN). (b) Coronal sections from primary somatosensory cortex (S1) of controls, Pum2 cKO, and TDP43A315T mice at P7 traced for SCPNs without (top) or with DAPI (bottom) staining. S1 columns merged with DAPI are divided into eight equal bins. White rectangles indicate bins 3 and 4. (c) Quantification of retrogradely labeled SCPNs in equal-sized bins for the three genotypes. Analysis of bins 3 and 4 is shown separately in the left panel and combined in the right panel. Data are shown as means ± standard error of the mean (SEM), n = 3 for each genotype. **p≤0.01, ***p≤0.001, two-tailed t-test. Pum2 cKO: Pum2fl/fl; Emx1Cre; II–IV, V, VI: layers II–IV, V and VI, respectively. Scale bars: 100 μm.
Figure 4.
Figure 4.. Subcerebral projection neurons’ (SCPNs’) increase colocalizes with Sox5 and Bcl11b in Pum2 and TDP-43 mutants.
(a) Coronal sections from neonatal (P0) brains of controls (Ctrl), Pum2 cKO, or Prnp-TARDBPA315T (TDP43A315T) mice were stained with antibodies recognizing Sox5 and Bcl11b in the prospective somatosensory area (pS). Quantification of Sox5 and Bcl11b colocalization from n = 3 mice of each genotype is shown to the right across six equal-sized bins. (b, c) Coronal sections from primary somatosensory cortex (S1) of controls, Pum2 cKO, and TDP43A315T mice at P7 traced for SCPNs combined with Sox5 (b) or Bcl11b (c) staining. White arrows in (a–c) indicate colocalization. Data are shown as means ± standard error of the mean (SEM), n = 3 for each genotype. *p≤0.05, **p≤0.01, two-tailed t-test. Pum2 cKO: Pum2fl/fl; Emx1Cre; V, VI: layers V and VI. Scale bars: 100 μm.
Figure 5.
Figure 5.. Somatosensory area identity is properly determined in Pum2 cKO and TDP43A315T mutants despite layers IV and V being ‘motorized.’.
(a) Coronal sections of one brain hemisphere from controls (Ctrl), Pum2 cKO, and TDP43A315T brains at P0 co-immunostained for Lmo4 and Bhlhb5. Selected regions are marked by white rectangles in the upper panel, and high-magnification views of frontal motor (F/M) and prospective somatosensory (pS) areas are shown below. Scale bars: 400 μm and 100 μm, respectively. Quantification of results is shown to the right. (b) Sagittal sections from controls, Pum2 cKO (top), and TDP43A315T (bottom) at P7 immunolabeled for serotonin (5HT). Quantification of the number of barrels per section is shown to the right. Scale bar: 100 μm. Data are shown as means ± standard error of the mean (SEM), n = 3 for each genotype. *p≤0.05, **p≤0.01, ***p≤0.001, two-tailed t-test. Pum2 cKO: Pum2fl/fl; Emx1Cre; Ctx: cortex; Hip: hippocampus; Str: striatum; S1BF: barrel field region of S1. Scale bar: 100 μm.
Figure 6.
Figure 6.. TDP-43 gain of function cell-autonomously regulates layer IV and V molecular determinants in vitro.
(a–c) Primary neurons harvested from WT cortical lysates enriched for somatosensory cortex at E18.5 were transfected before plating with plasmids encoding either control GFP, TDP43, or TDP43A315T. After 48 hr in culture, neurons were fixed and stained with antibodies recognizing GFP to label control transfected neurons or recognizing either the Flag (a, b) or V5 (c) epitope tag to label neurons transfected with either TDP43 or TDP43A315T. All transfected neurons were co-immunolabeled with antibodies recognizing Sox5 (a), Bcl11b (b), or Rorβ (c) and with DAPI. Quantification of the fraction of Sox5+, Bcl11b+, or Rorβ+ neurons among all transfected neurons is shown to the right of the representative images. At least 50 cells were counted for each replicate of every transfection. Data are shown as means ± standard error of the mean (SEM), n = 3 for each transfection. *p≤0.05, **p≤0.01, ***p≤0.001, two-tailed t-test. Scale bar: 100 μm.
Figure 7.
Figure 7.. RNA-binding proteins Pum2 and TDP-43 regulate layer IV and V molecular determinants post-mitotically and cell-autonomously in vivo.
(a, b) Coronal sections from Pum2fl/fl (a) or WT (b) brains at P0 electroporated at E13,5 with pNeuroD-IRES-GFP as control, or with p-NeuroD-IRES-Cre-GFP to ablate Pum2 expression (a) or p-NeuroD-TDP43-IRES-GFP or p-NeuroD-TDP43A315T-IRES-GFP to overexpress hTDP-43 alleles only in post-mitotic neurons. Sections are co-stained with antibodies recognizing GFP to label electroporated neurons and antibodies recognizing Sox5, Bcl11b, or Rorβ. High-magnification views are shown to the right. White arrowheads indicate examples of electroporated neurons expressing Sox5-, Bcl11b-, and Rorβ-positive neurons while empty arrowheads indicate electroporated neurons not expressing these proteins. Quantification of the fraction of Sox5+, Bcl11b+, or Rorβ+ neurons among all electroporated cells is shown to the right of the representative images. Data are shown as means ± standard error of the mean (SEM), n = 3 for each electroporation. Both p-NeuroD-IRES-Cre-GFP and hTDP-43 alleles were co-electroporated with T-dimer (red) to distinguish them from littermate control brains electroporated only with pNeuroD-IRES-GFP. For both hTDP-43 alleles, the respective control littermates for each variant were combined to a total of n = 6 for pNeuroD-IRES-GFP electroporations. **p≤0.01, ***p≤0.001, two-tailed t-test. UL, V, VI: upper layers, layers V and VI. Scale bar: 100 μm.
Figure 7—figure supplement 1.
Figure 7—figure supplement 1.. Validation of electroporation efficiency.
High-magnification coronal sections from Pum2fl/fl (a) or WT (b) brains at P0 electroporated with pNeuroD-IRES-GFP as control, or with p-NeuroD-IRES-Cre-GFP to ablate Pum2 expression (a) or p-NeuroD-TDP43-IRES-GFP or p-NeuroD-TDP43A315T-IRES-GFP to overexpress hTDP-43 alleles only in post-mitotic neurons (b). Sections were co-stained with antibodies recognizing GFP to label electroporated neurons and antibodies recognizing Pum2 to validate Pum2 deletion, and hTDP-43 to validate hTDP-43 overexpression compared to DAPI-positive GFP-negative nonelectroporated neurons. White arrowheads indicate cells expressing Pum2 or hTDP-43 while empty arrowheads indicate cells not expressing these proteins. Scale bars: 25 μm.
Figure 7—figure supplement 2.
Figure 7—figure supplement 2.. Upper-layer neuronal identity is not affected in Pum2 and TDP-43 mutants.
(a, b) Coronal sections from Pum2fl/fl (a) or WT (b) brains at P0 electroporated at E14.5 with pNeuroD-IRES-GFP as control, or with p-NeuroD-IRES-Cre-GFP to ablate Pum2 expression (a) or p-NeuroD-TDP43-IRES-GFP or p-NeuroD-TDP43A315T-IRES-GFP to overexpress hTDP-43 alleles only in post-mitotic neurons (b). Sections are co-stained with antibodies recognizing GFP to label electroporated neurons and antibodies recognizing Sox5, Bcl11b, or Rorβ. White boxes indicate selected cortical regions. High-magnification views of the selected areas are shown to the right. White arrowheads indicate examples of electroporated neurons expressing Sox5-, Bcl11b-, and Rorβ-positive neurons while empty arrowheads indicate electroporated neurons not expressing these proteins. UL, V, VI: upper layers, layers V and VI; SEM: standard error of the mean. Scale bar: 100 μm.
Figure 8.
Figure 8.. mRNA levels of layer IV/V neuronal identity determinants remain unchanged in Pum2 cKO or TDP43A315T mutants.
qRT-PCR of RNA derived from P0 somatosensory area-enriched cortical lysates for Pum2 cKO (a) or TDP43A315T (b). The fold change for Sox5, Bcl11b, Rorb, and Fezf2 mRNAs normalized to GAPDH mRNA is shown for mutants relative to respective control samples (Ctrl). Data are displayed as means ± standard error of the mean (SEM) for at least n = 4 of each genotype. (c) Single-molecule fluorescent in situ hybridization (smFISH) for Sox5, Bcl11b, Rorb, and Fezf2 mRNAs on coronal sections from the prospective somatosensory area (pS) of controls (Ctrl), Pum2 cKO, and TDP43A315T mice at P0. Distribution of cells across six equal-sized bins is shown. (d) Quantification from (c). The number of RNA dots in the bins where they are mostly expressed is normalized to the total number of cell nuclei (DAPI) within that bin. Data are shown as means ± SEM, at least n = 3 for each genotype. *p≤0.05 by two-tailed t-test. Pum2 cKO: Pum2fl/fl; Emx1Cre; IV, V, VI: layers IV, V and VI, respectively. Scale bar: 100 μm.
Figure 9.
Figure 9.. Translational control of layer IV/V neuronal identity determinants by Pum2 and TDP-43 in developing neocortex.
(a) Schematic overview of polysome profiling for developing neocortices. Lysates from dissected E14.5 cortices were separated on polysome gradients, and RNA was prepared from fractions (F1–6) corresponding to the indicated ribosomal densities. (b) A schematic representation showing dissection of an enriched prospective somatosensory region from P0 brains using millimeter paper to eliminate 1 mm from the rostral end and 1 mm from the caudal end of cortices. Lysates for polysome profiling were made from the remaining part. F/M: frontal/motor area; pS: prospective somatosensory cortex; A1: primary auditory cortex; V1: primary visual cortex. (c, d) Histograms depict the distribution of the Sox5, Bcl11b, Rorb, and Fezf2 mRNAs across the gradient fractions for TDP43A315T (c) and Pum2 cKO (d), relative to corresponding controls (Ctrl). Samples in heavier gradient fractions were virtually pooled at analysis to simplify visualization in (d) and in the case of the Bcl11b B1 primer in (c). Levels of specific mRNAs in each fraction were analyzed by qRT-PCR with normalization to an RLuc mRNA spike-in control, which was added in an equal amount to the fractions prior to RNA preparation. Data are shown as means ± standard error of the mean (SEM), n = 3 for each genotype. *p≤0.05, **p≤0.01, one-tailed t-test. Pum2 cKO: Pum2fl/fl; Emx1Cre.
Figure 9—figure supplement 1.
Figure 9—figure supplement 1.. Sox5, Bcl11b, and Rorb splicing is unaffected in Pum2 and TDP-43 mutant neocortices.
(a, b) Expression of Sox5, Bcl11b, and Rorb splicing mRNA isoforms normalized to GAPDH mRNA is shown in P0 somatosensory area-enriched cortical lysates of Pum2 cKO (a) and TDP43 A315T (b) mutants and their respective control samples (Ctrl). For Sox5, seven protein-coding isoforms were annotated. We designed primers recognizing three of them, and it was not possible to design specific qPCR primers to distinguish the other four isoforms for which we used a primer called Sox5 diff to detect the four of them simultaneously. Splicing isoforms for mouse Bcl11b/Bcl11b and Rorb mRNAs were identified from Ensembl. Non-protein-coding isoforms were not taken into consideration. Data are shown as means ± standard error of the mean (SEM) for at least n = 4 of each genotype. Pum2 cKO: Pum2fl/fl; Emx1Cre. Two-tailed t-test. (c) RT-PCR showing the expression of different Sox5 splicing isoforms in the prospective somatosensory cortex (pS) from three mice (N1–3) of Ctrl, Pum2 cKO, and TDP43 A315T. Note the similar isoform expression between controls and mutants. Pum2 cKO: Pum2fl/fl; Emx1Cre.
Figure 9—figure supplement 2.
Figure 9—figure supplement 2.. 3′UTR isoforms with predicted binding sites for Pum2 and TDP-43 are expressed in developing neocortex, and alternative polyadenylation remains unaltered in Pum2 and TDP-43 mutants.
(a) 3′UTR regions for mouse Sox5, Bcl11b/Bcl11b, and Rorb mRNAs from Ensembl are shown to scale. Alternative polyadenylation sites that give rise to the different 3′UTR isoforms are indicated, as are corresponding transcripts in Ensembl. Position of consensus Pum2-binding sequences (yellow) and UG repeat stretches predicted to be bound by TDP-43 (red) is indicated. Note that alternative polyadenylation gives rise to isoforms with different numbers of predicted binding sites. Binding sites for 3′UTR qPCR primer sets used in (b) are also indicated. (b) Expression of 3′UTR isoforms for Sox5, Bcl11b, and Rorb was measured by qRT-PCR of prospective somatosensory area-enriched cortical lysates at P0 of controls (Ctrl), Pum2 cKO, and TDP43A315T. mRNA levels are shown as fold change to GAPDH mRNA. Data are shown as means ± standard error of the mean (SEM) for at least n = 4 of each genotype, two-tailed t-test. Pum2 cKO: Pum2fl/fl; Emx1Cre.
Figure 9—figure supplement 3.
Figure 9—figure supplement 3.. Pum2 represses Sox5 and Bcl11b mRNA translation in post-mitotic neurons.
(a) Representative polysome profiles from E14.5 neocortices are shown for controls (Ctrl), Pum2 cKO (top), and TDP43A315T (bottom). Quantification of polysome/monosome (P/M) ratio for n = 3 of each genotype is shown to the right of the corresponding representative profiles. (b) Histograms showing the distribution of the Sox5 and Bcl11b mRNAs at E13.5, and Sox5, Bcl11b, and Rorb mRNAs at E14.5 and E18.5 across polysome gradient fractions for Pum2 cKO relative to controls. E13.5 is the peak time of birth for layer V neurons when no layer IV Rorβ+ neurons are born yet. Values were normalized to an RLuc mRNA spike-in control, which was added in an equal amount to the fractions prior to RNA preparation. Data are represented as means ± standard error of the mean (SEM). **p≤0.01 by two-tailed t-test. (c) Coronal sections from controls and Pum2 cKO cortices at E13.5 stained for DAPI, or immunostained for Sox5, Bcl11b, or Tbr1 showing their expression only in the nascent neurons in the cortical plate (CP), but not in the ventricular zone (VZ) or subventricular zone progenitors. Error bars: 100 μm and 50 μm in high-magnification images. Pum2 cKO: Pum2fl/fl; Emx-Cre.
Figure 10.
Figure 10.. Pum2 and TDP-43 interact directly with mRNAs encoding key regulators of layer IV/V neuronal identity in developing neocortex.
(a, b) Single-molecule fluorescent in situ hybridization (smFISH) for Sox5, Bcl11b, and Rorb mRNAs coupled with immunofluorescence for Pum2 (a) or TDP-43 (b) on coronal sections from the prospective somatosensory area (pS) of WT mice. High-magnification views taken in layer V for Sox5 and Bcl11b or layer IV for Rorb are shown to the right. White arrows indicate examples of Sox5, Bcl11b, and Rorb mRNAs that overlap with Pum2 or TDP-43 protein immunofluorescence signal. Individual channels for a representative cell (delineated with dashed lines) are shown to the very right of each respective image. Scale bars: 25 μm. (c) UV Cross-linking immunoprecipitation (UV-CLIP) results from E18.5 cortices are shown. Dissociated cells were either cross-linked with UV light or left untreated as a control. Lysates were used for immunoprecipitations with antibodies against TDP-43 (top), Pum2 (bottom), or control nonspecific IgG (not shown). RNA in the input and immunoprecipitated (IP) eluate were analyzed by qRT-PCR for the indicated mRNAs. After verifying enrichment relative to IgG controls for UV-treated samples, histograms were generated that represent the fraction of input mRNA co-immunoprecipitated with either Pum2 or TDP-43 in the presence or absence of UV cross-linking. Statistically significant enrichment was evaluated relative to 18S rRNA, which is not known to interact significantly with either protein. Reduced signal in the absence of UV cross-linking implies an interaction is cross-linking-dependent, that is, direct. Data are represented as means ± standard error of the mean (SEM) from n = 3–6 samples. *p≤0.05, **p≤0.01 Mann–Whitney U test.
Figure 10—figure supplement 1.
Figure 10—figure supplement 1.. Pum2 and TDP-43 are expressed in progenitors and post-mitotic neurons in developing neocortex.
(a) Wild-type coronal sections from frontal motor (F/M) and prospective somatosensory (pS) areas at P0 immunostained for endogenous mouse Pum2 or TDP-43. White boxes indicate the selected cortical areas and high-magnification images of these areas showing expression and subcellular localization of indicated proteins as shown below. Note that every cell shows cytoplasmic signal for Pum2 and TDP-43, as well as additional nuclear signal for TDP-43. White and yellow arrowheads indicate examples of cytoplasmic and nuclear localization, respectively. respectively. (b) Wild-type C57BL/6J (WT) coronal sections from pS areas at E12.5 (top) and E13.5 (bottom) immunostained for endogenous mouse Pum2 (left) or TDP-43 (right). II–IV, V, VI: layers II–IV, V and VI; CP: cortical plate; VZ: ventricular zone. Scale bars: (a) 100 μm, 25 μm (inset) and (b) 50 μm.
Author response image 1.
Author response image 2.
Author response image 3.

Similar articles

Cited by

References

    1. Alfano C, Studer M. Neocortical arealization: evolution, mechanisms, and open questions. Developmental Neurobiology. 2013;73:411–447. doi: 10.1002/dneu.22067. - DOI - PubMed
    1. Arlotta P, Molyneaux BJ, Chen J, Inoue J, Kominami R, Macklis JD. Neuronal subtype-specific genes that control corticospinal motor neuron development in vivo. Neuron. 2005;45:207–221. doi: 10.1016/j.neuron.2004.12.036. - DOI - PubMed
    1. Armentano M, Chou S-J, Srubek Tomassy G, Leingärtner A, O’Leary DDM, Studer M. COUP-TFI regulates the balance of cortical patterning between frontal/motor and sensory areas. Nature Neuroscience. 2007;10:1277–1286. doi: 10.1038/nn1958. - DOI - PubMed
    1. Arnold ES, Ling SC, Huelga SC, Lagier-Tourenne C, Polymenidou M, Ditsworth D, Kordasiewicz HB, McAlonis-Downes M, Platoshyn O, Parone PA, Da Cruz S, Clutario KM, Swing D, Tessarollo L, Marsala M, Shaw CE, Yeo GW, Cleveland DW. ALS-linked TDP-43 mutations produce aberrant RNA splicing and adult-onset motor neuron disease without aggregation or loss of nuclear TDP-43. PNAS. 2013;110:E736–E745. doi: 10.1073/pnas.1222809110. - DOI - PMC - PubMed
    1. Ayala YM, De Conti L, Avendaño-Vázquez SE, Dhir A, Romano M, D’Ambrogio A, Tollervey J, Ule J, Baralle M, Buratti E, Baralle FE. TDP-43 regulates its mRNA levels through a negative feedback loop. The EMBO Journal. 2011;30:277–288. doi: 10.1038/emboj.2010.310. - DOI - PMC - PubMed

Publication types

MeSH terms