. 2022 Apr 4;221(4):e202106086.
doi: 10.1083/jcb.202106086. Epub 2022 Mar 9.

In situ cryo-electron tomography reveals local cellular machineries for axon branch development

Affiliations

In situ cryo-electron tomography reveals local cellular machineries for axon branch development

Hana Nedozralova et al. J Cell Biol. .

Abstract

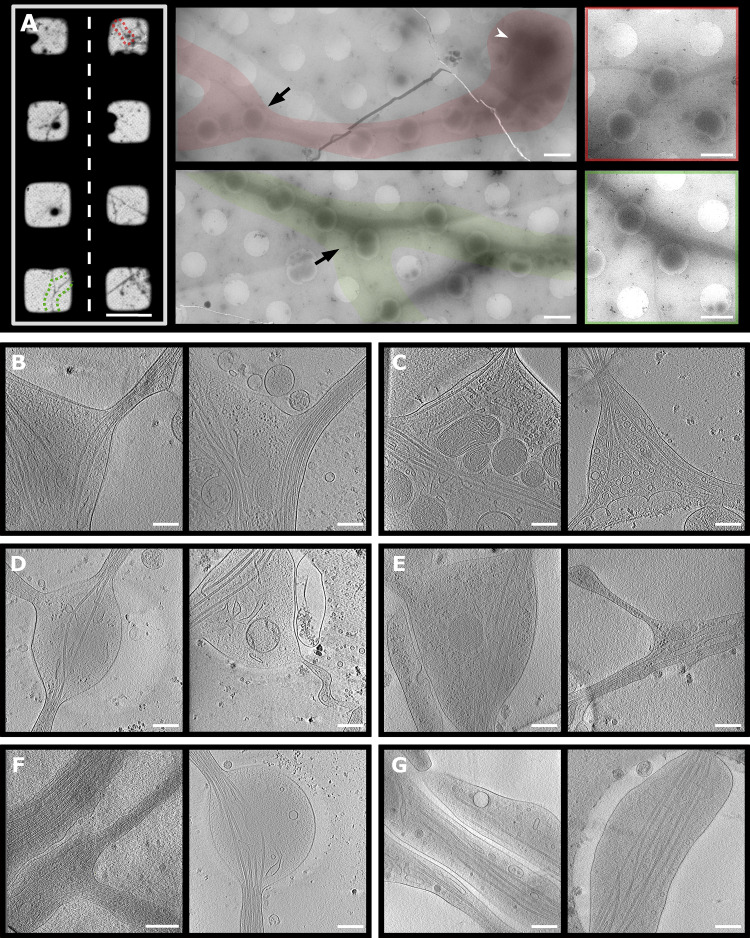
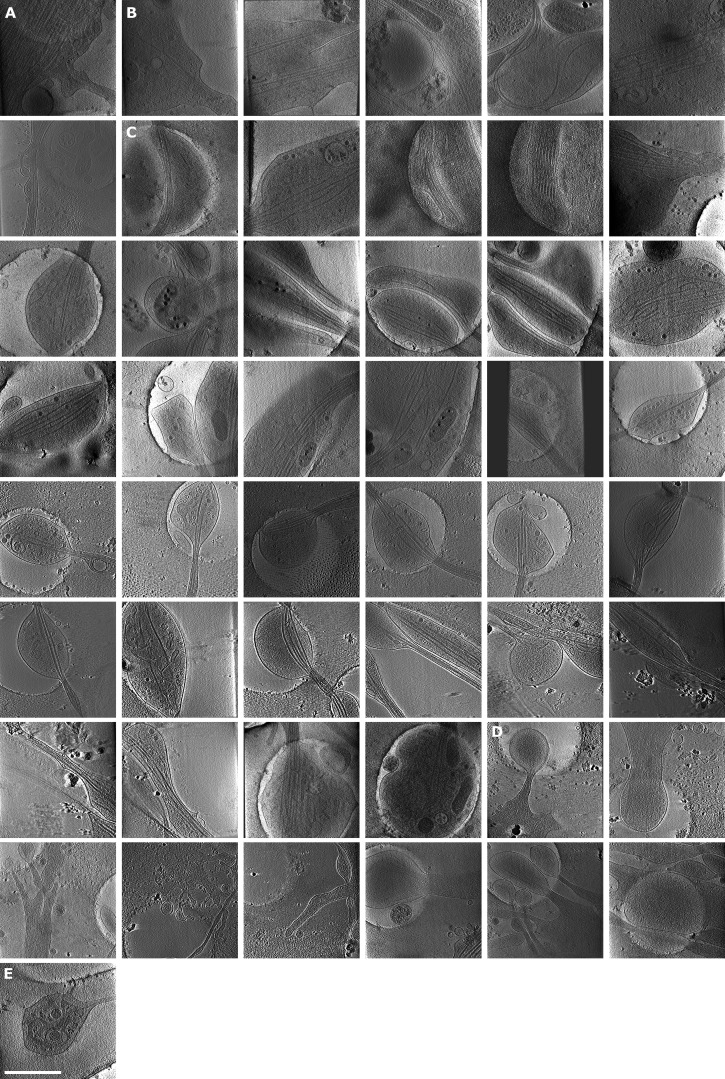
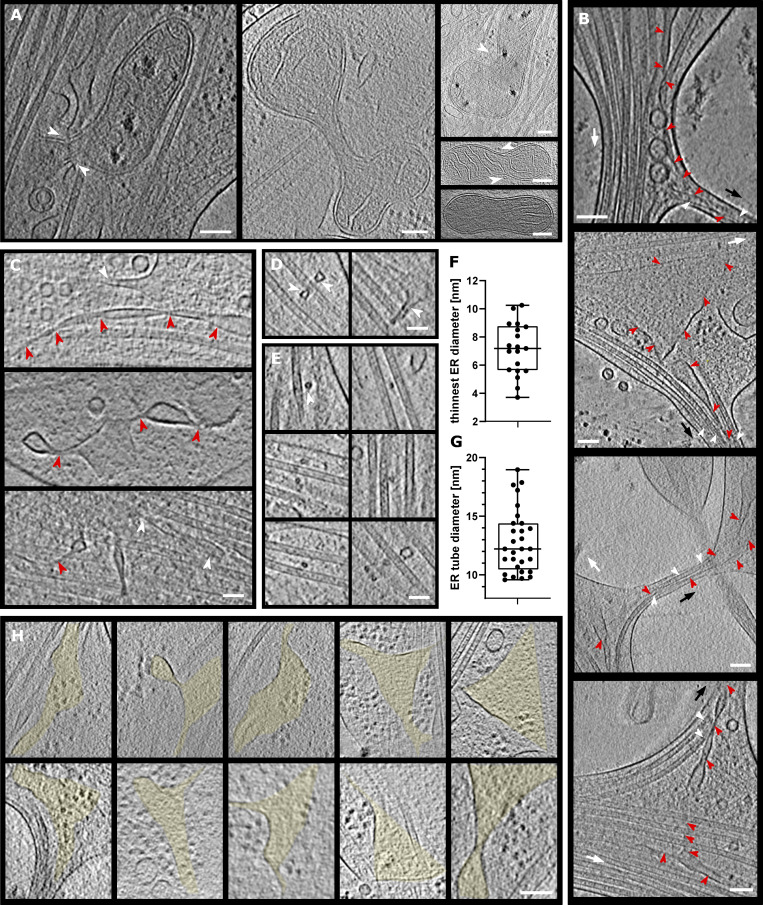
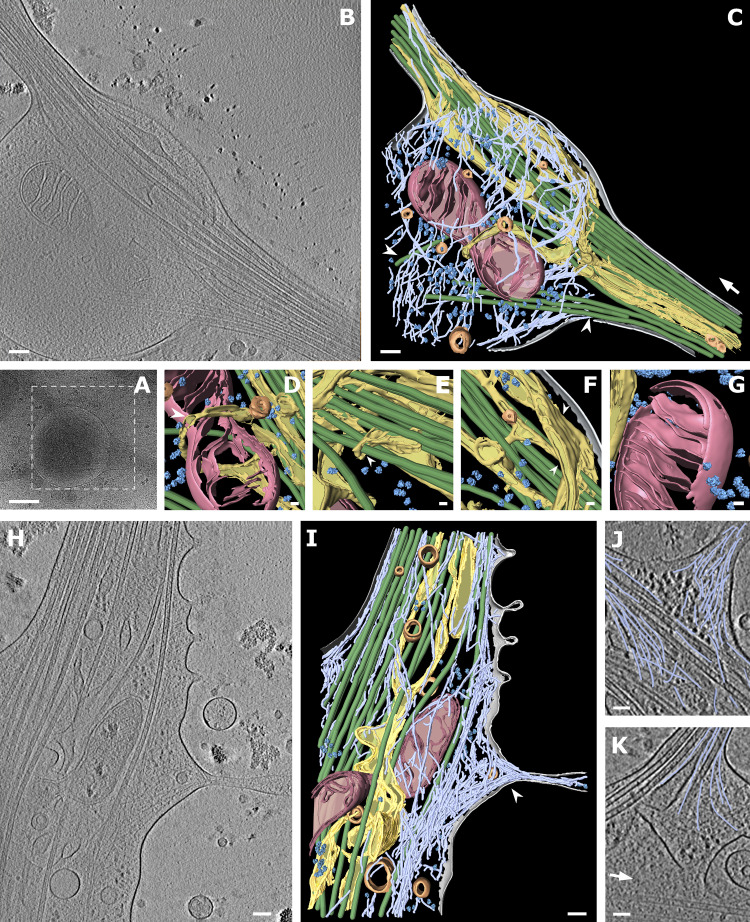
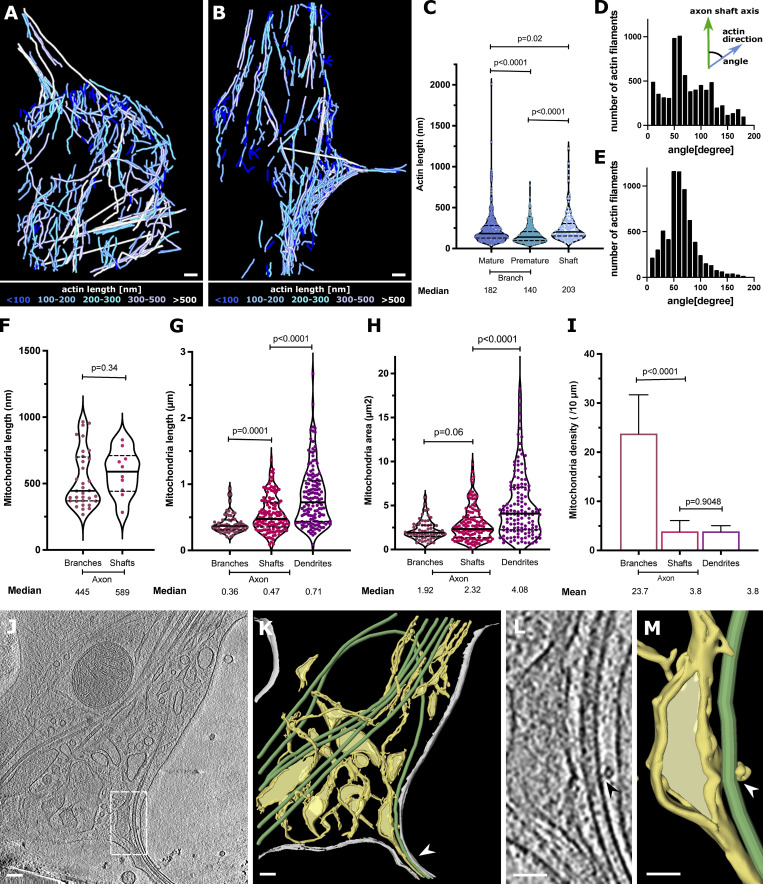
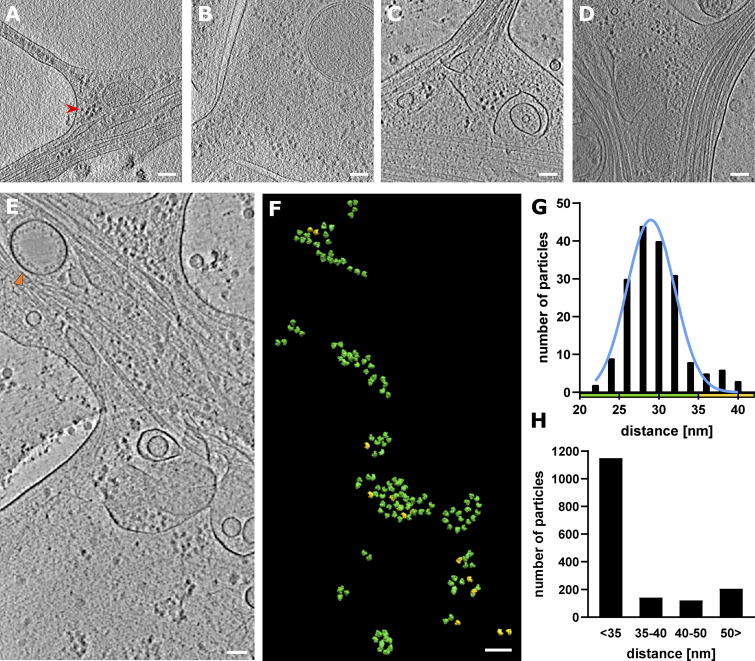
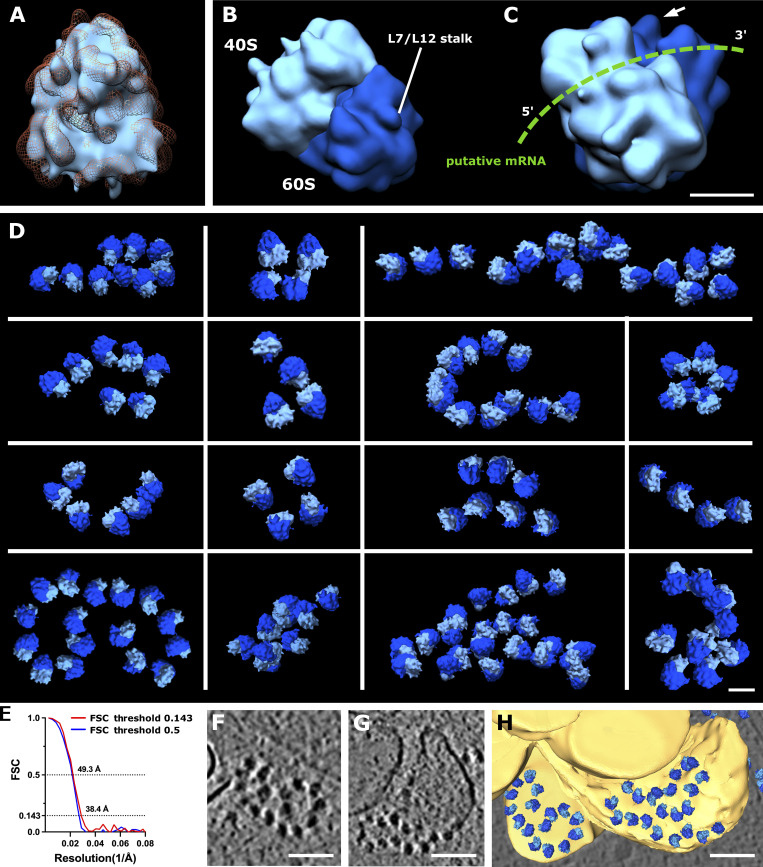
Neurons are highly polarized cells forming an intricate network of dendrites and axons. They are shaped by the dynamic reorganization of cytoskeleton components and cellular organelles. Axon branching allows the formation of new paths and increases circuit complexity. However, our understanding of branch formation is sparse due to the lack of direct in-depth observations. Using in situ cellular cryo-electron tomography on primary mouse neurons, we directly visualized the remodeling of organelles and cytoskeleton structures at axon branches. Strikingly, branched areas functioned as hotspots concentrating organelles to support dynamic activities. Unaligned actin filaments assembled at the base of premature branches accompanied by filopodia-like protrusions. Microtubules and ER comigrated into preformed branches to support outgrowth together with accumulating compact, ∼500-nm mitochondria and locally clustered ribosomes. We obtained a roadmap of events supporting the hypothesis of local protein synthesis selectively taking place at axon branches, allowing them to serve as unique control hubs for axon development and downstream neural network formation.


Figures

Figure 1.
Figure 1.
Targeted areas for data collection of axon branches and representative snapshots of cryo-ET. (A) Selection of areas for collection of tomograms. Left: Parts of cryo-EM map of grid with hippocampal neurons, selected area of interest in red and green. Middle: Low-magnification montages of areas depicted on grid map. Black arrow, branch region; white arrowhead, cell body. Right: Magnified area containing axon branch. (B–G) Slices from axon tomograms: mature branches from hippocampal (B) and thalamus (C) neurons; premature branches from hippocampal (D) and thalamus (E) neurons. Axon shafts from hippocampal (F) and thalamus (G) neurons. Scale bars: 100 µm (A left); 1.5 µm (A center and right); 250 nm (B–G).
Figure S1.
Figure S1.
Examples of mitochondria fission, ER entering branch, thin ER tubes, and ER-bound ribosomes. (A) Mitochondria undergoing fission. White arrowheads depict ER pinching at mitochondria membrane or wrapping around the mitochondria. (B) ER tube present in axon branch together with MTs. Red arrowheads, ER; white arrowheads, MTs; black arrow, direction of new branch; white arrow, direction of main axon growth. (C–G) Analysis of ER diameter. In C, ER tube reaching extremely thin diameters; red arrowheads follow continuous ER tubes, and white arrowheads depict different ER. In D–F, ER (white arrowheads) wrapping around MTs (D), cross-section of ER tube (white arrowhead) wrapping around MTs (E), and diameter of thinnest ER tubes found in tomograms (median diameter 7.19 nm, n = 19; F). (G) Diameter of ER tube wrapping around MT (median diameter 12.21 nm, n = 29). (H) Slices of tomograms with ribosomes on the surface of ER. The area of ER is highlighted in yellow. Scale bars: 100 nm (A, B, H); 50 nm (C–E).
Figure S2.
Figure S2.
Gallery of analyzed tomograms, part 1. Snapshots of tomograms not shown in main figures. (A–D) Mature branches from hippocampal neurons (A), mature branches from thalamus neurons (B), premature branches from hippocampus (C), and premature branches from thalamus (D). Area of tomograms, 2 × 2 µm. Scale bars: 1 µm.
Figure 2.
Figure 2.
Cryo-ET of mature and premature axon branches. (A) Low-magnification view of a mature axon branching site. White box depicts area of tomographic data collection shown in B. (B) Slice of the tomographic reconstruction of the branching site. (C) Segmentation of the 430-nm thick tomographic volume from B. Color code: gray, cellular membrane; green, MTs; light blue, actin; pink, mitochondria; yellow, ER; dark blue, ribosomes; orange, vesicles. White arrow shows the direction of bundled MTs following axon growth; white arrowheads depict MTs entering the branch. (D–G) Zoomed-in views of segmented volume: ER wrapping around mitochondrion (white arrowhead; D), ER wrapping around MTs (E), ER forming a flat sheet (white arrowhead; F), ribosomes in the vicinity of mitochondrion (G). (H) Slice from tomographic reconstruction of a premature branch. (I) 353-nm segmented volume of tomogram (H; same color code as in C); white arrowhead depicts filopodium filled with actin. (J) Actin arrangement in the filopodia of a premature branch. (K) Actin arrangement in a mature branch (traced actin in light blue; white arrow shows direction of main axon growth). Scale bars: 500 nm (A); 100 nm (B, C, H, and I); 25 nm (D–G); 50 nm (J and K).
Figure 3.
Figure 3.
Actin, mitochondria, and ER at axon branch. (A and B) Analysis of actin present in mature (A) and premature (B) branch from Fig. 2, colored according to filament length. (C) Distribution of actin lengths at mature and premature branches and axon shafts, shown as scatter plots with interquartile range (n = 325 mature, n = 414 premature, n = 148 shaft). (D and E) Distribution of actin orientations from A (D) and from B (E). (F) Mitochondria length in tomograms (n = 34 branch, n = 10 shaft). Length is defined as the longest longitudinal axis of a single mitochondrion. (G–I) Mitochondria analysis from live-cell imaging of neurons showing mitochondrial length (G), mitochondrial area as box-and-whiskers graphs (H), and mitochondrial density as bar graphs (I) with mean ± SD (n = 63 branch, n = 119 shaft, n = 104 dendrite; significance was tested using Mann–Whitney U test). (J) Slice from tomogram showing various types of ER (thin tubes and flat sheets). (K) Segmented tomogram of J; color code: gray, cell membrane; green, MTs; yellow, ER; white arrowhead shows ER in branch together with MTs. White squares depict areas in L and M. (L) ER–MT contact (black arrowhead). (M) Segmentation of ER tube wrapping around MT (white arrowhead). Scale bars: 100 nm (A, B, J, and K); 50 nm (L and M).
Figure 4.
Figure 4.
Ribosome clusters at axon branch. (A and B) Ribosomes at premature branch. Red arrowhead depicts an example of ribosome density. (C and D) Ribosomes at mature branch. (E–G) Analysis of distance between ribosomes. (E) Slice of analyzed tomogram (orange triangle shows vesicle with inner membrane densities). (F) Distribution of ribosomes in the 3D volume of tomogram in E, color code by distance between ribosome particle coordinates: green <35 nm, yellow >35 nm. (G) Distance distribution of ribosome particles in tomogram E. The graph shows particles with closest neighbor distance value <40 nm (n = 178). (H) Cumulative distance distribution for all analyzed ribosomes (n = 1,614).
Figure S3.
Figure S3.
Gallery of analyzed tomograms, part 2. (A–E) Snapshots of tomograms. Premature branches from thalamus neurons (A), hippocampal neuron shafts (B), shafts from thalamus (C), tips of growth cones from hippocampus (D), and growth cone, tip of thalamus (E). Area of tomograms, 2 × 2 µm. Scale bars: 1 µm.
Figure 5.
Figure 5.
Ribosome reconstruction and polysome orientation. (A) Reconstructed ribosome (light blue) fitted into the 80S ribosome volume from EMD-3420 (orange mesh). (B) Reconstructed ribosome volume with depicted 40S (light blue) and 60S (dark blue) subunits and L7/L12 stalk. (C) Rotated view of ribosome from B. Putative path of mRNA depicted in green; white arrow shows L7/L12 stalk. (D) Polysomes found in various tomograms. (E) Estimation of reconstructed ribosome resolution, FSC curve. (F and G) Slices from tomogram of ribosomes on the surface of ER. (H) Segmented view of F and G. Scale bars: 10 nm (A–C); 25 nm (D); 100 nm (F–H).

References

    1. Baas, P.W., Deitch J.S., Black M.M., and Banker G.A.. 1988. Polarity orientation of microtubules in hippocampal neurons: uniformity in the axon and nonuniformity in the dendrite. Proc. Natl. Acad. Sci. USA. 85:8335–8339. 10.1073/pnas.85.21.8335 - DOI - PMC - PubMed
    1. Baas, P.W., and Lin S.. 2011. Hooks and comets: the story of microtubule polarity orientation in the neuron. Dev. Neurobiol. 71:403–418. 10.1002/dneu.20818 - DOI - PMC - PubMed
    1. Baas, P.W., Rao A.N., Matamoros A.J., and Leo L.. 2016. Stability properties of neuronal microtubules. Cytoskeleton (Hoboken). 73:442–460. 10.1002/cm.21286 - DOI - PMC - PubMed
    1. Barnes, A.P., and Polleux F.. 2009. Establishment of axon-dendrite polarity in developing neurons. Annu. Rev. Neurosci. 32:347–381. 10.1146/annurev.neuro.31.060407.125536 - DOI - PMC - PubMed
    1. Basnet, N., Nedozralova H., Crevenna A.H., Bodakuntla S., Schlichthaerle T., Taschner M., Cardone G., Janke C., Jungmann R., Magiera M.M., Biertümpfel C., et al. 2018. Direct induction of microtubule branching by microtubule nucleation factor SSNA1. Nat. Cell Biol. 20:1172–1180. 10.1038/s41556-018-0199-8 - DOI - PMC - PubMed

Publication types