Multicenter Study
. 2022 May 1;79(5):464-474.
doi: 10.1001/jamapsychiatry.2022.0020.

Characterizing Heterogeneity in Neuroimaging, Cognition, Clinical Symptoms, and Genetics Among Patients With Late-Life Depression

Collaborators, Affiliations
Multicenter Study

Characterizing Heterogeneity in Neuroimaging, Cognition, Clinical Symptoms, and Genetics Among Patients With Late-Life Depression

Junhao Wen et al. JAMA Psychiatry. .

Abstract

Importance: Late-life depression (LLD) is characterized by considerable heterogeneity in clinical manifestation. Unraveling such heterogeneity might aid in elucidating etiological mechanisms and support precision and individualized medicine.

Objective: To cross-sectionally and longitudinally delineate disease-related heterogeneity in LLD associated with neuroanatomy, cognitive functioning, clinical symptoms, and genetic profiles.

Design, setting, and participants: The Imaging-Based Coordinate System for Aging and Neurodegenerative Diseases (iSTAGING) study is an international multicenter consortium investigating brain aging in pooled and harmonized data from 13 studies with more than 35 000 participants, including a subset of individuals with major depressive disorder. Multimodal data from a multicenter sample (N = 996), including neuroimaging, neurocognitive assessments, and genetics, were analyzed in this study. A semisupervised clustering method (heterogeneity through discriminative analysis) was applied to regional gray matter (GM) brain volumes to derive dimensional representations. Data were collected from July 2017 to July 2020 and analyzed from July 2020 to December 2021.

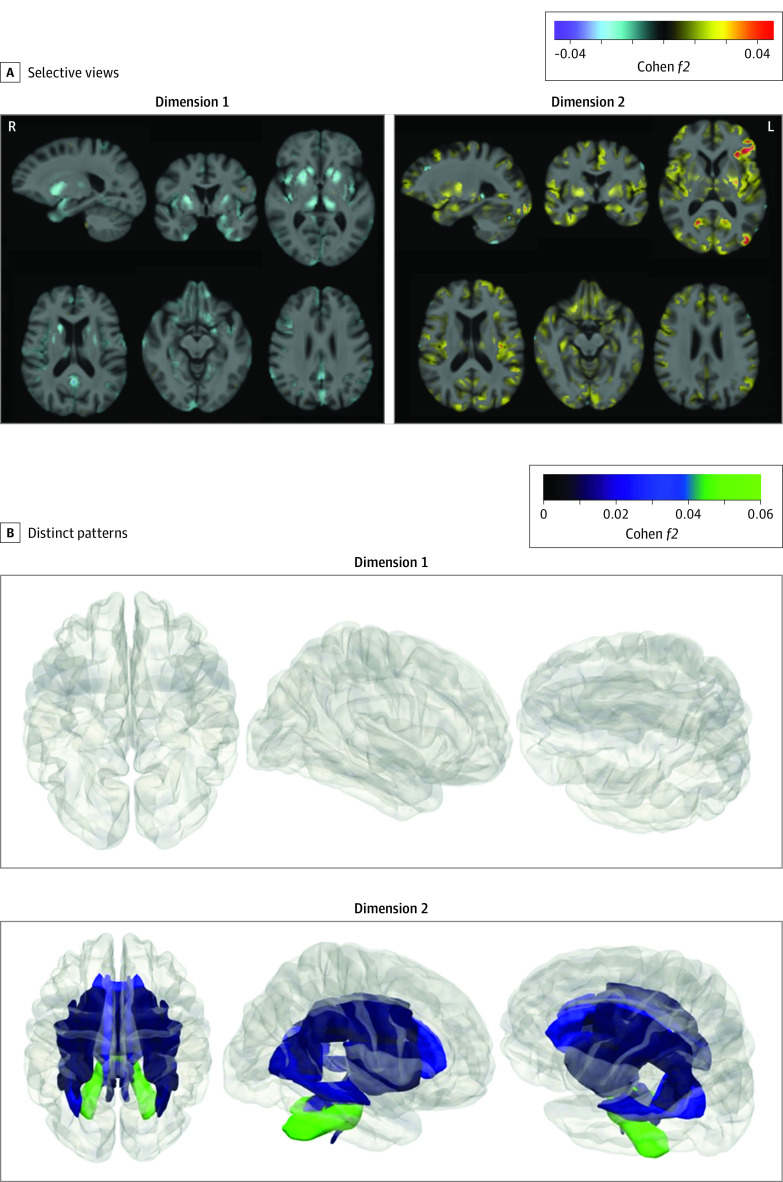
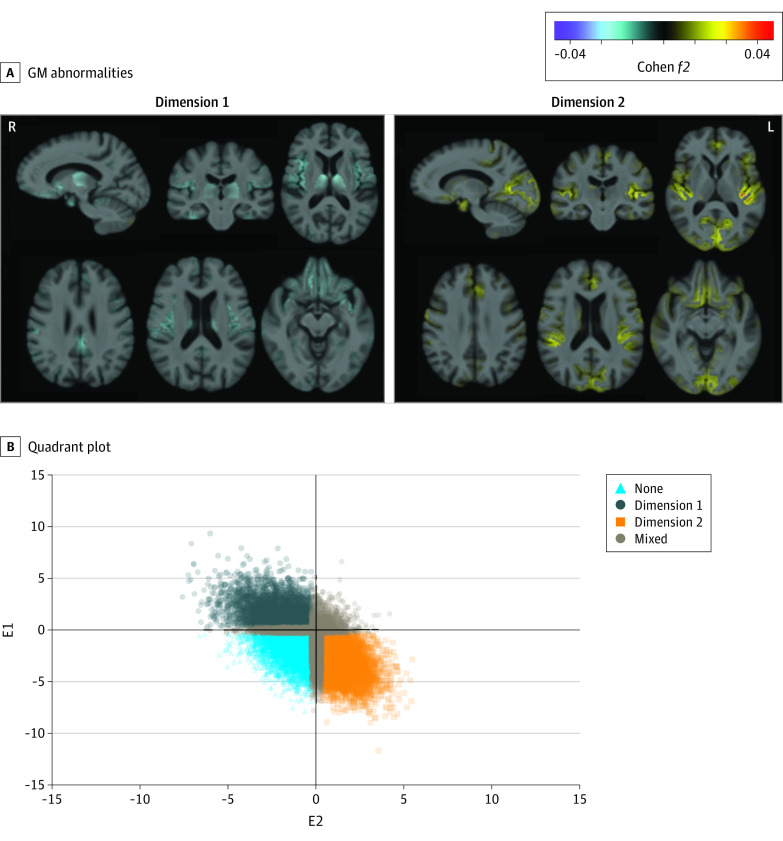
Main outcomes and measures: Two dimensions were identified to delineate LLD-associated heterogeneity in voxelwise GM maps, white matter (WM) fractional anisotropy, neurocognitive functioning, clinical phenotype, and genetics.

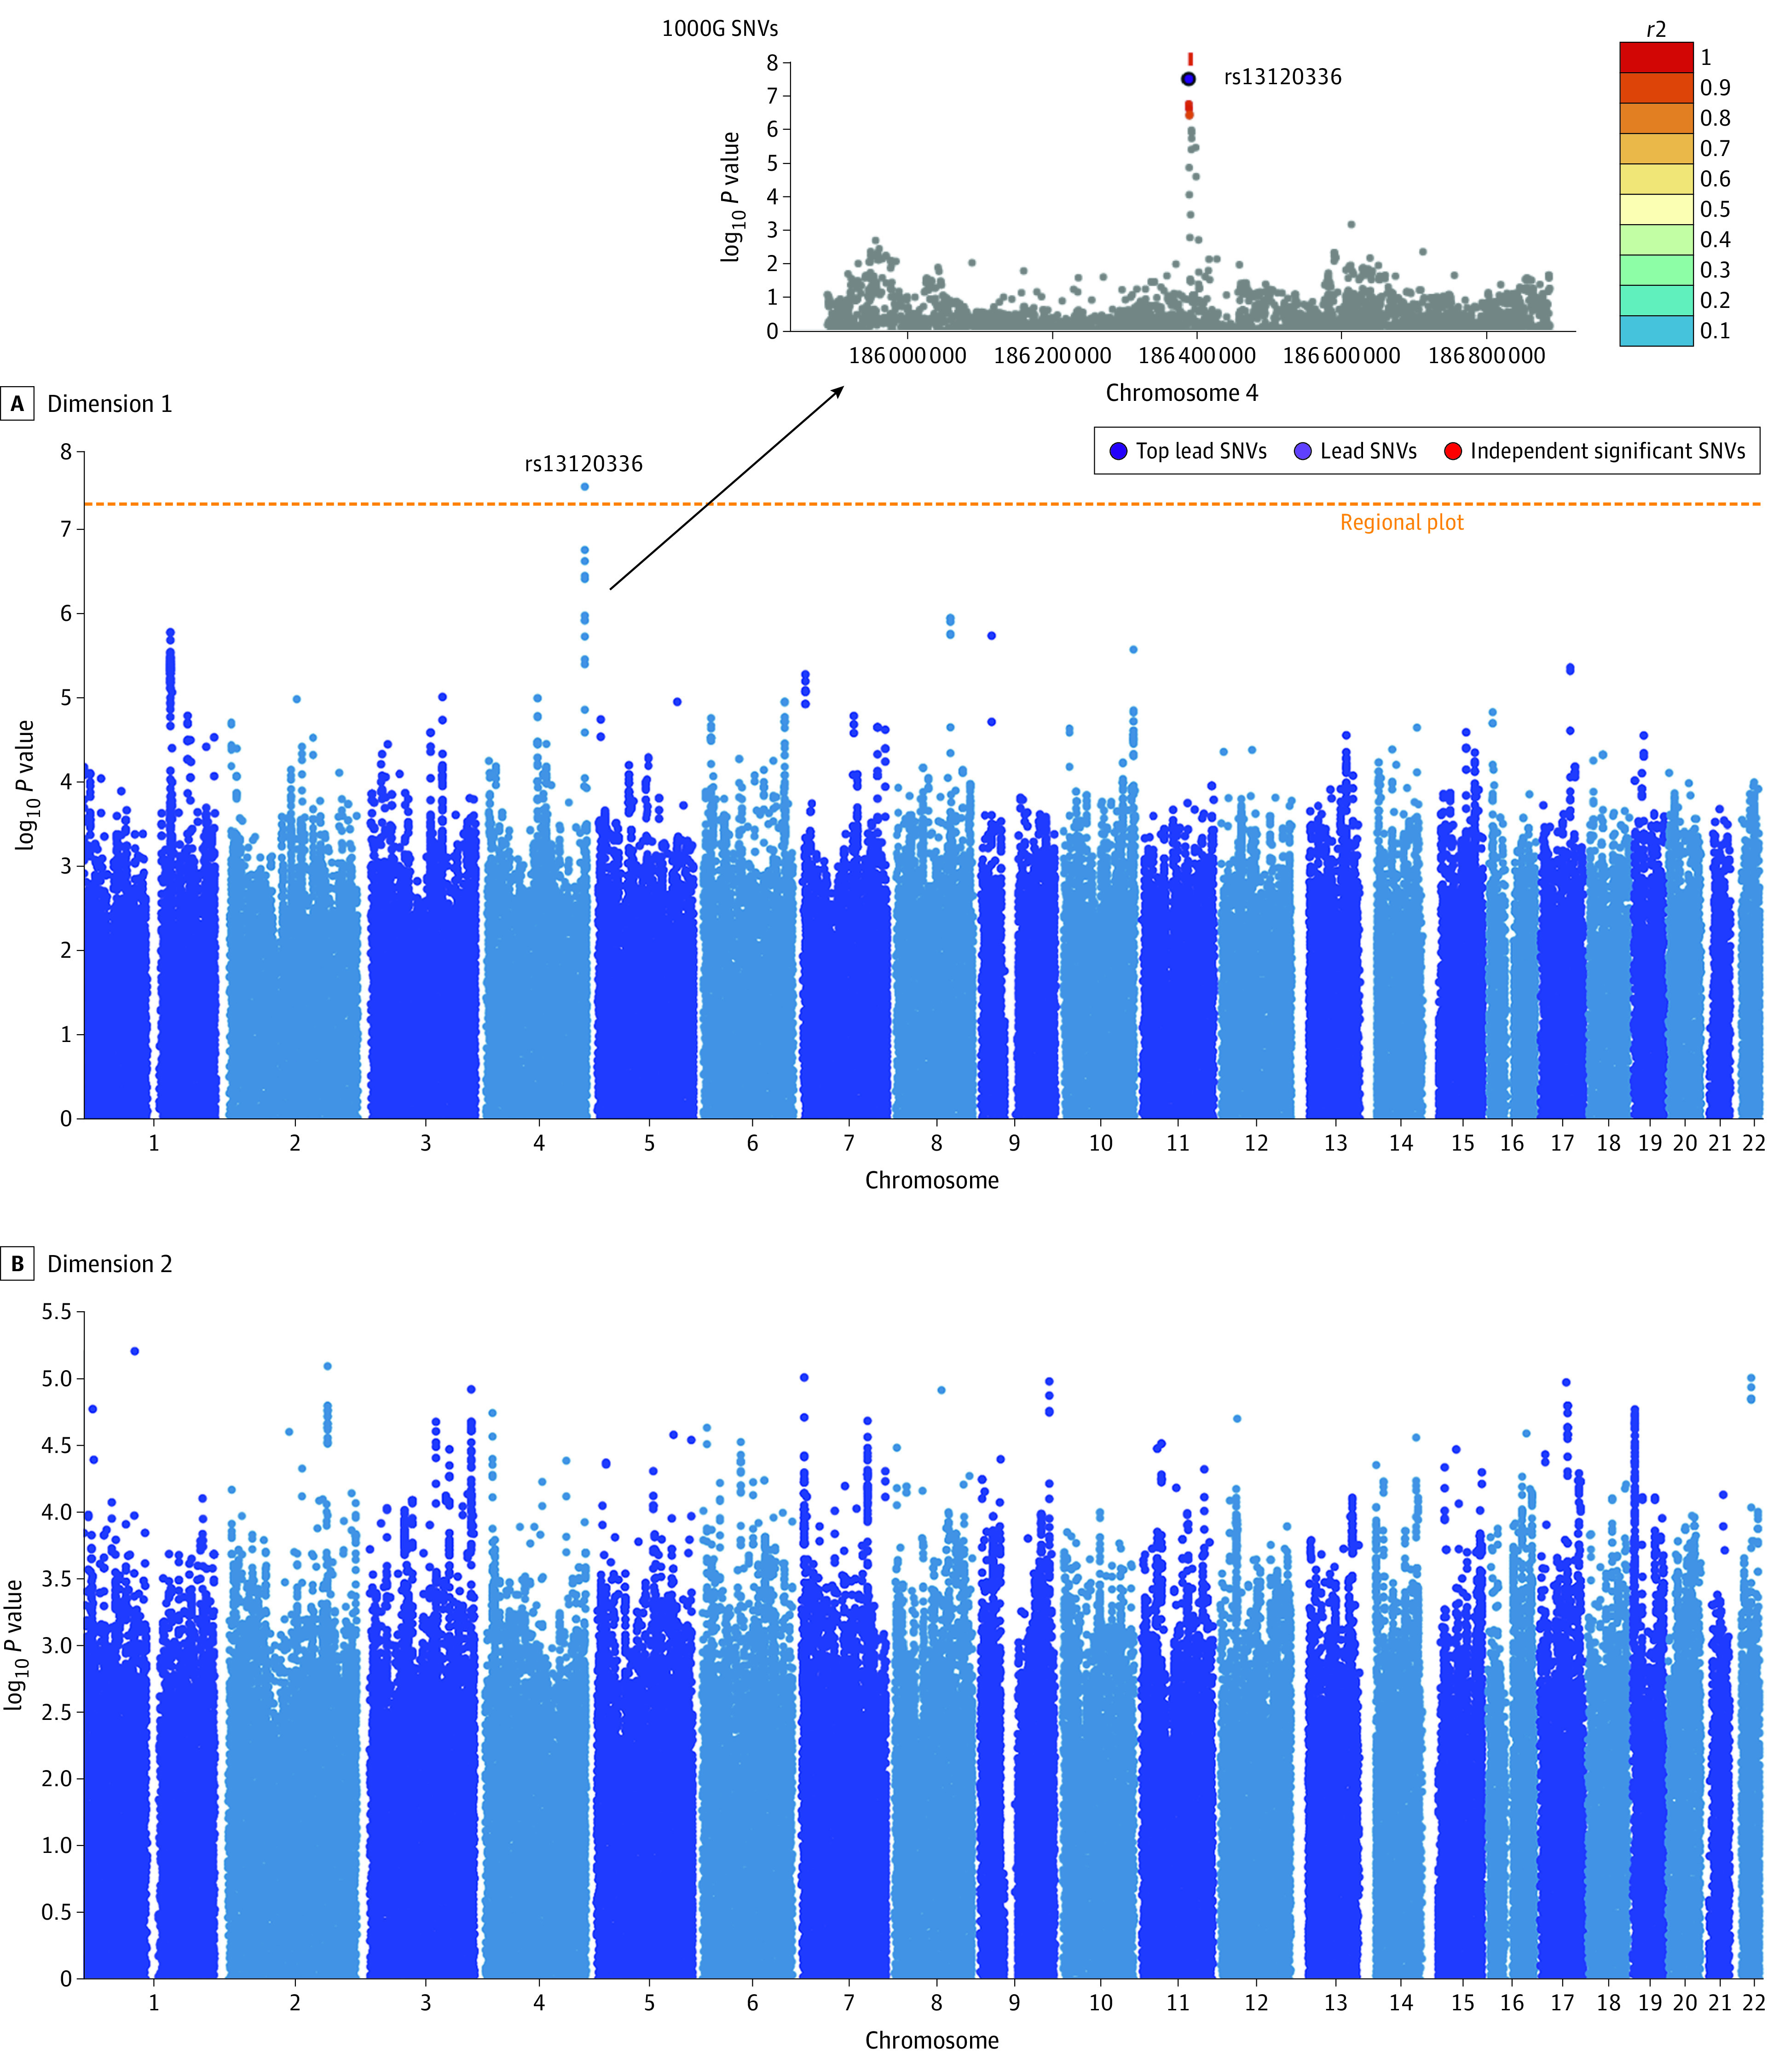
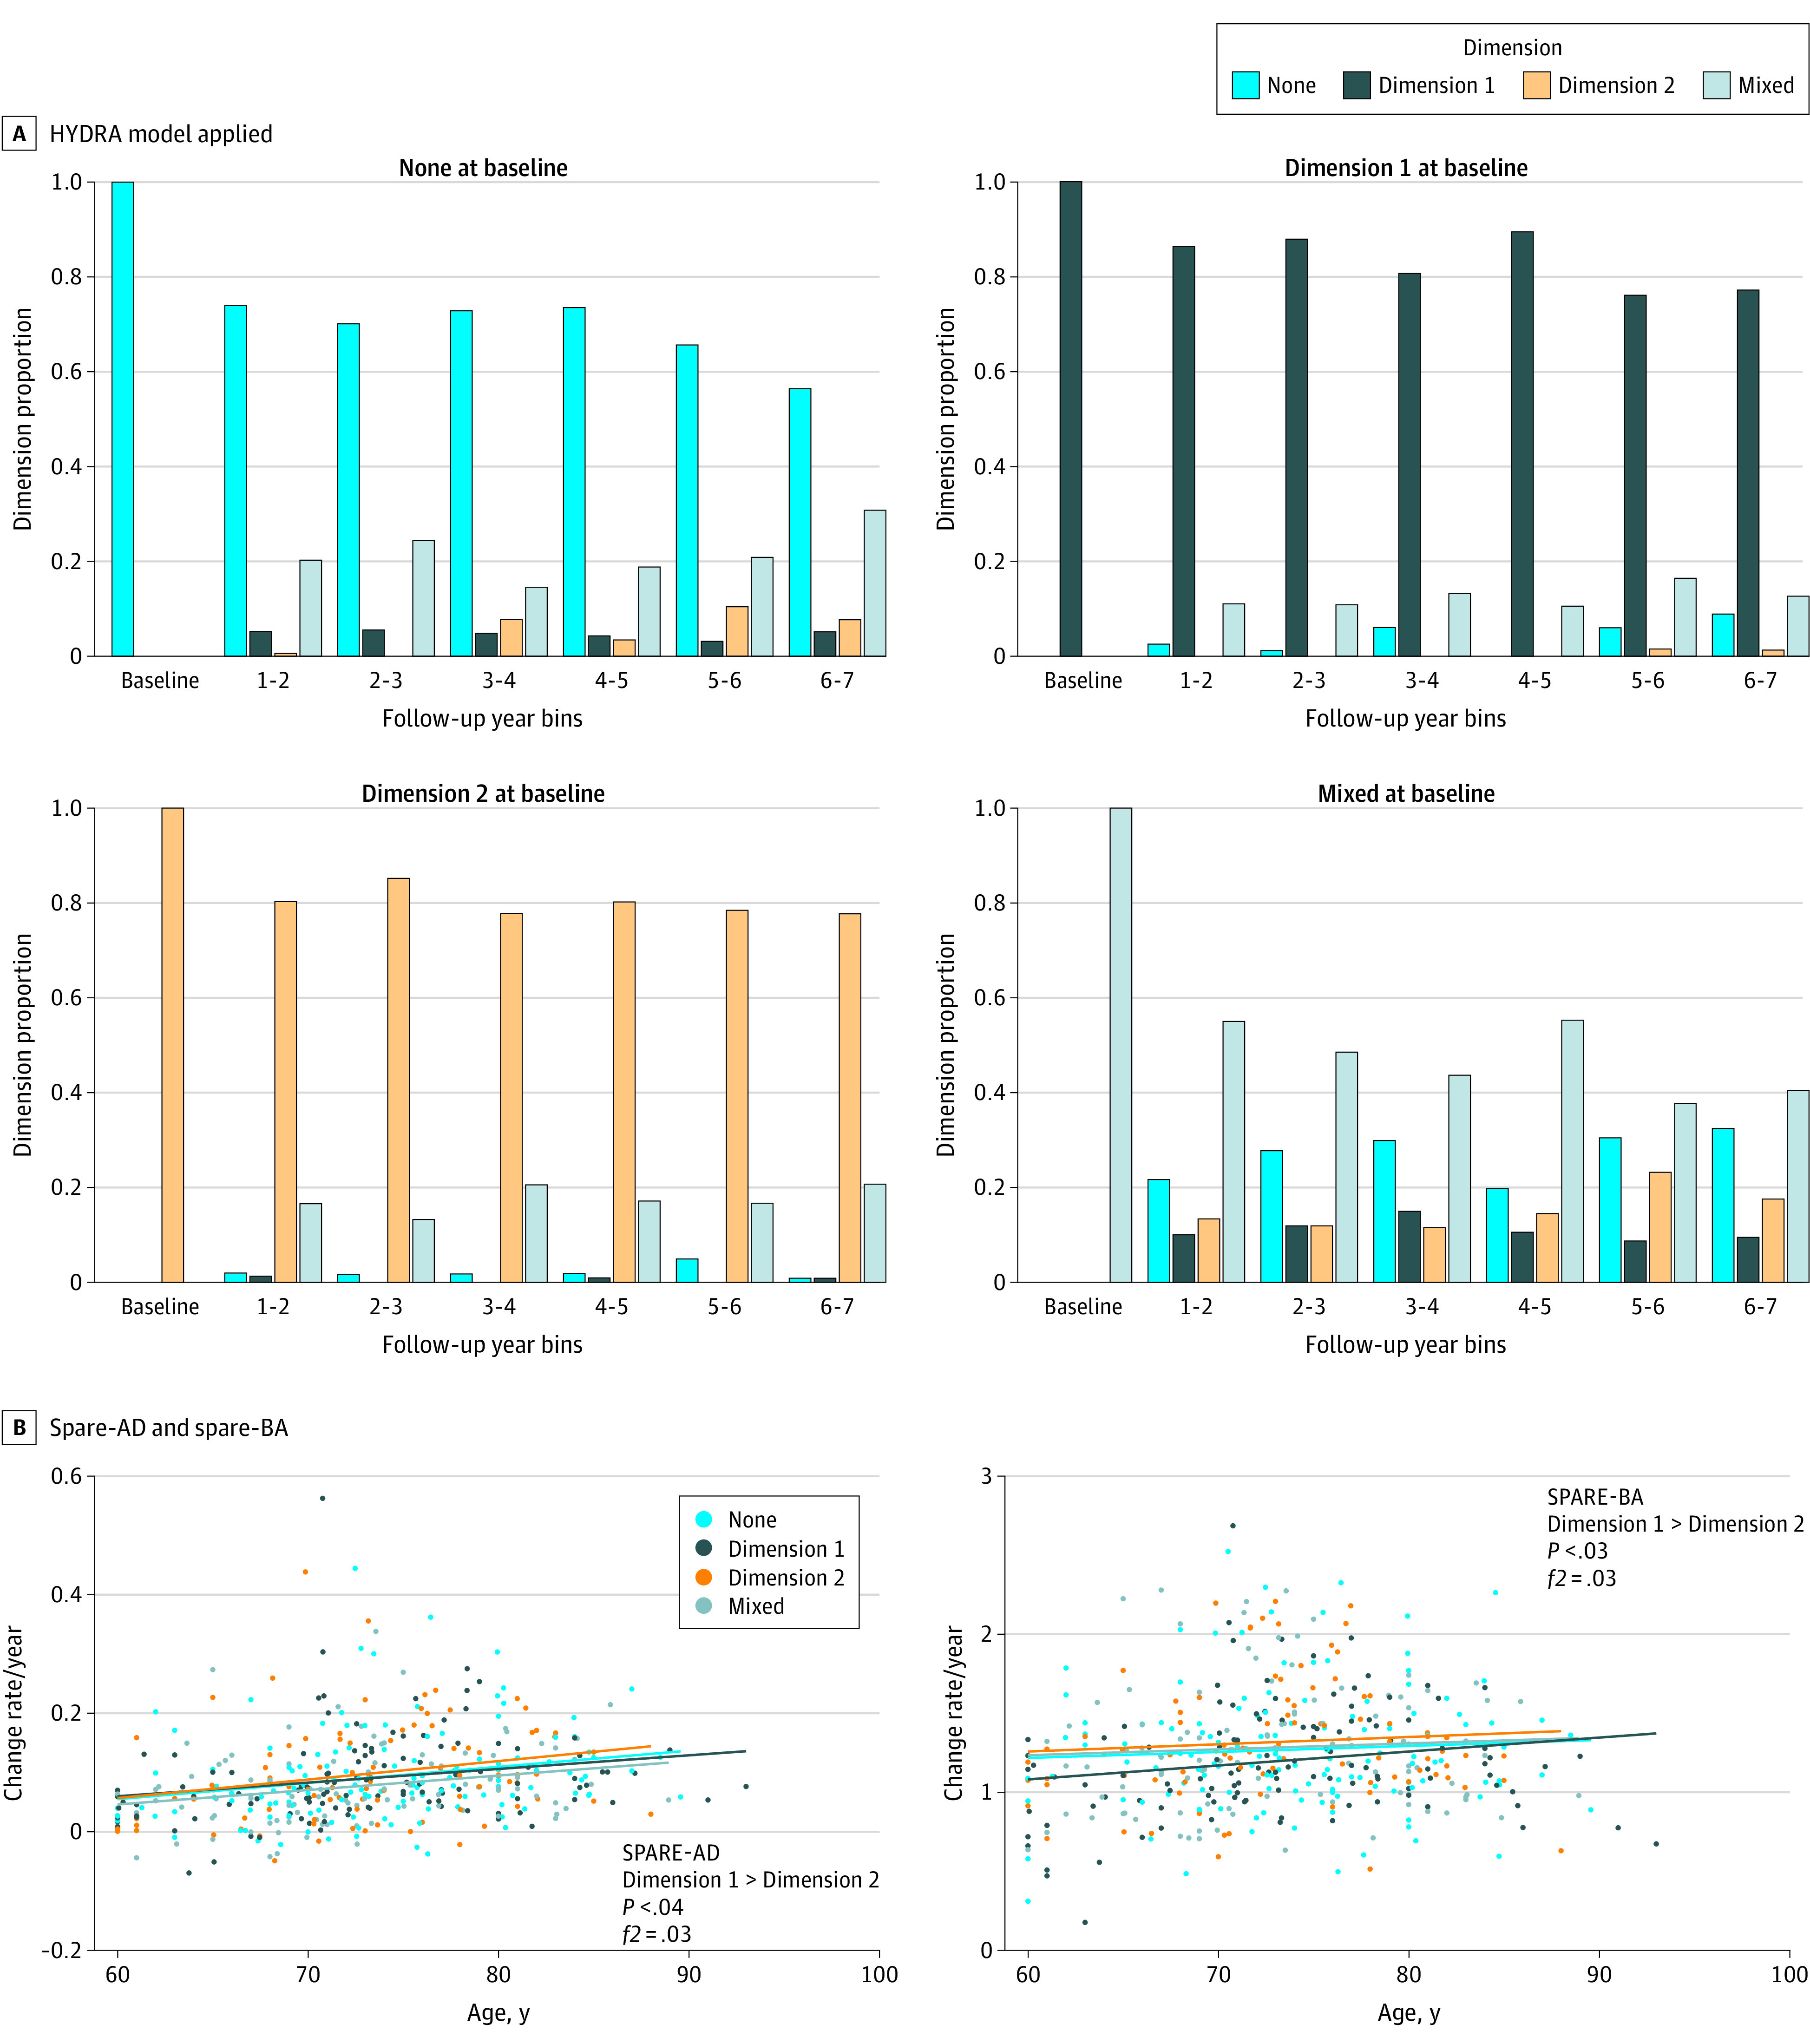
Results: A total of 501 participants with LLD (mean [SD] age, 67.39 [5.56] years; 332 women) and 495 healthy control individuals (mean [SD] age, 66.53 [5.16] years; 333 women) were included. Patients in dimension 1 demonstrated relatively preserved brain anatomy without WM disruptions relative to healthy control individuals. In contrast, patients in dimension 2 showed widespread brain atrophy and WM integrity disruptions, along with cognitive impairment and higher depression severity. Moreover, 1 de novo independent genetic variant (rs13120336; chromosome: 4, 186387714; minor allele, G) was significantly associated with dimension 1 (odds ratio, 2.35; SE, 0.15; P = 3.14 ×10⁸) but not with dimension 2. The 2 dimensions demonstrated significant single-nucleotide variant-based heritability of 18% to 27% within the general population (N = 12 518 in UK Biobank). In a subset of individuals having longitudinal measurements, those in dimension 2 experienced a more rapid longitudinal change in GM and brain age (Cohen f2 = 0.03; P = .02) and were more likely to progress to Alzheimer disease (Cohen f2 = 0.03; P = .03) compared with those in dimension 1 (N = 1431 participants and 7224 scans from the Alzheimer's Disease Neuroimaging Initiative [ADNI], Baltimore Longitudinal Study of Aging [BLSA], and Biomarkers for Older Controls at Risk for Dementia [BIOCARD] data sets).

Conclusions and relevance: This study characterized heterogeneity in LLD into 2 dimensions with distinct neuroanatomical, cognitive, clinical, and genetic profiles. This dimensional approach provides a potential mechanism for investigating the heterogeneity of LLD and the relevance of the latent dimensions to possible disease mechanisms, clinical outcomes, and responses to interventions.


Conflict of interest statement

Conflict of Interest Disclosures: Dr Mackin reported grants from the National Institutes of Health during the conduct of the study and outside the submitted work and support from Johnson and Johnson outside the submitted work. Dr Sotiras reported support from TheraPanacea Equity outside the submitted work. Dr Saykin reported grants from the National Institutes of Health paid to Indiana University during the conduct of the study. Dr Saykin receives support from multiple National Institutes of Health grants, has received support from Avid Radiopharmaceuticals, a subsidiary of Eli Lilly (in kind contribution of PET tracer precursor); Bayer Oncology (scientific advisory board); Siemens Medical Solutions (dementia advisory board); Springer-Nature Publishing (editorial office support as Editor-in-Chief, Brain Imaging and Behavior). Dr Wolk served as site principle investigator for studies by Biogen, Merck, and Eli Lilly/Avid; has received consulting fees from General Electric Healthcare and Neuronix; is on the DSMB for a trial sponsored by Functional Neuromodulation; and has consulted for Qynapse. Dr Albert reported grants from the National Institute on Aging during the conduct of the study and other support from Eli Lilly Consultant outside the submitted work. No other disclosures were reported.

Figures

Figure 1.
Figure 1.. Distinct Structural Patterns in Dimensions 1 and 2
Effect size maps were identified in dimension 1 and dimension 2 compared with control individuals, respectively. A, Warmer color denotes brain atrophy (ie, control > dimension), and cooler color represents larger tissue volume (ie, dimension > control). Both directions are shown for each dimension. L indicates left; R, right. The effect size map is shown in a radiological fashion such that the left of the brain is shown to the right of the display. B, Dimensions 1 and 2 demonstrated 2 distinct white matter (WM) patterns based on fractional anisotropy values. Patients in dimension 1 exhibited a normal appearance without significant difference from control individuals, whereas those in dimension 2 showed widespread disruptions in WM integrity. The P value and effect size for all 48 WM tracts are shown in eTable 4 in Supplement 1. Both directions of the comparisons were performed, but effect sizes only show WM integrity disruptions. For reference, Cohen f2 values of ≥0.02, ≥0.15, and ≥0.35 signify small, moderate, and large effect sizes, respectively. We do not claim that voxel-based differences provide validation of clustering. We simply show these comparisons to elucidate the characteristics of the dimensions determined by the machine learning algorithm so that we can appreciate the features that were found by the algorithm to be essential for the definition of these dimensions.
Figure 2.
Figure 2.. Distinct Genetic Profiles in the Genome-Wide Association Study (GWAS) Between Dimensions 1 and 2
A, Dimension 1 was significantly associated with a novel genomic risk locus. This significant independent single-nucleotide variant (SNV) (rs13120336) is in linkage disequilibrium with other 7-candidate SNVs that passed the GWAS P value threshold (5e-8). Functional Mapping and Annotation identified 2 corresponding protein-encoding genes: CCDC110 and LOC105377590. B, Dimension 2 was not significantly associated with any variants.
Figure 3.
Figure 3.. Expression of the 2 Dimensions in the General Population
A, The 2 neuroanatomical dimensions in UK Biobank (UKBB) show distinct gray matter (GM) abnormalities. Effect size maps of GM patterns were identified in dimension 1 and dimension 2 compared with none (the dimension that does not express in dimension 1 or 2), respectively. Multiple selective views are shown with the number of slices in the axial view. Warmer color denotes brain atrophy (ie, none > dimension), and cooler color represents larger tissue volume (ie, dimension > none). Both directions are shown for each dimension. Cohen f2 of ≥0.02, ≥0.15, and ≥0.35 signify small, moderate, and large effect sizes, respectively. L indicates left; R, right. The effect size map is shown in a radiological fashion such that the left of the brain is shown to the right of the display. We include age, sex, and intracranial volume as fixed effects and group (none vs dimension 1 or dimension 2) as the variable of interest. The likelihood ratio test was used to test each effect. B, The quadrant plot after applying the heterogeneity through discriminative analysis model trained on the late-life depression population to the external UKBB individuals. The x-axis and y-axis represent the expression scores for each individual at dimension 1 and dimension 2, respectively. Dimension membership was decided based on the 2 expression scores, E1 and E2. Specifically, an individual was assigned to none when E1 and E2 were less than −0.3, as dimension 1 when E1 was less than 0.3 and E2 less than −0.3, as dimension 2 when E1 was less than−0.3 and E2 greater than 0.3, and as mixed for the other individuals.
Figure 4.
Figure 4.. The 2 Dimensions and Longitudinal Trajectories to Aging and Alzheimer Disease
A, Applying the heterogeneity through discriminative analysis (HYDRA) model to all available longitudinal scans with at least 6 years of follow-up. The 2 dimensions remained stable over time and were independent of each other. B, The positive rate of change for spatial patterns of atrophy for recognition of Alzheimer disease (SPARE-AD), and the spatial patterns of atrophy for recognition of brain atrophy (SPARE-BA) of dimension 2 was bigger than dimension 1, meaning that patients in dimension 2 were more vulnerable to Alzheimer disease and brain aging longitudinally. Only individuals that had at least 6 time points were included for this analysis.

References

    1. Belmaker RH, Agam G. Major depressive disorder. N Engl J Med. 2008;358(1):55-68. doi:10.1056/NEJMra073096 - DOI - PubMed
    1. Thornicroft G, Chatterji S, Evans-Lacko S, et al. . Undertreatment of people with major depressive disorder in 21 countries. Br J Psychiatry. 2017;210(2):119-124. doi:10.1192/bjp.bp.116.188078 - DOI - PMC - PubMed
    1. Beekman AT, Copeland JR, Prince MJ. Review of community prevalence of depression in later life. Br J Psychiatry. 1999;174:307-311. doi:10.1192/bjp.174.4.307 - DOI - PubMed
    1. Luppa M, Sikorski C, Luck T, et al. . Age- and gender-specific prevalence of depression in latest-life—systematic review and meta-analysis. J Affect Disord. 2012;136(3):212-221. doi:10.1016/j.jad.2010.11.033 - DOI - PubMed
    1. Alexopoulos GS. Mechanisms and treatment of late-life depression. Transl Psychiatry. 2019;9(1):188. doi:10.1038/s41398-019-0514-6 - DOI - PMC - PubMed

Publication types