. 2022 May 13;28(10):2094-2109.
doi: 10.1158/1078-0432.CCR-21-3570.

Immunostimulatory Cancer-Associated Fibroblast Subpopulations Can Predict Immunotherapy Response in Head and Neck Cancer

Affiliations

Immunostimulatory Cancer-Associated Fibroblast Subpopulations Can Predict Immunotherapy Response in Head and Neck Cancer

Aleksandar Obradovic et al. Clin Cancer Res. .

Abstract

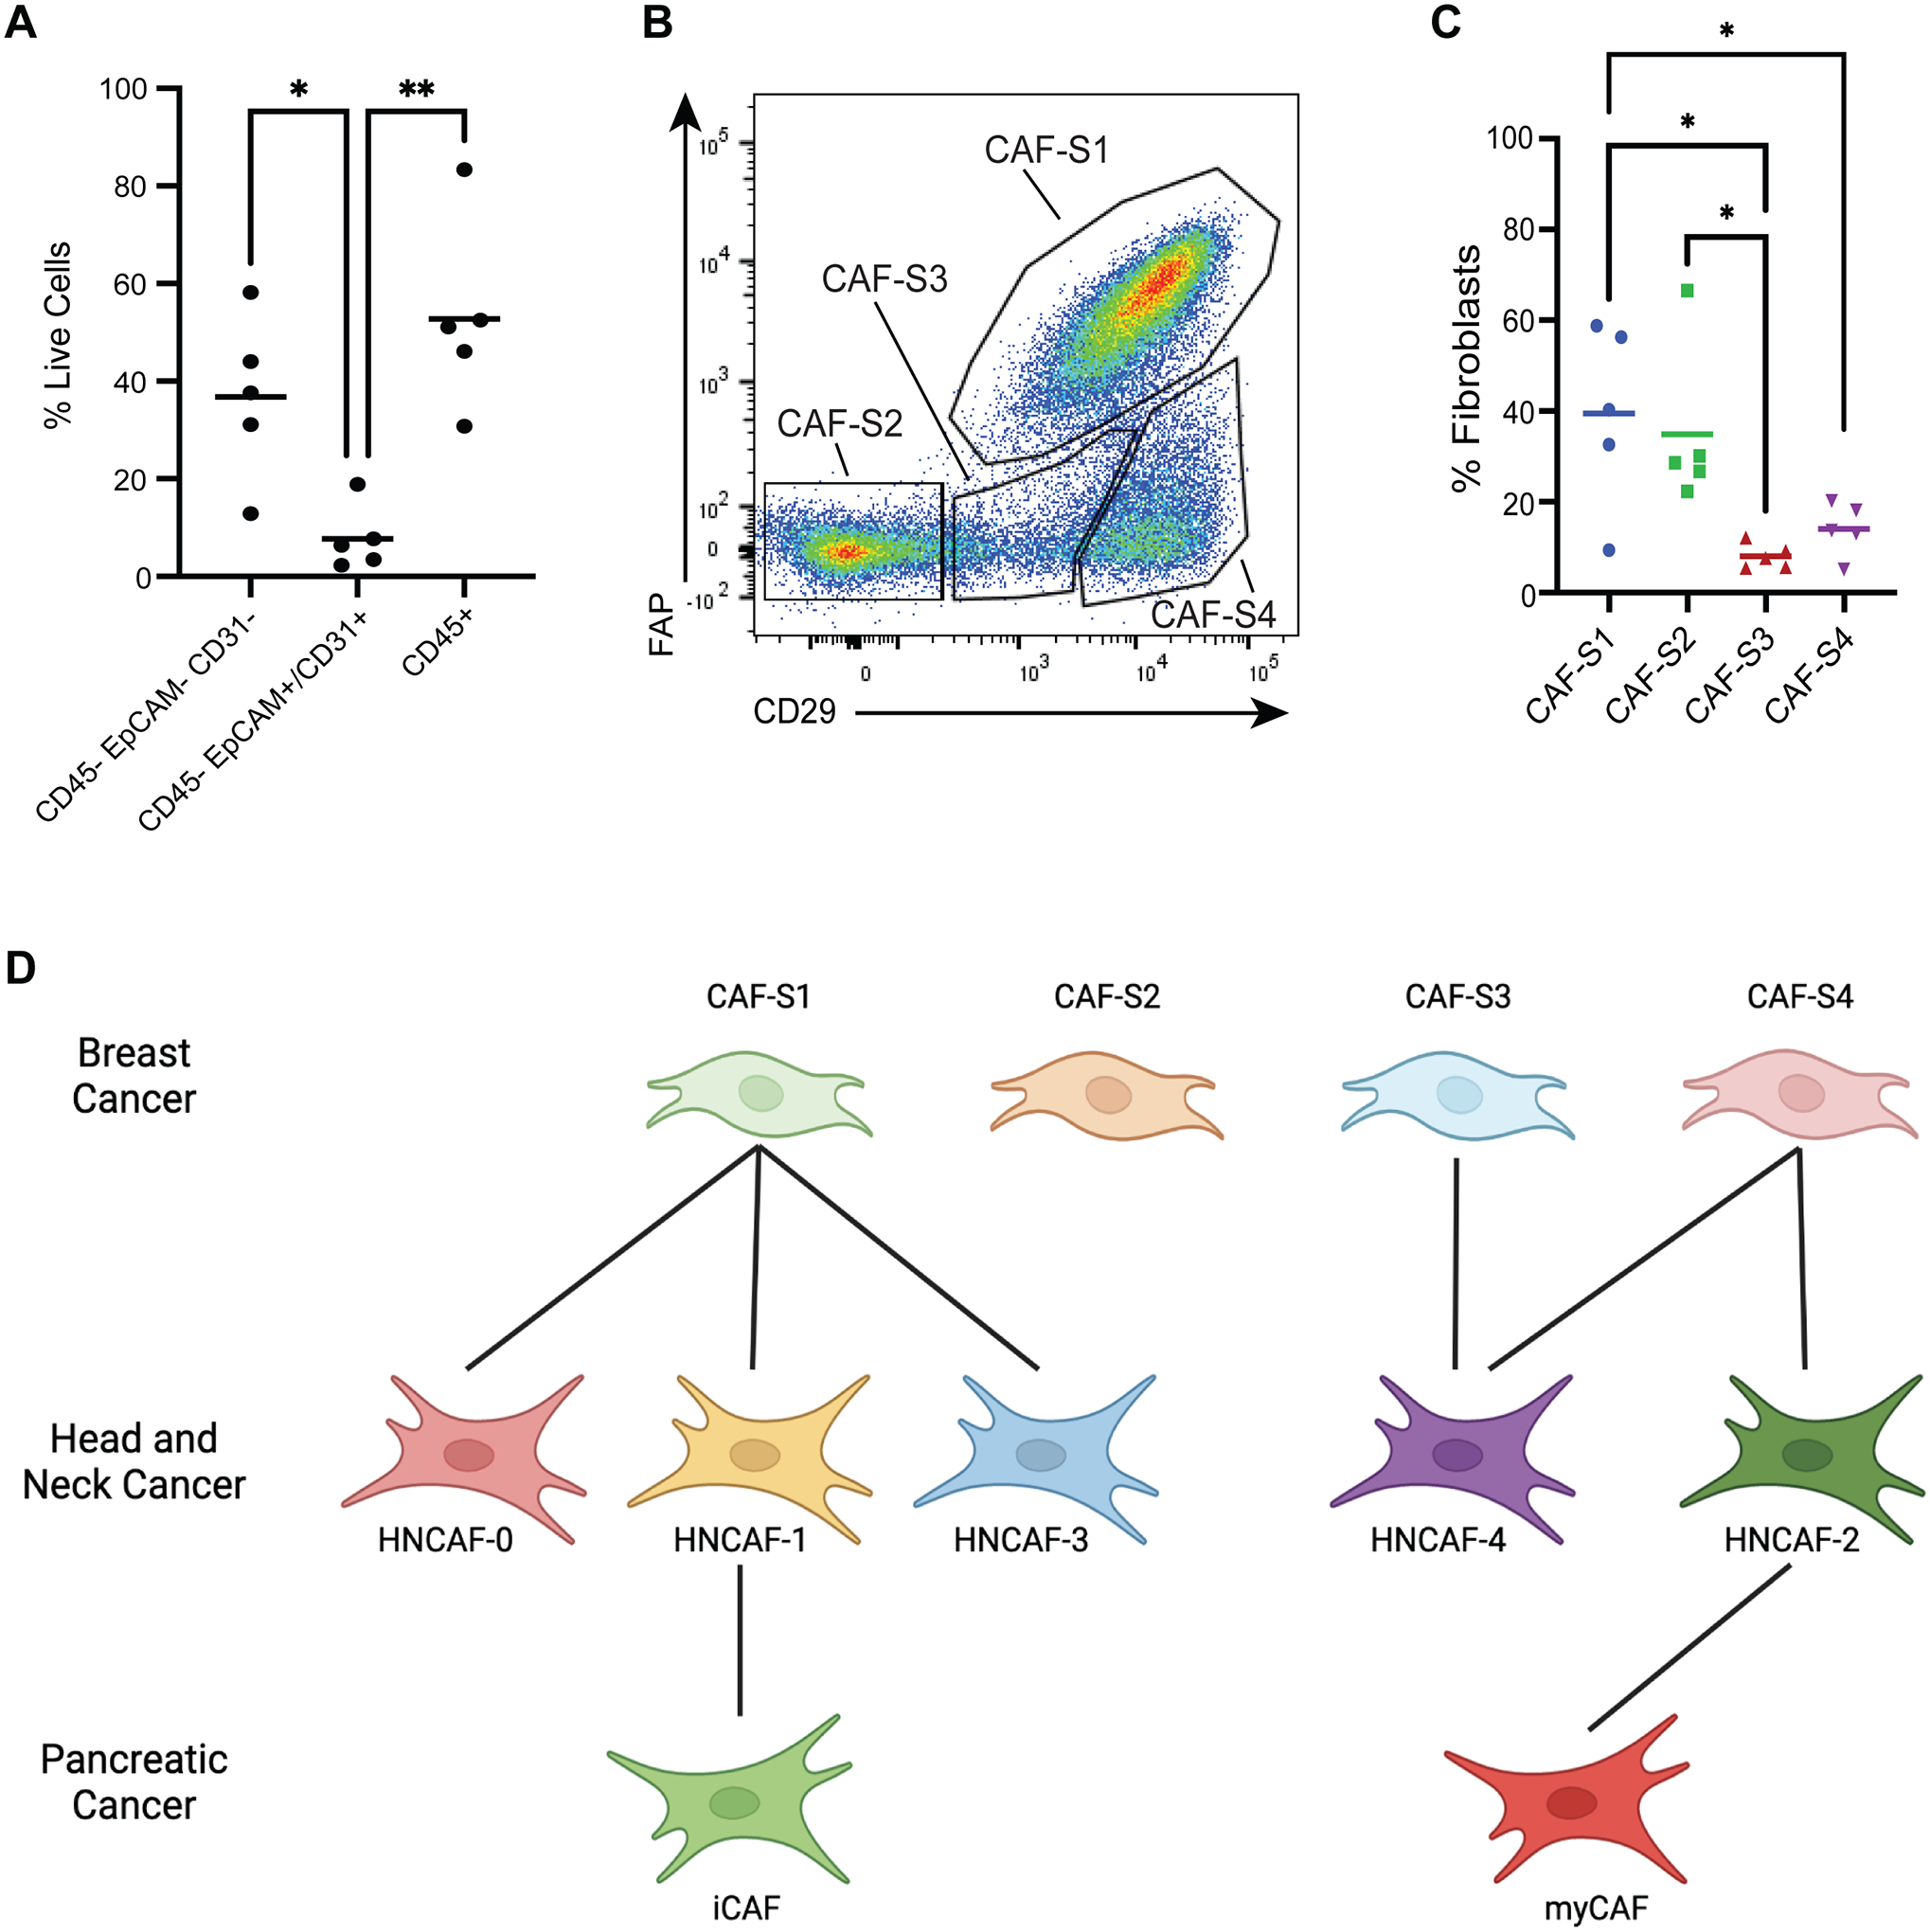
Purpose: Cancer-associated fibroblasts (CAF) have been implicated as potential mediators of checkpoint immunotherapy response. However, the extensive heterogeneity of these cells has precluded rigorous understanding of their immunoregulatory role in the tumor microenvironment.

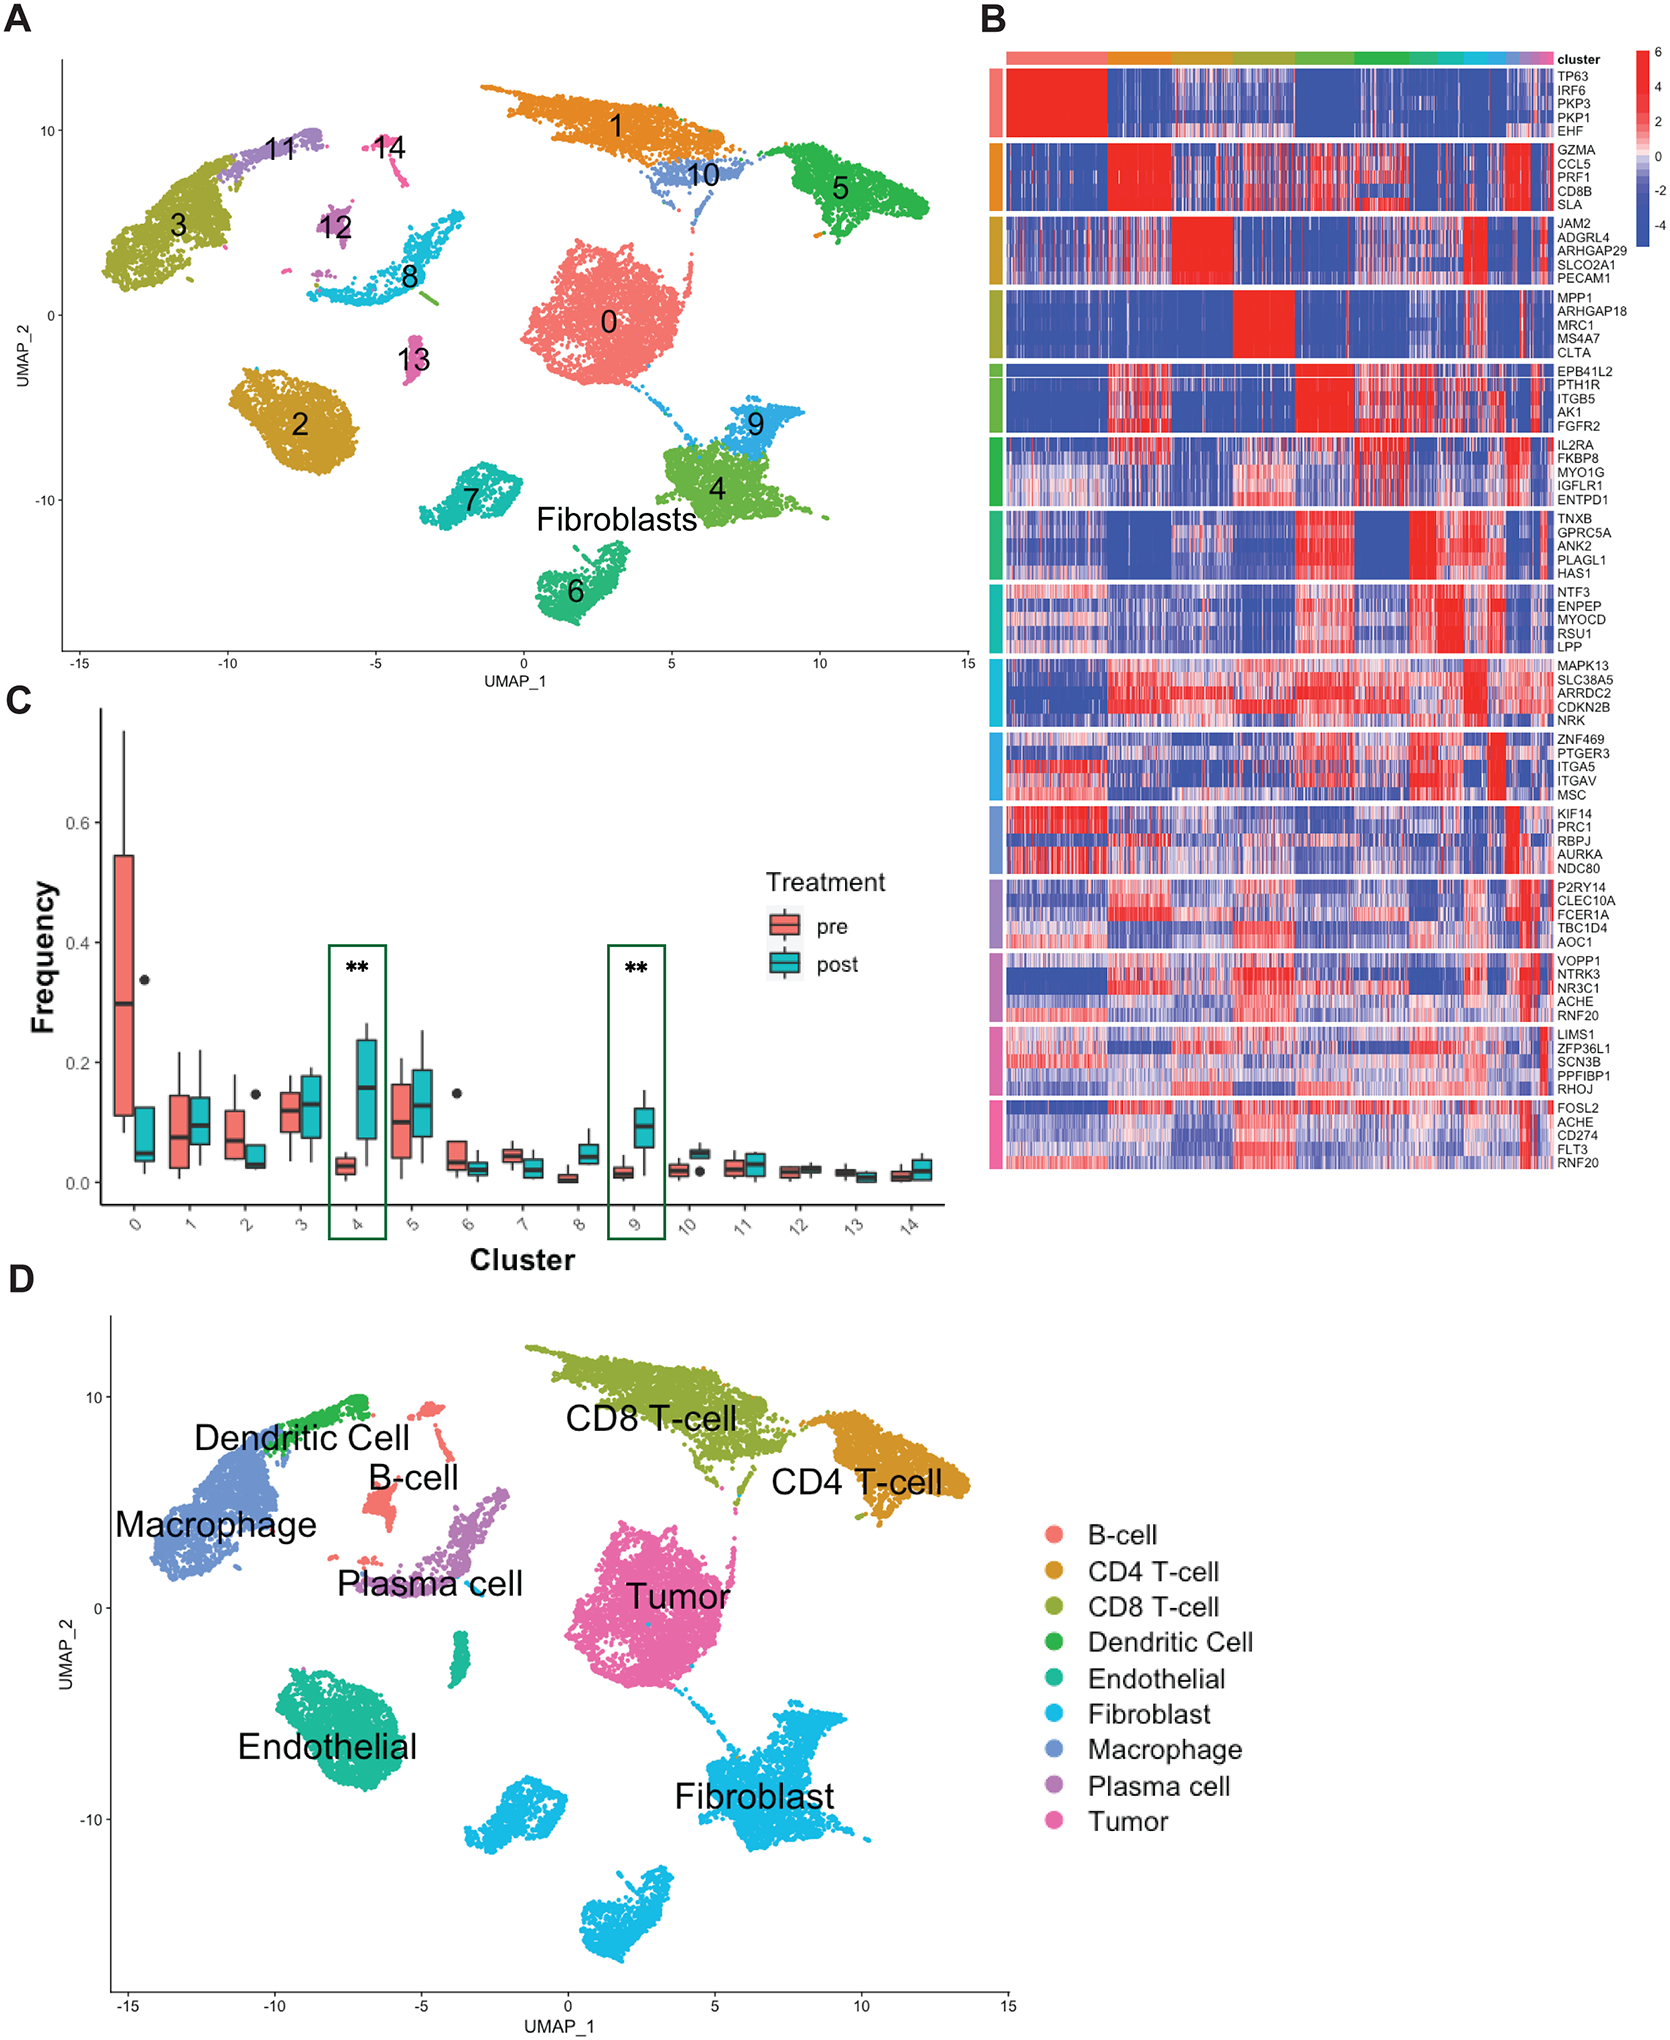
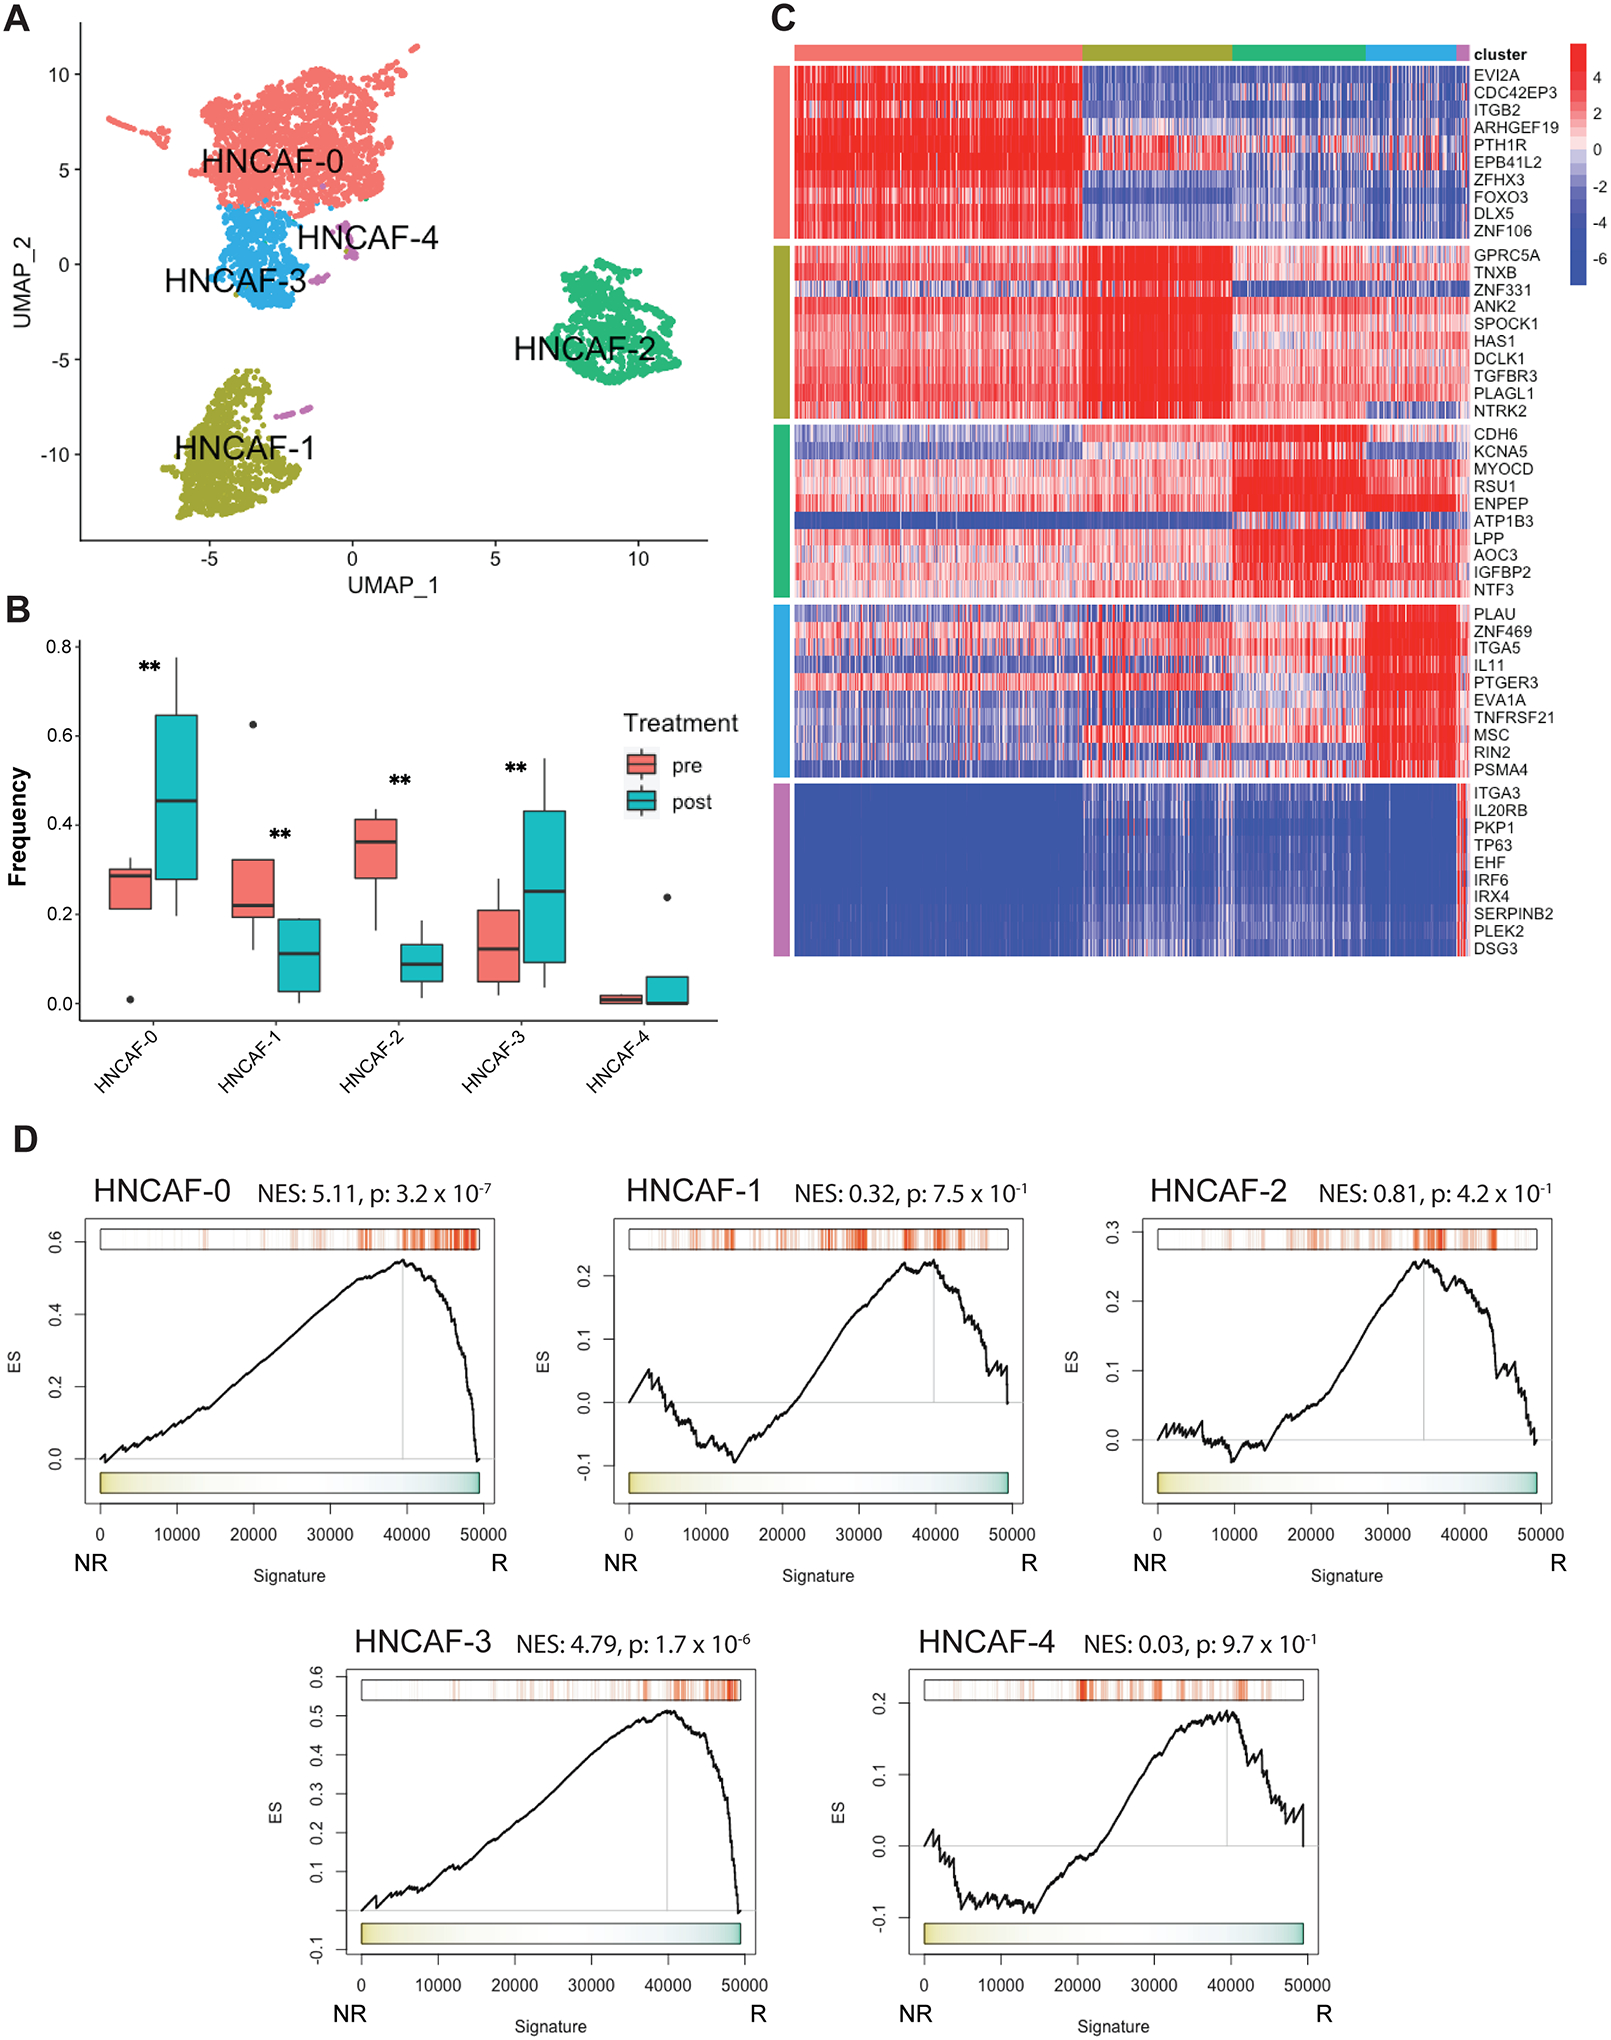
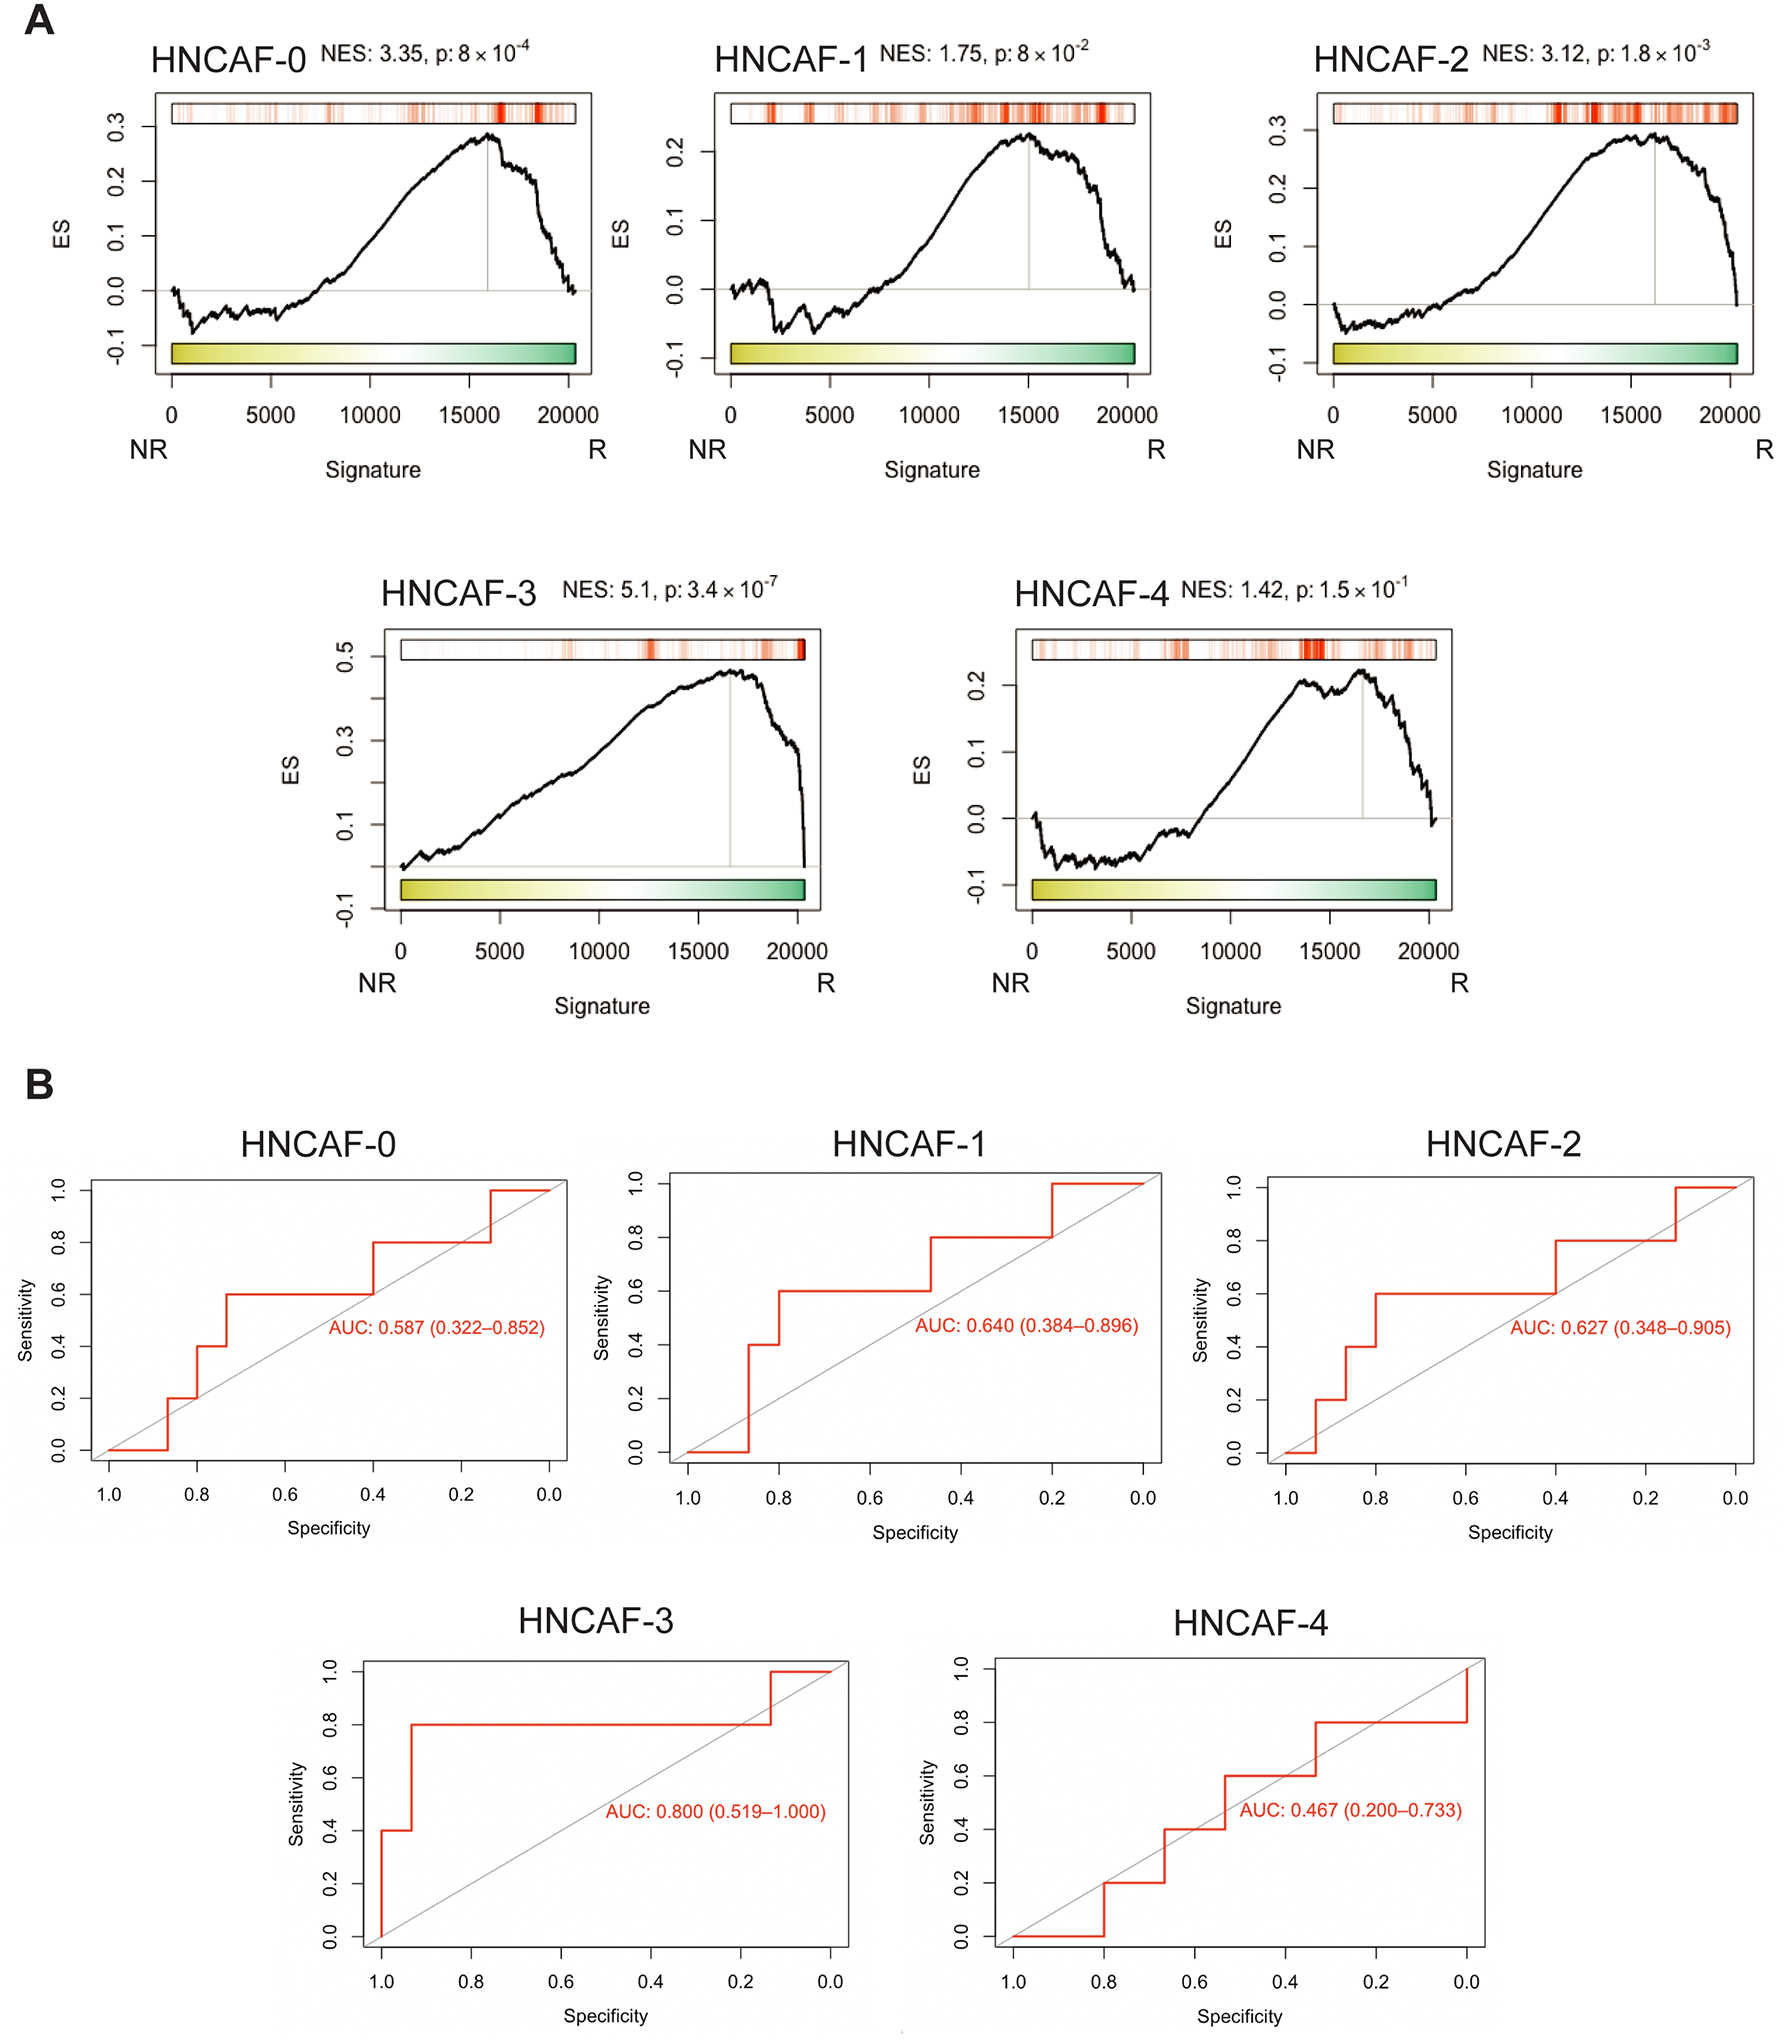
Experimental design: We performed high-dimensional single-cell RNA sequencing (scRNA-seq) on four patient tumors pretreatment and posttreatment from a neoadjuvant trial of patients with advanced-stage head and neck squamous cell carcinoma that were treated with the αPD-1 therapy, nivolumab. The head and neck CAF (HNCAF) protein activity profiles, derived from this cohort of paired scRNA-seq, were used to perform protein activity enrichment analysis on the 28-patient parental cohort of clinically annotated bulk transcriptomic profiles. Ex vivo coculture assays were used to test functional relevance of HNCAF subtypes.

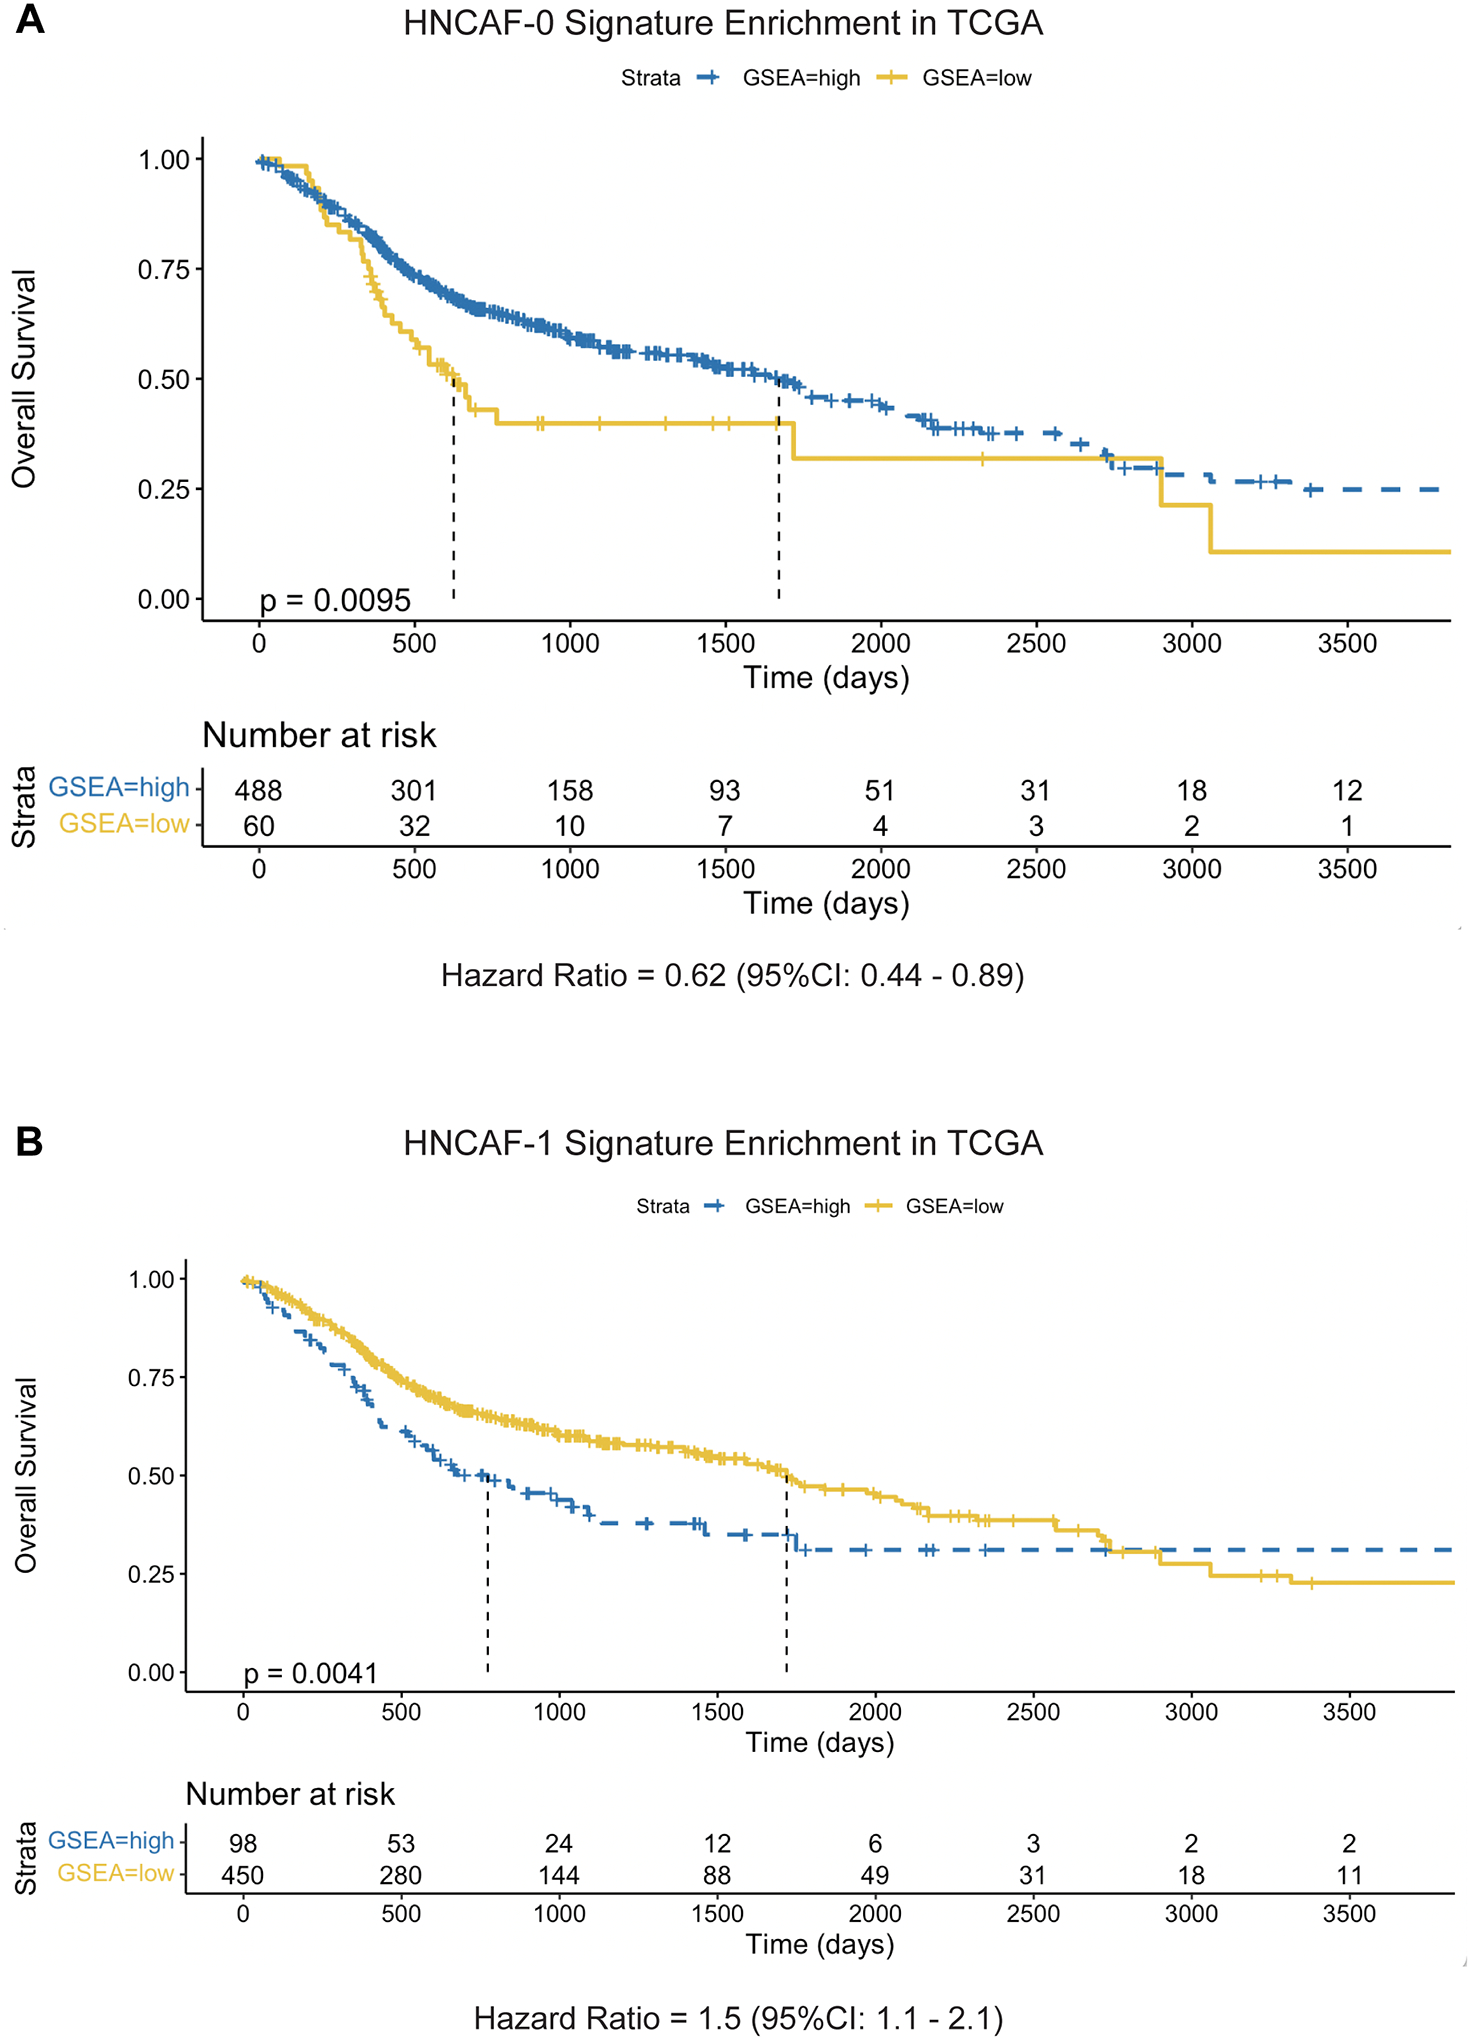
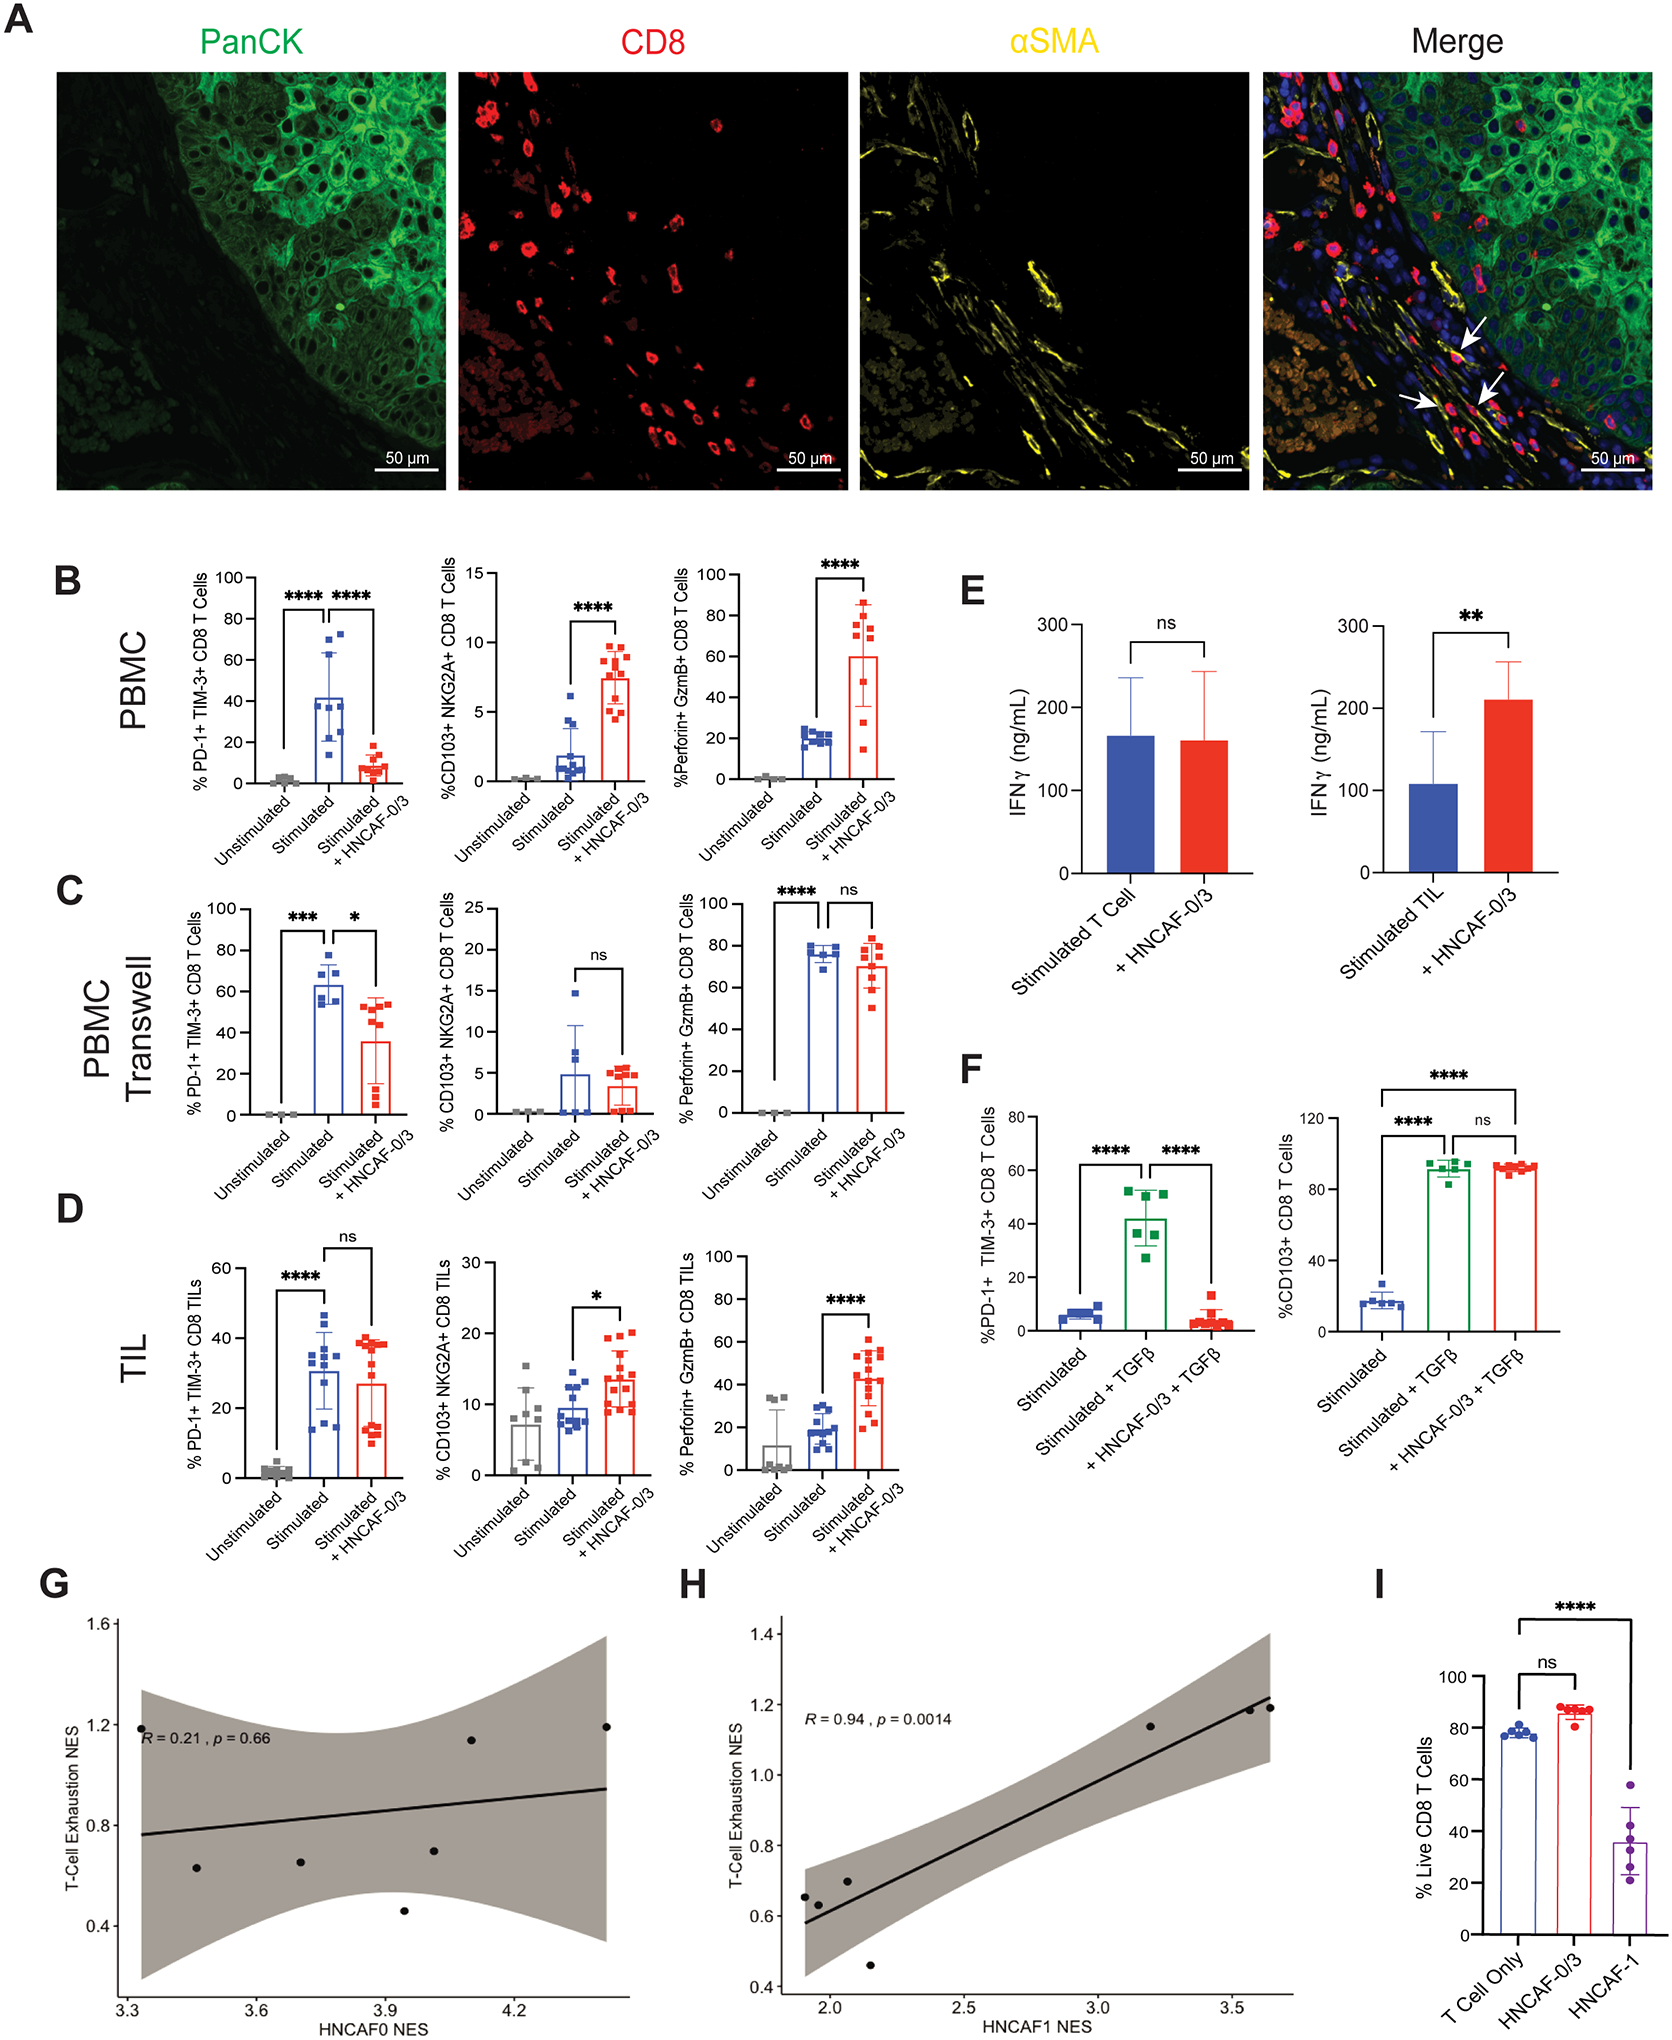
Results: Fourteen distinct cell types were identified with the fibroblast population showing significant changes in abundance following nivolumab treatment. Among the fibroblast subtypes, HNCAF-0/3 emerged as predictive of nivolumab response, while HNCAF-1 was associated with immunosuppression. Functionally, HNCAF-0/3 were found to reduce TGFβ-dependent PD-1+TIM-3+ exhaustion of CD8 T cells, increase CD103+NKG2A+ resident memory phenotypes, and enhance the overall cytolytic profile of T cells.

Conclusions: Our findings demonstrate the functional importance of distinct HNCAF subsets in modulating the immunoregulatory milieu of human HNSCC. In addition, we have identified clinically actionable HNCAF subtypes that can be used as a biomarker of response and resistance in future clinical trials.


Figures

Figure 1.
Figure 1.. VIPER analysis of longitudinal single-cell transcriptomic profiles of HNSCC show CAF changes associated with immunotherapy.
A) 2-dimensional UMAP projection of cells across all samples (n=4), processed by VIPER and clustered by resolution-optimized Louvain. Cells are colored by unsupervised cluster number, with fibroblast clusters (4,6,7,9) further labelled by cell type. B) Heatmap of top 5 most differentially upregulated proteins per cluster for each cell population in A. C) Boxplot of population frequency at baseline and following ⍺PD-1 immunotherapy for each cell type cluster in A. CAF subtypes increasing in response to immunotherapy are emphasized with green outline, ** indicates p<0.01. D) SingleR cell type inference projected on UMAP plot. Each cluster is assigned a lineage cell type based on its majority SingleR-inferred label.
Figure 2.
Figure 2.. Fibroblast sub-clustering reveals distinct populations associated with differential responses to αPD-1-based immunotherapy with the potential to predict clinical outcome.
A) 2-dimensional UMAP projection of CAF across all samples (n=4), re-clustered by resolution-optimized Louvain and colored by cluster identity. B) Boxplot of cluster frequencies of each HNCAF type pre- vs post-nivolumab therapy, ** indicates p<0.01. C) Heatmap of top 10 most differentially upregulated proteins per cluster for each CAF population. D) Protein Activity Profile Enrichment plots of single-cell protein population markers for each HNCAF cluster (Supplemental Table 1) in bulkRNA-Seq signature of immunotherapy responders (R, n=9) vs non-responders (NR, n=19), profiled pre-treatment. In each plot, ES represents raw enrichment score and NES represents the normalized enrichment score, as computed by GSEA using the set of statistically significant differentially active proteins for each HNCAF population at the single-cell level as a gene set, and testing for enrichment in the ranked list of proteins most to least enriched in therapy responders vs non-responders (ranked 0–5000). P-values for Normalized Enrichment Score are assessed by 1000 random permutations of gene ranking.
Figure 3.
Figure 3.. Prognostically associated HNCAF sub-populations provide greater resolution than previously characterized CAF phenotypes.
A) Relative frequencies of stromal (CD45-Epcam-CD31-), epithelial/endothelial (CD45-Epcam+/CD31+) and immune (CD45+) cell components across HNSCC patients quantified by flow cytometry (n=5). B) Flow cytometry gating strategy to isolate previously described CAF phenotypes from HNSCC specimens. C) Relative frequency for each CAF subtype from B among total CAF quantified by flow cytometry (n=5). D) Phenotype-matching between unsupervised HNCAF clusters from scRNA-Seq and previously defined CAF-S1 to CAF-S4, as well as iCAF and myCAF. Each single-cell HNCAF population is labelled as the sorted CAF-S1 to CAF-S4 population with highest gene set enrichment, as shown in Figure S3. The data in A and C were analyzed using one-way ANOVA and * indicates p<0.05, ** indicates p<0.01.
Figure 4.
Figure 4.. HNCAF-0 and HNCAF-1 have contrasting prognostic associations.
A) Kaplan-Meier plot of HNCAF-0 Protein Activity Gene Set Enrichment among TCGA dataset of head and neck squamous cell carcinoma patients in association with overall survival time, limited to patients with under 10 years of follow-up. Enrichment scores were binarized by log-rank maximization to “high HNCAF-0” and “low HNCAF-0” and showed significant association with improved survival (p=0.0095, median survival time = 602 days vs 1671 days). Hazard ratio is shown below the plot, with 95% confidence interval. B) Kaplan-Meier plot of HNCAF-1 Protein Activity Gene Set Enrichment among TCGA head and neck squamous cell carcinoma patients in association with overall survival time, limited to patients with under 10 years of follow-up, as in A. HNCAF-1 enrichment shows significant association with worse survival (p=0.0041, median survival time = 1718 days vs 773 days). Hazard ratio is shown below the plot, with 95% confidence interval.
Figure 5:
Figure 5:. HNCAF spatially co-localizes with CD8 T cells and HNCAF-0/3 functionally decrease TGFb dependent T cell exhaustion in vitro.
A) Pre-treatment DSP immunofluorescence imaging from a representative patient treated with ⍺PD-1 immunotherapy, such that tumor cell localization is indicated by panCK staining (green), Cytotoxic T cell localization by CD8 staining (red), fibroblast localization by ⍺SMA staining (yellow), and nucleated cells by DAPI staining (blue). Arrows indicate interactions between ⍺SMA+ fibroblasts and CD8+ T cells. B) Co-culture experiment of naïve T cells derived from peripheral blood mononuclear cells (PBMC) with CD3/CD28 stimulation and isolated HNCAF-0/3 cells, showing T cell exhaustion markers (%PD-1+ TIM-3+ cells), tissue residency memory markers (%CD103+ NKG2A+ cells), and cytotoxicity (%Perforin+ GzmB+ cells) (n=3–12). C) Co-culture experiment of T cells with HNCAF-0/3 cells as in B except in contact-isolating transwell culture (n=3–9). D) Co-culture experiment of Tumor-Infiltrating Lymphocytes (TIL) with CD3/CD28 stimulation and isolated HNCAF-0/3 cells (n=9–15). E) Interferon gamma levels in co-culture of naïve T cells derived from PBMC and TIL with HNCAF-0/3 cells determined by ELISA (n=3 for PBMCs; n=6 for TIL). F) Rescue experiment of T cells derived from PBMCs with CD3/CD28 stimulation and TGFβ with or without HNCAF-0/3 (n=6–9). G) Spatial enrichment of HNCAF-0/3 gene set vs enrichment of T-cell exhaustion signature in Nanostring DSP of tissue slices across patients (n=2). H) Spatial enrichment of HNCAF-1 gene set vs enrichment of T-cell exhaustion signature in Nanostring DSP of tissue slices across patients (n=2). Signatures are positively correlated with respect to spatial co-localization (correlation coefficient=0.94, p=0.0014). I) Quantitation of live cells out of total CD8 T cells determined by flow cytometry from co-culture with HNCAF-0/3 or HNCAF-1. B-D, F) Percentages were quantified by flow cytometry. Results are shown as mean ± SD and are representative of at least three independent experiments. The data were analyzed using one-way ANOVA (B-D, F, I) or the Student t test (E) and * indicates p<0.05, ** indicates p<0.01, *** indicates p<0.001, and **** indicates p<0.0001.
Figure 6:
Figure 6:. HNCAF-0 and HNCAF-3 are also predictive of favorable responses to pembrolizumab.
A) Protein Activity Profile Enrichment plots of single-cell protein population markers for each HNCAF cluster (Supplemental Table 1) in bulkRNA-Seq signature of pembrolizumab immunotherapy responders (R, n=5) vs non-responders (NR, n=15), profiled pre-treatment (23). B) Area Under the Receiver Operating Characteristic (AUROC) plots corresponding to pre-treatment predictive power of patient-by-patient protein activity profile enrichment for each HNCAF population show in A. 95% confidence intervals are included.

References

    1. Ferris RL, et al., Nivolumab for Recurrent Squamous-Cell Carcinoma of the Head and Neck. N Engl J Med, 2016. 375(19): p. 1856–1867. - PMC - PubMed
    1. Seiwert TY, et al., Safety and clinical activity of pembrolizumab for treatment of recurrent or metastatic squamous cell carcinoma of the head and neck (KEYNOTE-012): an open-label, multicentre, phase 1b trial. Lancet Oncol, 2016. 17(7): p. 956–965. - PubMed
    1. Mehra R, et al., Efficacy and safety of pembrolizumab in recurrent/metastatic head and neck squamous cell carcinoma: pooled analyses after long-term follow-up in KEYNOTE-012. Br J Cancer, 2018. 119(2): p. 153–159. - PMC - PubMed
    1. Burtness B, et al., Pembrolizumab alone or with chemotherapy versus cetuximab with chemotherapy for recurrent or metastatic squamous cell carcinoma of the head and neck (KEYNOTE-048): a randomised, open-label, phase 3 study. Lancet, 2019. 394(10212): p. 1915–1928. - PubMed
    1. Strauss L, et al., Targeted deletion of PD-1 in myeloid cells induces antitumor immunity. Sci Immunol, 2020. 5(43). - PMC - PubMed

Publication types

MeSH terms

LinkOut - more resources