

Hospitalizations and Mortality From Non-SARS-CoV-2 Causes Among Medicare Beneficiaries at US Hospitals During the SARS-CoV-2 Pandemic
- PMID: 35262712
- PMCID: PMC8908076
- DOI: 10.1001/jamanetworkopen.2022.1754
Hospitalizations and Mortality From Non-SARS-CoV-2 Causes Among Medicare Beneficiaries at US Hospitals During the SARS-CoV-2 Pandemic
Abstract
Importance: The increased hospital mortality rates from non-SARS-CoV-2 causes during the SARS-CoV-2 pandemic are incompletely characterized.
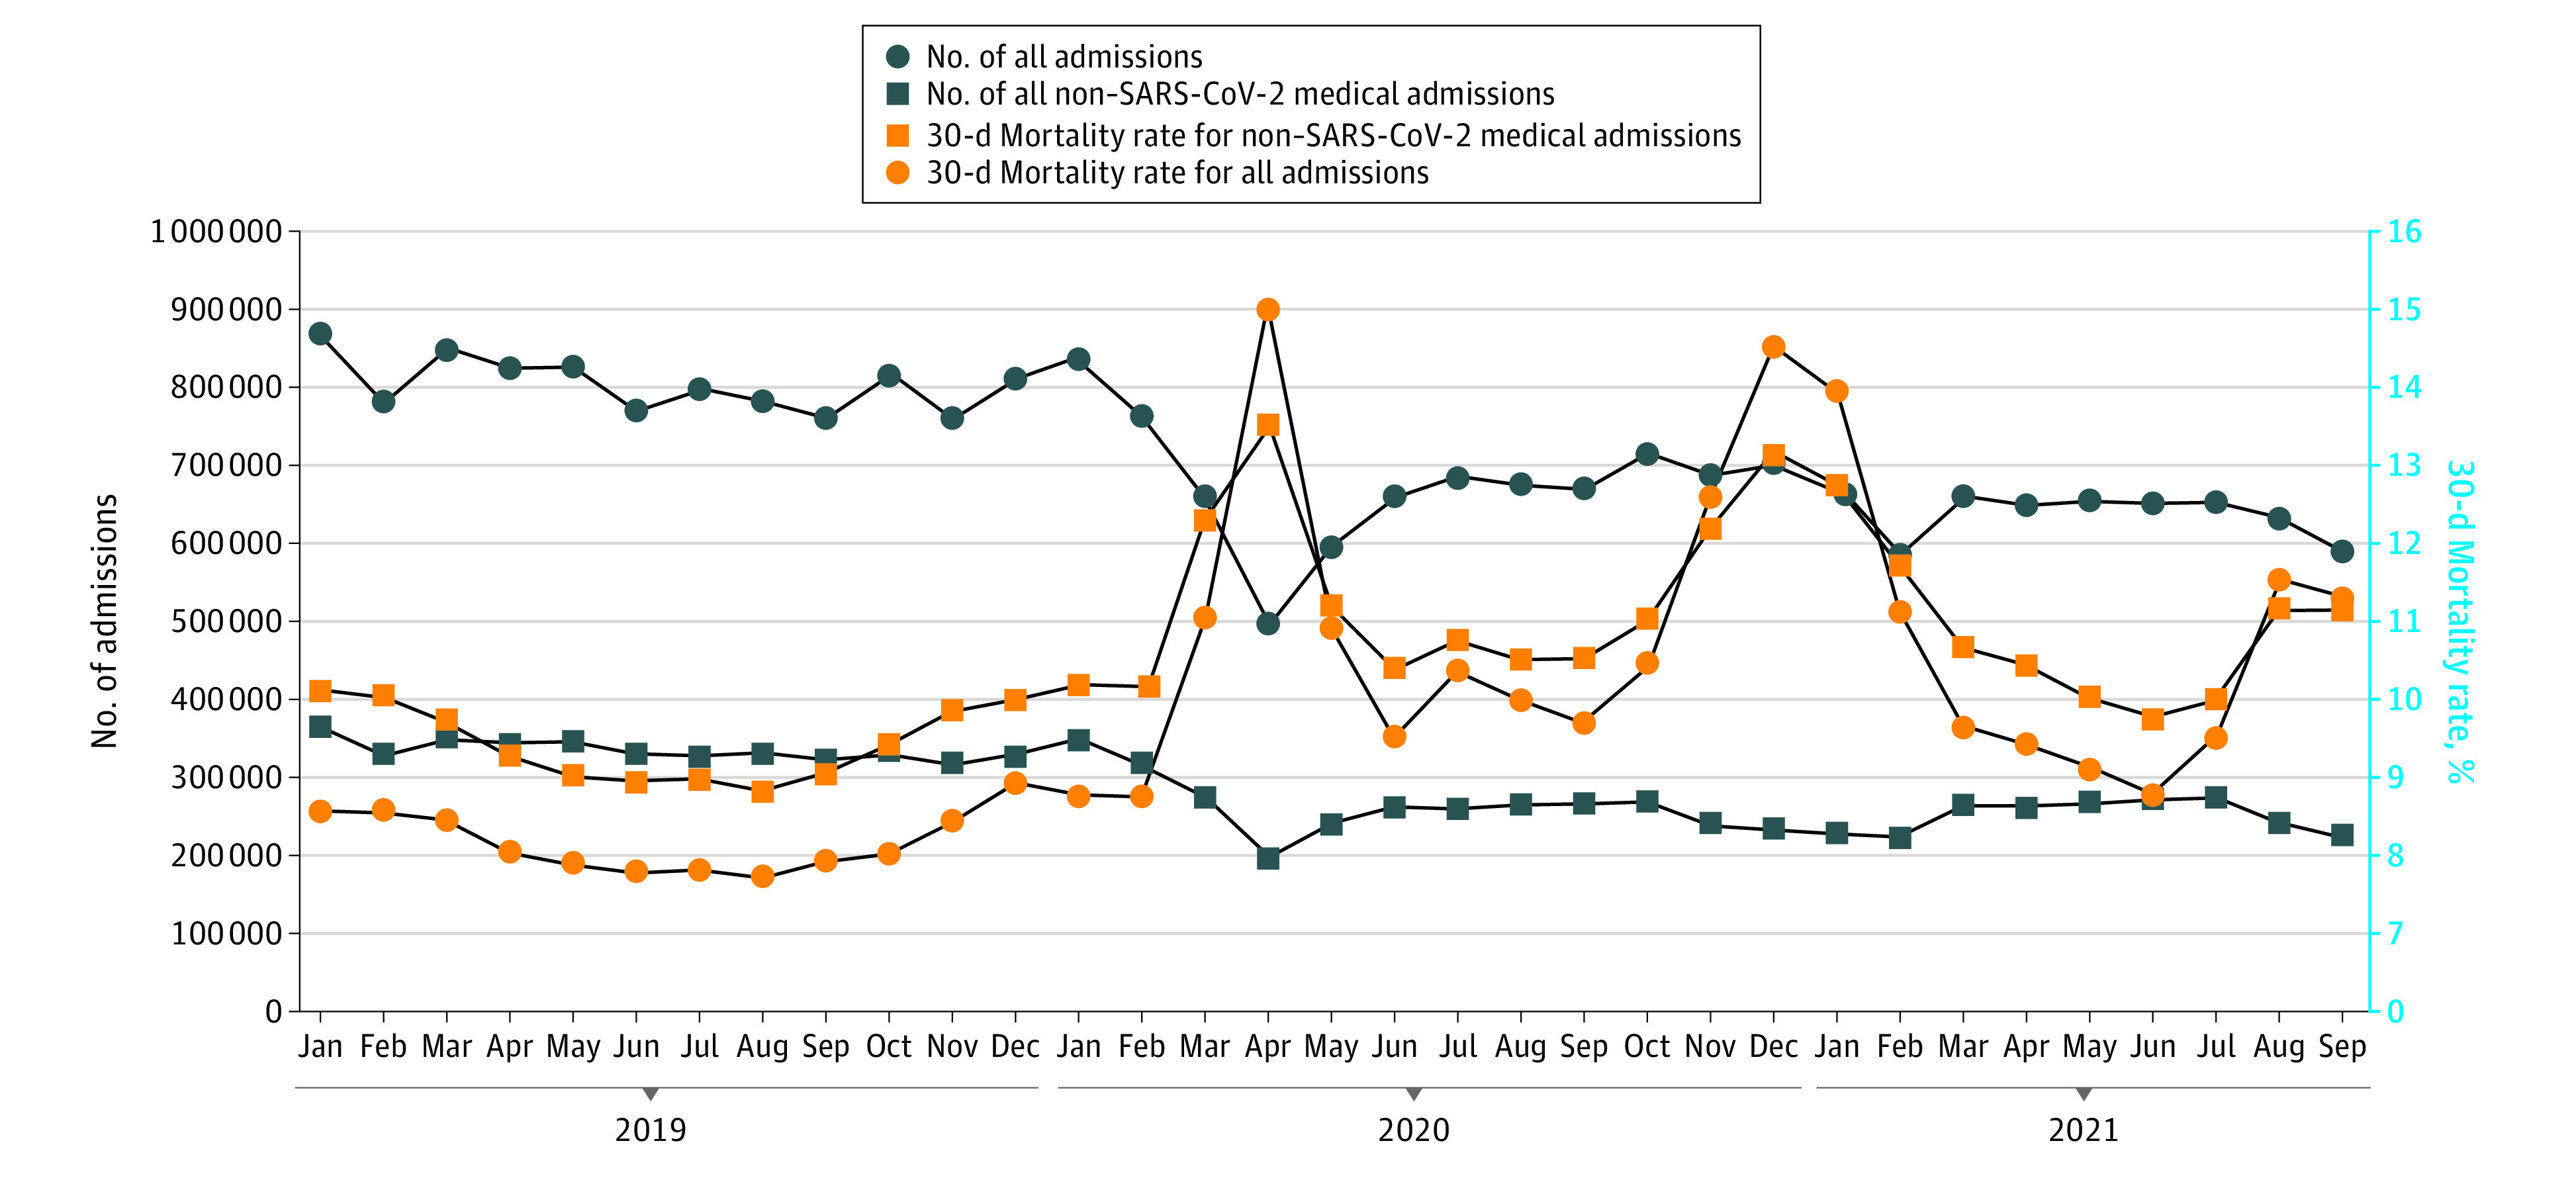
Objective: To describe changes in mortality rates after hospitalization for non-SARS-CoV-2 conditions during the COVID-19 pandemic and how mortality varies by characteristics of the admission and hospital.
Design, setting, and participants: Retrospective cohort study from January 2019 through September 2021 using 100% of national Medicare claims, including 4626 US hospitals. Participants included 8 448 758 individuals with non-COVID-19 medical admissions with fee-for-service Medicare insurance.
Main outcomes and measures: Outcome was mortality in the 30 days after admission with adjusted odds generated from a 3-level (admission, hospital, and county) logistic regression model that included diagnosis, demographic variables, comorbidities, hospital characteristics, and hospital prevalence of SARS-CoV-2.
Results: There were 8 448 758 non-SARS-CoV-2 medical admissions in 2019 and from April 2020 to September 2021 (mean [SD] age, 73.66 [12.88] years; 52.82% women; 821 569 [11.87%] Black, 438 453 [6.34%] Hispanic, 5 351 956 [77.35%] White, and 307 218 [4.44%] categorized as other). Mortality in the 30 days after admission increased from 9.43% in 2019 to 11.48% from April 1, 2020, to March 31, 2021 (odds ratio [OR], 1.20; 95% CI, 1.19-1.21) in multilevel logistic regression analyses including admission and hospital characteristics. The increase in mortality was maintained throughout the first 18 months of the pandemic and varied by race and ethnicity (OR, 1.27; 95% CI, 1.23-1.30 for Black enrollees; OR, 1.25; 95% CI, 1.23-1.27 for Hispanic enrollees; and OR, 1.18; 95% CI, 1.17-1.19 for White enrollees); Medicaid eligibility (OR, 1.25; 95% CI, 1.24-1.27 for Medicaid eligible vs OR, 1.18; 95% CI, 1.16-1.18 for noneligible); and hospital quality score, measured on a scale of 1 to 5 stars with 1 being the worst and 5 being the best (OR, 1.27; 95% CI, 1.22-1.31 for 1 star vs OR, 1.11; 95% CI, 1.08-1.15 for 5 stars). Greater hospital prevalence of SARS-CoV-2 was associated with greater increases in odds of death from the prepandemic period to the pandemic period; for example, comparing mortality in October through December 2020 with October through December 2019, the OR was 1.44 (95% CI, 1.39-1.49) for hospitals in the top quartile of SARS-CoV-2 admissions vs an OR of 1.19 (95% CI, 1.16-1.22) for admissions to hospitals in the lowest quartile. This association was mostly limited to admissions with high-severity diagnoses.
Conclusions and relevance: The prolonged elevation in mortality rates after hospital admission in 2020 and 2021 for non-SARS-CoV-2 diagnoses contrasts with reports of improvement in hospital mortality during 2020 for SARS-CoV-2. The results of this cohort study suggest that, with the continued impact of SARS-CoV-2, it is important to implement interventions to improve access to high-quality hospital care for those with non-SARS-CoV-2 diseases.
Conflict of interest statement
Figures
Comment in
-
The COVID-19 Pandemic Strikes Again and Again and Again.JAMA Netw Open. 2022 Mar 1;5(3):e221760. doi: 10.1001/jamanetworkopen.2022.1760. JAMA Netw Open. 2022. PMID: 35262720 No abstract available.
References
-
- Heist T, Schwartz K, Butler S. Trends in overall and non-COVID-19 hospital admissions. KFF issue briefs: health costs, February 2021. Accessed May 11, 2021. https://www.kff.org/health-costs/issue-brief/trends-in-overall-and-non-c...
-
- Cigna. Cigna study finds reduced rates of acute non-elective hospitalizations during the COVID-19 pandemic. Accessed May 11, 2021. https://newsroom.cigna.com/deferring-care-during-covid-19
Publication types
MeSH terms
Grants and funding
LinkOut - more resources
Full Text Sources
Medical
Miscellaneous
