. 2023 Jan 1;77(1):48-64.
doi: 10.1002/hep.32449. Epub 2022 Mar 21.

Gut microbiota-derived short-chain fatty acids regulate group 3 innate lymphoid cells in HCC

Affiliations

Gut microbiota-derived short-chain fatty acids regulate group 3 innate lymphoid cells in HCC

Chupeng Hu et al. Hepatology. .

Abstract

Background and aims: Type 3 innate lymphoid cells (ILC3s) are essential for host defense against infection and tissue homeostasis. However, their role in the development of HCC has not been adequately confirmed. In this study, we investigated the immunomodulatory role of short-chain fatty acids (SCFAs) derived from intestinal microbiota in ILC3 regulation.

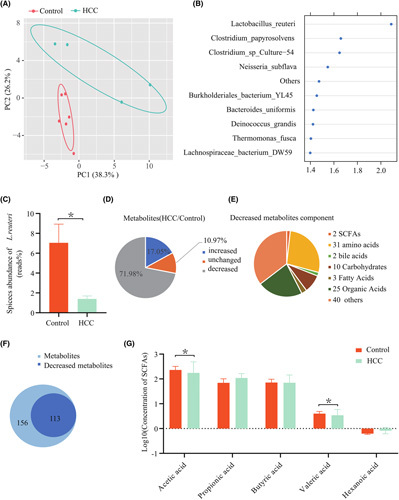
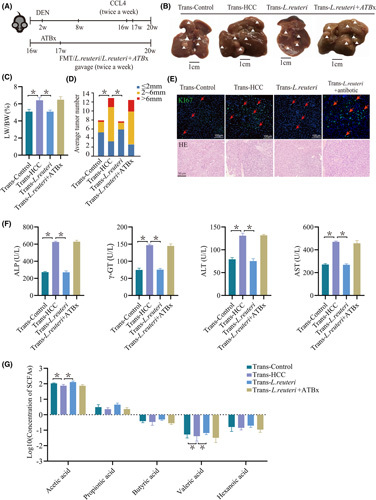
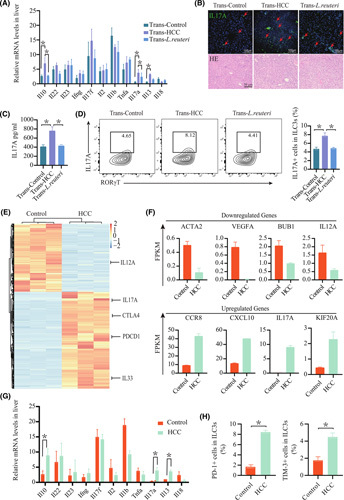
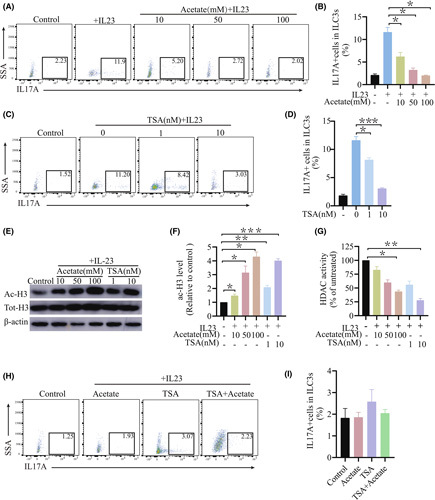
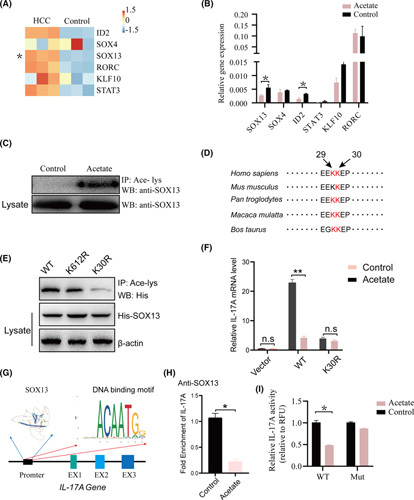
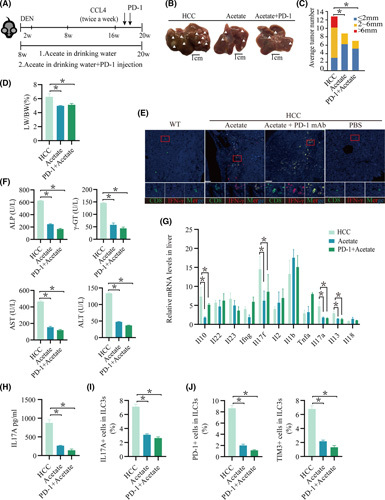
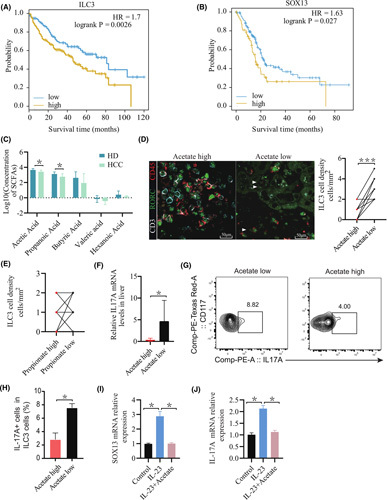
Approach and results: We report that Lactobacillus reuteri was markedly reduced in the gut microbiota of mice with HCC, accompanied by decreased SCFA levels, especially acetate. Additionally, transplantation of fecal bacteria from wild-type mice or L. reuteri could promote an anticancer effect, elevate acetate levels, and reduce IL-17A secretion in mice with HCC. Mechanistically, acetate reduced the production of IL-17A in hepatic ILC3s by inhibiting histone deacetylase activity, increasing the acetylation of SRY (sex-determining region Y)-box transcription factor 13 (Sox13) at site K30, and decreasing expression of Sox13. Moreover, the combination of acetate with programmed death 1/programmed death ligand 1 blockade significantly enhanced antitumor immunity. Consistently, tumor-infiltrating ILC3s correlated with negative prognosis in patients with HCC, which could be functionally mediated by acetate.

Conclusions: These findings suggested that modifying bacteria, changing SCFAs, reducing IL-17A-producing ILC3 infiltration, and combining with immune checkpoint inhibitors will contribute to the clinical treatment of HCC.


Conflict of interest statement

The author declares that there is no conflict of interest.

Figures

FIGURE 1
FIGURE 1
Gut microbial and SCFA alterations in mice with HCC. (A) PLS‐DA score image shows the abundance of species from samples of mice with HCC (green points) and controls (red points). The significant difference between the two groups (*p < 0.05) was evaluated using permutational multivariate analysis of variance with the Bray‐Curtis distance metric. (B) VIP score of PLS‐DA. The discriminative ability of different taxa between the HCC and control groups was ranked by applying VIP scores. The important distinction is the taxon with a VIP score > 1.4. (C) Species abundance of L. reuteri in the HCC and control groups. (D) Metabolomics analysis of gut microbial metabolites in colon contents from mice with or without HCC. (E) Components of the decreased gut microbial metabolite ( >10‐fold) in colon content in HCC mice compared with control mice. (F) Comparison of the decreased gut microbial metabolites in post‐HCC mice ( >10‐fold) and control mice. (G) Levels of portal vein serum SCFAs of acetate, propionate, butyrate, valerate, and caproate were detected in controls (n = 5) and HCC mice (n = 6). The concentration of SCFAs was determined by log10. p values were determined by a two‐tailed Mann‐Whitney U test. PC, principal component
FIGURE 2
FIGURE 2
Healthy control fecal microbiota or L. reuteri transplantation inhibited tumor growth in the HCC mouse model. (A) Schematic plot of the HCC model induced by diethylnitrosamine‐CCl4. Diethylnitrosamine (25 mg/kg) was injected i.p. into 14‐day‐old mice, followed by another injection after 6 weeks with CCl4 (2 mL/kg) twice a week for 12 weeks. Sixteen‐week‐old mice were transplanted with HCC, control fecal microbiota, L. reuteri, or L. reuteri+ABTx. (B) Macrograph of livers in male HCC mice kept with Trans‐Control (left) and with Trans‐HCC (second from left), and with oral administration of L. reuteri (right). HCCs are represented by arrowheads. (C,D) The liver weight to body weight ratio was analyzed, and the average number of liver tumors and the relative size distribution were divided into ≤ 2 mm, 2–6 mm, and >6 mm (p < 0.01). (E) Representative images and statistical analysis of H&E and Ki67 staining of liver sections in various mice, as indicated (n = 5). (F) Hepatic function indexes: ALP, AST, ALT, γ‐GT. (G) Levels of portal vein serum SCFAs of acetate, propionate, butyrate, valerate, and caproate were detected in Trans‐Control (n = 5), Trans‐HCC (n = 5), Trans‐L. reuteri, and Trans‐L. reuteri+ABTx (n = 5). p values were determined by the two‐tailed Mann‐Whitney U test. DEN, diethylnitrosamine; FMT, fecal microbiota transplantation; LW/BW, liver weight to body weight ratio
FIGURE 3
FIGURE 3
Molecular characterization of ILC3 cells in the liver by RNA‐seq. (A) Measurement of Il22, Ifng, Il10, Il13, Il17a, Il17f, Il18, Il1b, Il2, Il23, and Tnfa mRNA expression levels in livers by real‐time quantitative PCR (n = 5; *p < 0.05). (B) Representative images and statistical analysis of H&E and IL‐17‐A immunofluorescence staining of liver sections in various mice, as indicated (n = 5). (C) IL‐17A levels in the serum of Trans‐Control, Trans‐HCC, and Trans‐L. reuteri mice (n = 5). (D) Flow‐cytometric analysis of IL‐17A+ cells in CD45+ lineageRORγt+ ILC3s from the liver. Similar results were observed in three independent experiments. Percentage of IL‐17A cells in ILC3s from the liver (n ≥ 4). (E) Hierarchical clustering of all genes. (F) Representative expression map of differentially expressed genes including metabolism, tumor promotion, and cytokine secretion in ILC3 cells between tumor and control tissues (p < 0.01, by negative binomial generalized linear model). (G) Measurement of Il22, Ifng, Il10, Il13, Il17a, Il17f, Il18, Il1b, Il2, Il23, and Tnfa mRNA expression levels in livers by real‐time quantitative PCR (n ≥ 3; *p < 0.05). (H) Percentage of PD‐1 or TIM‐3 cells in ILC3s from the liver (n ≥ 4). BUB1, budding uninhibited by benzimidazoles 1; CCR8, chemokine (C‐C motif) receptor 8; CTLA4, cytotoxic T lymphocyte antigen 4; FPKM, fragments per kilobase per million; PDCD1, programmed cell death 1
FIGURE 4
FIGURE 4
SCFAs inhibited production of IL‐17A by ILC3s in vitro. (A) Representative flow diagram showing intracellular expression of IL‐17A in ILC3s after 48 h of treatment with acetate at different concentrations. (B) Total IL‐17A+ ILC3s after 48 h of treatment assessed in (A) (n ≥ 4). (C,D) ILC3s from the livers of control mice were treated with 40 ng/ml IL‐23 in the presence or absence of acetate or TSA at the indicated concentrations. Representative western blot and relative expression of acetyl‐histone H3 levels after 6 h of treatment. Normalization of data against the total H3. (E) HDAC activity in ILC3 nuclear extracts after 6 h of treatment. (F,G) Flow‐cytometric analysis of the percentage of IL‐17A cells in ILC3s from livers after 48 h of treatment with TSA at different concentrations. Total IL‐17A+ ILC3s after 48 h of treatment in (C) (n ≥ 4). (H) ILC3s from the liver were treated with 50 mmol/L acetate, 40 ng/ml IL‐23, or 10 nmol/L TSA for 48 h. Total IL‐17A+ ILC3s after 48 h of treatment (n ≥ 4). (I) Total IL‐17A+ ILC3s after 48 h of treatment in E (n ≥ 4). ac‐H3, acetyl‐histone H3; SSA, side scattering analysis
FIGURE 5
FIGURE 5
Acetate‐modulated production of IL‐17A in ILC3s through enhancing acetylation of Sox13. (A) ILC3 cells from WT and HCC livers were sorted. RNA‐seq was performed. Expression of ID2, SOX4, SOX13, RORC, KLF10, and STAT3 is shown in a heatmap. Sox13 was significantly up‐regulated in HCC mice. (B) Measurement of ID2, SOX4, SOX13, RORC, KLF10, and STAT3 mRNA expression levels in livers by real‐time quantitative PCR (n ≥ 3; *p < 0.05). (C) Acetylation of Sox13 in 293T cells with Sox13 overexpression in the presence of acetate. The antibodies used for IP and western blotting were antiacetylated lysine and anti‐Sox13, respectively. (D) Alignment of the Sox13 amino acid sequence from various species. Red highlight indicates the conserved K29 and K30. (E,F) Acetylation of Sox13 mutants expressed in 293T cells. The K29R and K30R and the Lys29 and Lys30 residues were replaced by Arg. (F) After being transfected with vector control, WT Sox13, or Sox13‐K30R, the IL‐17A mRNA level in 293T cells was detected upon acetate treatment. (G) The representative Sox13 DNA binding motif was predicted using the following website: https://jaspar.genereg.net. (H) The binding of Sox13 to the binding domain within an IL‐17A promoter was analyzed using chromatin IP and real‐time quantitative PCR in 293T cells transfected with His‐flagged Sox13 plasmid and IL‐17A promoter plasmid following treatment with acetate. (I) The 293T cells transfected with WT Sox13 binding domain or mutant Sox13 binding domain reporter vectors were treated with or without acetate 2 days posttransfection. Sox13 activity was assessed by luciferase. EX, exon; KLF10, Kruppel like factor 10; MUT, mutant; RORC, ROR complex; STAT3, signal transducer and activator of transcription 3; WB, western blotting
FIGURE 6
FIGURE 6
The combination of ICIs with SCFA administration facilitates the immune response in mice with HCC. (A) Schematic plot of the HCC model induced by diethylnitrosamine‐CCl4. PD‐1 (20 mg/kg) was injected twice per week during the last 3 weeks of CCl4 treatment. Mice were given drinking water containing acetate from 16 weeks of age for 20 weeks. IL‐17A levels in the supernatant of in vitro–cultured ILC3s treated with acetate (n ≥ 4/group). (B) Macrograph of livers in HCC mice kept with HCC (left), with acetate (second from left), and with PD‐1+acetate (right). Arrowheads indicate HCCs. (C,D) The liver weight to body weight ratio was analyzed, and the average number of liver tumors and the relative size distribution were divided into ≤ 2 mm, 2–6 mm, and >6 mm (p < 0.01). (E) Expression of CD8 and interferon‐γ in tumor tissue was determined by immunohistochemistry. (F) Hepatic function indexes: ALP, AST, ALT, γ‐GT. (G) Measurement of Il22, Ifng, Il10, Il13, Il17a, Il17f, Il18, Il1b, Il2, Il23, and Tnfa mRNA expression levels in livers by real‐time quantitative PCR (n ≥ 3; *p < 0.05). (H) IL‐17A levels in the serum of acetate, PD‐1+acetate, and HCC mice (n ≥ 3 mice/group). (I) Percentage of IL‐17A cells in ILC3s from the liver (n ≥ 4). (J) Percentage of PD‐1 or TIM‐3 cells in ILC3s from the liver (n ≥ 4). DEN, diethylnitrosamine; LW/BW, liver weight to body weight ratio; mAb, monoclonal antibody
FIGURE 7
FIGURE 7
Acetate negatively correlates with hepatic ILC3 infiltration in individuals with HCC. (A) Kaplan‐Meier curves of OS based on ILC3 cell frequencies in The Cancer Genome Atlas ILC3 cell gene list (KIT, CXCL8, IL4I1, IL1R1, MAFF, RUNX3). (B) Kaplan‐Meier curves of OS based on Sox13 expression in HCC in The Cancer Genome Atlas. (C) Levels of portal vein serum SCFAs of acetate, propionate, butyrate, valerate, and caproate were detected in individuals with HCC (n = 8) and healthy donors (n = 15). p values were determined by the two‐tailed Mann‐Whitney U test. (D,E) Representative graphs of ILC3 cell distribution in tumor tissues. The method was used to define the subset as CD45+CD3‐RORγt+ cells. Compared with the acetate‐high group and the acetate‐low group (D) or compared with the propionate‐high group and the propionate‐low group (E), the absolute number of ILC3 cells was significantly reduced in the acetate‐high group (p < 0.001; n = 10). (F) Measurement of IL‐17A mRNA expression levels in livers by real‐time quantitative PCR in individuals in the acetate‐high group (n = 3) and the acetate‐low group (n = 4) (*p < 0.05). (G,H) Human ILC3s were sorted from peripheral blood mononuclear cells of patients with HCC. (G) The percentage of peripheral blood IL‐17A+ cells in ILC3 cells was determined by flow‐cytometric analysis. (H) Representative graphs of IL‐17A+ILC3 cells in patients with high levels of serum acetate and those with low acetate levels (n ≥ 3) (*p < 0.05). (I,J) Human ILC3s were sorted from healthy donor peripheral blood mononuclear cells and cultured with IL‐2 (10 ng/ml) and IL‐7 (10 ng/ml) in the presence or absence of acetate or IL‐23 (100 ng/ml). IL‐17A and Sox13 mRNA expression levels of ILC3s after 2 days of treatment (n ≥ 3) (*p < 0.05). HD, healthy donors; RORC, ROR complex

Comment in

References

    1. Kubes P, Jenne C. Immune responses in the liver. Annu Rev Immunol. 2018;36:247–77. - PubMed
    1. Ringelhan M, Pfister D, O'Connor T, Pikarsky E, Heikenwalder M. The immunology of hepatocellular carcinoma. Nat Immunol. 2018;19:222–32. - PubMed
    1. Rooks MG, Garrett WS. Gut microbiota, metabolites and host immunity. Nat Rev Immunol. 2016;16:341–52. - PMC - PubMed
    1. Vivier E, Artis D, Colonna M, Diefenbach A, Di Santo JP, Eberl G, et al. . Innate lymphoid cells: 10 years on. Cell. 2018;174:1054–66. - PubMed
    1. Malhotra N, Narayan K, Cho O, Sylvia K, Yin C, Melichar H, et al. . A network of high‐mobility group box transcription factors programs innate interleukin‐17 production. Immunity. 2013;38:681–93. - PMC - PubMed

Publication types