Review
. 2022 Mar 23;122(6):6795-6849.
doi: 10.1021/acs.chemrev.1c00493. Epub 2022 Mar 9.

Heterogeneous Trimetallic Nanoparticles as Catalysts

Affiliations
Review

Heterogeneous Trimetallic Nanoparticles as Catalysts

James W M Crawley et al. Chem Rev. .

Abstract

The development and application of trimetallic nanoparticles continues to accelerate rapidly as a result of advances in materials design, synthetic control, and reaction characterization. Following the technological successes of multicomponent materials in automotive exhausts and photovoltaics, synergistic effects are now accessible through the careful preparation of multielement particles, presenting exciting opportunities in the field of catalysis. In this review, we explore the methods currently used in the design, synthesis, analysis, and application of trimetallic nanoparticles across both the experimental and computational realms and provide a critical perspective on the emergent field of trimetallic nanocatalysts. Trimetallic nanoparticles are typically supported on high-surface-area metal oxides for catalytic applications, synthesized via preparative conditions that are comparable to those applied for mono- and bimetallic nanoparticles. However, controlled elemental segregation and subsequent characterization remain challenging because of the heterogeneous nature of the systems. The multielement composition exhibits beneficial synergy for important oxidation, dehydrogenation, and hydrogenation reactions; in some cases, this is realized through higher selectivity, while activity improvements are also observed. However, challenges related to identifying and harnessing influential characteristics for maximum productivity remain. Computation provides support for the experimental endeavors, for example in electrocatalysis, and a clear need is identified for the marriage of simulation, with respect to both combinatorial element screening and optimal reaction design, to experiment in order to maximize productivity from this nascent field. Clear challenges remain with respect to identifying, making, and applying trimetallic catalysts efficiently, but the foundations are now visible, and the outlook is strong for this exciting chemical field.


Conflict of interest statement

The authors declare no competing financial interest.

Figures

Figure 1
Figure 1
Number of publications based on a Web of Science (February 2021) search for “trimetallic catalyst” (tan), “trimetallic nanoparticles” (green), and “trimetallic nanoparticles” with “applications” (pink) and limited from 1990 to 2020.
Figure 2
Figure 2
Diagrammatical representations of different compositional descriptors used in multicomponent nanomaterials (left to right) noting ordered structures (o-) where appropriate: bimetallic core@shell (M1@M2), trimetallic inner-core@core@shell (M1@M2@M3), core@random-shell (M1@M2M3), random alloy (M1M2), ordered-core@shell (o-M1M2@M3), core@ordered-shell (M1@o-M2M3), ordered alloy (o-M1M2), random-core@shell (M1M2@M3), core@shell where M2 is distributed across the particle (M1M2@M2M3, often described as an AB@AC structure), ordered alloy with M3 randomly distributed (o-M1M2-M3), random trimetallic solid solution (M1M2M3), and ordered trimetallic alloy or intermetallic solution (o-M1M2M3). Where a support is used, the nomenclature will be given as M1M2M3/support (e.g., PtPdAu/TiO2).
Figure 3
Figure 3
Contour diagram of catalytic activity of AuPdPt/CeO2 catalysts, showing how the rate of H2O2 production (molH2O2 kgcat–1 h–1) depends on the Au:Pd:Pt ratio. Adapted with permission from ref (16). Copyright 2014 Wiley-VCH.
Figure 4
Figure 4
Examples of metal NPs with different morphologies: (a) cube with (100) facets, (b) tetrahedron with (111) facets, (c) octahedron with (111) facets, (d) cuboctahedron with (100) and (111) facets, and (e) a spherical shape. Adapted with permission from ref (43). Copyright 2016 Royal Society of Chemistry.
Figure 5
Figure 5
(a) TEM image of PtPdCu porous nanocubes. (b) HRTEM image of PtPdCu porous nanocubes. (c) TEM image of PtPdCu porous nanodendrites. (d) HRTEM image of PtPdCu porous nanodendrites. Adapted from ref (47). Copyright 2019 American Chemical Society.
Figure 6
Figure 6
(a) HAADF-STEM image of Ni40Au15Pd45/C and (b–d) the corresponding EDX elemental maps of (b) Ni, (c) Au, and (d) Pd. Adapted with permission from ref (77). Copyright 2014 Elsevier.
Figure 7
Figure 7
(left) Synthesis scheme to produce PtAuCo alloy catalysts. (right) Resultant morphology and structure of the unsupported Pt76Au12Co12 alloy TMNPs from electron microscopy analysis: (a, b) TEM images taken at different magnifications; (b1–b4) HRTEM images recorded from the different regions in (b); (c) selected-area electron diffraction (SAED) pattern. Adapted from ref (78). Copyright 2020 American Chemical Society.
Figure 8
Figure 8
Monte Carlo simulations showed that Pt grown on AgPd nanoalloys forms 3D islands at the beginning of the deposition process. Ag0.5Pd0.5 icosahedra (top row) and decahedra (bottom row): (a, e) initial stage of Pt (light-gray spheres) nucleation on Ag0.5Pd0.5; formation of Pt deposits on AgPd at (b, f) Θ = 0.5 monolayer (ML) and (c, g) Θ = 1 ML; (d, h) STEM simulations of configurations at Θ = 1 ML. Adapted with permission from ref (89). Copyright 2013 Royal Society of Chemistry.
Figure 9
Figure 9
(a) HAADF-STEM image of AuCoFe triple-layer core@shell NPs, (b, c) EELS elemental maps for (b) Co and (c) Fe, and (d) EELS spectra at the areas indicated in (a). Adapted with permission from ref (91). Copyright 2011 Tsinghua University Press and Springer.
Figure 10
Figure 10
(a) TEM image of PdZn@Pb0.25 TMNPs. (b) Size distribution of the TMNPs. (c) HRTEM image of a single nanoparticle. (d) Further magnification of the region denoted by the red square in (c), highlighting the lattice fringes on the (010) plane. (e) Fast Fourier transform of the single nanoparticle. Adapted from ref (165). Copyright 2019 American Chemical Society.
Figure 11
Figure 11
Schematic displaying the formation of PtRuCu nanoframes via formation of the nanoparticle and subsequent etching to form the hollow frame. Adapted with permission from ref (175). Copyright 2020 Royal Society of Chemistry.
Figure 12
Figure 12
Activities and product distributions on Fe–Zn–0.81Na, Fe–Zn, and Fe catalysts. Reaction conditions: catalyst (20 mg), 340 °C, 2.0 MPa, syngas (6:16:2:1 CO/H2:/CO2/Ar, 20 mL min–1). Reproduced with permission from ref (197). Copyright 2016 Wiley-VCH.
Figure 13
Figure 13
Active sites for CO hydrogenation on Rh–Mn and Rh–Fe active sites and product distributions for various Rh–xFe–yMn catalysts tested for syngas conversion. Reproduced from ref (198). Copyright 2017 American Chemical Society.
Figure 14
Figure 14
(a) Catalytic performance data for PdZn with several third metals added via galvanic replacement. (b) Conversion of phenylacetylene as a function of reaction time under the reaction conditions, treated at 673 K. Data for an unsupported PdZn0.75Pb0.25 alloy are provided for comparison. Corresponding TOF values are given in brackets. Adapted from ref (165). Copyright 2019 American Chemical Society.
Figure 15
Figure 15
(a) Volumes of H2 gas generated as functions of reaction time from the dehydrogenation of FA over MMNP (Pd/C, Ag/C, Ni/C), BMNP (Pd0.55 Ni0.45/C, Pd0.52 Ag0.48/C, Ni0.58Ag0.42/C), and TMNP (Pd0.74Ni0.12Ag0.14/C, Pd 0.42Ni0.36Ag0.22/C, Pd0.40Ni0.16Ag0.44/C, Pd0.18Ni0.38Ag0.44/C) catalysts. Reaction conditions: [metal] = 2.85 mM and [FA] = [SF] = 0.175 M in 10.0 mL of aqueous solution at 323 K. (b) HRTEM images of PdNiAg/C. (c) Elemental distribution of components in the PdNiAg NPs obtained by line-scan analysis using STEM-EDX along the white arrow in the HAADF-STEM image of PdNiAg/C given in the inset. Adapted with permission from ref (27). Copyright 2014 Elsevier.
Figure 16
Figure 16
Illustration of the catalytic activity as a function of composition of TMNPs through measurements of gas generation from the dehydrogenation of FA (0.5 M, 10.0 mL) catalyzed by (a) Nix(Au0.25Pd0.75)1.0–x/C with different x values and (b) Ni0.40(AuyPd1.0–y)0.60/C with different y values at 298 K under ambient atmosphere (nmetal/nFA = 0.02, reaction time = 1 h). Adapted with permission from ref (77). Copyright 2014 Elsevier.
Figure 17
Figure 17
Optimized structures of (A) HCOO, (B) HCOOHu, (C) HCOOHd, (D) COOHu, and (E) COOHd adsorbed on different sites in the center area of Au@2 ML Pd@0.5 ML Pt NPs. A key is provided at the top left. Adapted with permission from ref (245). Copyright 2013 The PCCP Owner Societies.
Figure 18
Figure 18
Schematic adsorption areas at (A) the center of a Pd facet and (B) the edge of a Pd/Pt moiety for various adsorption sites (i.e., bridge, FCC, HCP, and top from left to right) and optimized structures of CO adsorbed on Au@2 ML Pd@0.5 ML Pt NPs. A key is provided in the top left corner. Adapted with permission from ref (245). Copyright 2013 The PCCP Owner Societies.
Figure 19
Figure 19
(a) Plots of H2 generation vs time and (b) the corresponding TOFs (molH2 molM–1 min–1) for the ammonia borane hydrolysis reaction at 298 K catalyzed by trimetallic Pt–Au–Co catalysts with different compositions. (c, d) TEM images of Pt56Au4Co40 obtained after refluxing for 1 h and (e, f) the corresponding EDX data indicating the segregation of elements present due to high Co concentration, causing a reduction of catalytic activity. Adapted from ref (78). Copyright 2020 American Chemical Society.
Figure 20
Figure 20
(a) Illustration of potential electronic charge transfer routes in PVP-protected Au/Ag and Au/Pt/Ag NPs. (b) Metal time yield (MTY, in units of moles of glucose per hour per mole of metal) over TMNPs with different compositions, highlighting the advantages of an optimized metal ratio according to improved charge transfer. Adapted from ref (277). Copyright 2011 American Chemical Society.
Figure 21
Figure 21
(a) Catalytic activities of Pd, Pt, Au, Pt75Pd25, Au60Pt40, Au60Pd40, and Au60Pt30Pd10. The corresponding mean diameters of the nanoparticles are shown. (b) Catalytic activities of AuPtPd nanoparticles with Au fractions of 60, 70, 80, and 90%. (c) Catalytic activities of AuPtPd nanoparticles with 60% Au. Adapted with permission from ref (80). Copyright 2013 Elsevier.
Figure 22
Figure 22
Ternary contour maps of (a) calculated average Au–Pd, Au–Pt, and Pd–Pt distances (in Å) for AuxPdyPtz (x + y + z = 7) clusters and (b) calculated O–O distances (in Å) in AuxPdyPtz–O2 (x + y + z = 7) clusters as functions of the atomic composition. Adapted from ref (278). Copyright 2017 American Chemical Society.
Figure 23
Figure 23
(a) Cyclic voltammograms obtained for the methanol oxidation reaction in N2-saturated aqueous HClO4 over PtRuCu nanoframes and carbon-supported PtRuCu and Pt NPs. (b) Mass activities of the catalysts. (c) Specific activities, with peak current density on the left and mass activity on the right. (d) Durability comparison following 800 CV cycles. Adapted with permission from ref (175). Copyright 2020 Chinese Chemical Society, Institute of Chemistry of the Chinese Academy of Sciences, and Royal Society of Chemistry.
Figure 24
Figure 24
Characterization of the Au@PdPt TMNP electrooxidation catalyst. (a) HAADF-STEM image and cross-sectional compositional line profiles of an Auoct@PdPt NP. The scale bar indicates 20 nm. (b) HAADF-STEM-EDX elemental mapping images of an Auoct@PdPt NP. (c) CVs of Auoct@PdPt NPs, Ausph@PdPt NPs, dendritic Pd–Pt alloy NPs, and Pt/C catalysts in 0.1 M HClO4 + 0.5 M methanol. Scan rate = 50 mV s–1. (d) Chronoamperometry curves for the various catalysts in 0.1 M HClO4 + 0.5 M methanol at 0.6 V vs Ag/AgCl. Adapted from ref (79). Copyright 2013 American Chemical Society.
Figure 25
Figure 25
Cyclic voltammetry measurements and current density–time curves in the ethanol electrooxidation reaction. (a) CVs of the three trimetallic catalysts on electrodes under basic conditions. (b) Current density–time curves for the three trimetallic catalysts in a 0.5 M NaOH + 1 M ethanol solution at 0.2 V. (c) CVs of bimetallic Pt11Pd89 and Au27Pd73 as well as Au17Pt24Pd59 and commercial E-TEK Pd/C electrodes. (d) Current density–time curves of the bimetallic compositions, Au17Pt24Pd59, and commercial E-TEK Pd/C electrodes at 0.2 V. Adapted with permission from ref (177). Copyright 2012 Royal Society of Chemistry.
Figure 26
Figure 26
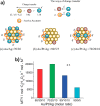
Mass activities of the Pt/C, FePt3/C, and Au@FePt3/C catalysts before and after 60 000 potential cycles between 0.6 and 1.1 V vs RHE in oxygen-saturated 0.1 M HClO4 electrolyte at 20 °C with a sweep rate of 50 mV/s. Adapted from ref (347). Copyright 2010 American Chemical Society.
Figure 27
Figure 27
Pt d-band center and adsorption energies of O2 and O atoms in the Pd13–nNin@Pt42 (n = 0, 1, 12, 13) NPs. Adapted with permission from ref (357). Copyright 2017 Elsevier.
Figure 28
Figure 28
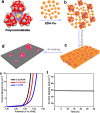
Schematic illustration of the synthesis of trimetallic clusters. (a) Space-filling representation of the structure of polyoxometalates (POMs). (b) Self-assembly of POMs and ethylenediamine-grafted C60 (EDA-C60) driven by electrostatic interactions. (c) Schematic structure of the POMs/EDA-C60 composites after freeze-drying. (d) Trimetallic clusters on a carbonic support. O, gray; Co/Fe, violet; W, red; P, yellow. (e) OER polarization curves of BNMP and TMNP catalysts loaded on gold foam (scan rate of 5 mV s–1 without iR correction). (f) Current density vs time for 3-CoFeW loaded on gold foam for 30 h at a constant applied potential of 1.46 V vs RHE for the OER. Adapted from ref (361). Copyright 2018 American Chemical Society.
Figure 29
Figure 29
(A–C) Elemental maps of (A) bimetallic Ru–Ni NPs, (B) Ru-4 (RuRhCoNi), and (C) Ru-5 (RuRhCoNiIr) supported on carbon nanofibers. (D–F) FT-EXAFS spectra of (D) Ru in Ru-5, (E) Ni in Ru-5, and (F) Ru, Rh, Co, Ni, and Ir in Ru-5. (G–I) HAADF-STEM images of Ru, Ru-4, and Ru-5 MEA-NPs, respectively. From ref (385). CC BY-NC 4.0.

Similar articles

Cited by

References

    1. Chalmin E.; Menu M.; Vignaud C. Analysis of Rock Art Painting and Technology of Palaeolithic Painters. Meas. Sci. Technol. 2003, 14, 1590–1597. 10.1088/0957-0233/14/9/310. - DOI
    1. Mohan Bhagyaraj S.; Oluwafemi O. S.. Nanotechnology: The Science of the Invisible. In Synthesis of Inorganic Nanomaterials; Elsevier, 2018; pp 1–18.10.1016/B978-0-08-101975-7.00001-4. - DOI
    1. Brun N.; Mazerolles L.; Pernot M. Microstructure of Opaque Red Glass Containing Copper. J. Mater. Sci. Lett. 1991, 10, 1418–1420. 10.1007/BF00735696. - DOI
    1. Khawaji M.; Chadwick D. Selective Catalytic Oxidation over Au-Pd/Titanate Nanotubes and the Influence of the Catalyst Preparation Method on the Activity. Catal. Today 2019, 334, 122–130. 10.1016/j.cattod.2018.11.080. - DOI
    1. Sun Y.; Mayers B.; Xia Y. Metal Nanostructures with Hollow Interiors. Adv. Mater. 2003, 15, 641–646. 10.1002/adma.200301639. - DOI

Publication types