. 2022 Mar 11;8(10):eabi4797.
doi: 10.1126/sciadv.abi4797. Epub 2022 Mar 9.

Mediobasal hypothalamic FKBP51 acts as a molecular switch linking autophagy to whole-body metabolism

Affiliations

Mediobasal hypothalamic FKBP51 acts as a molecular switch linking autophagy to whole-body metabolism

Alexander S Häusl et al. Sci Adv. .

Abstract

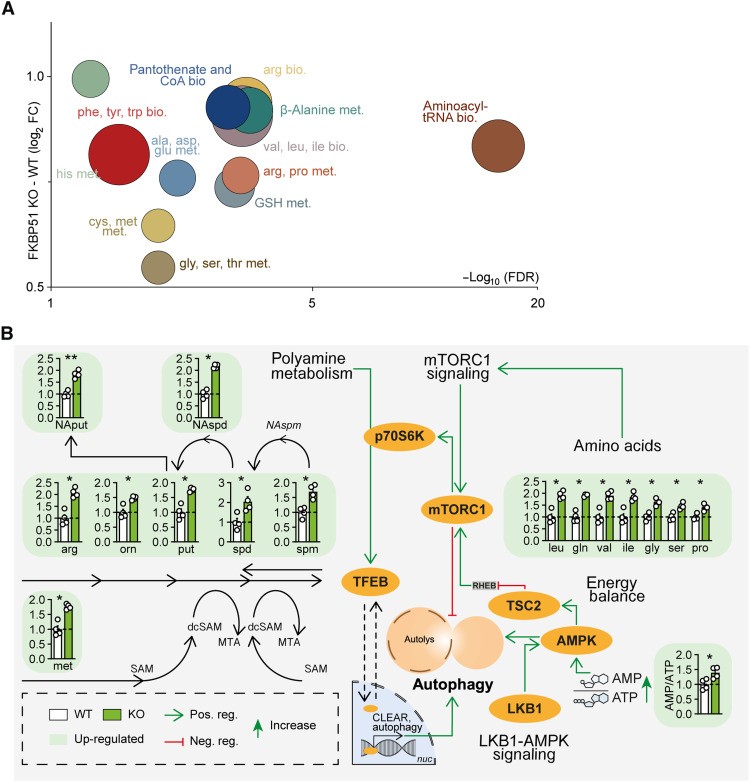
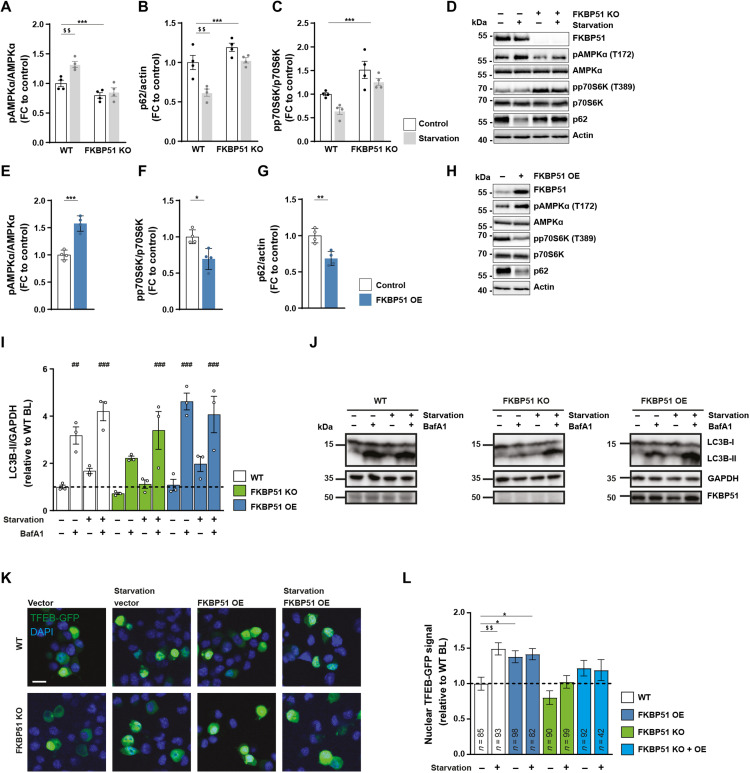
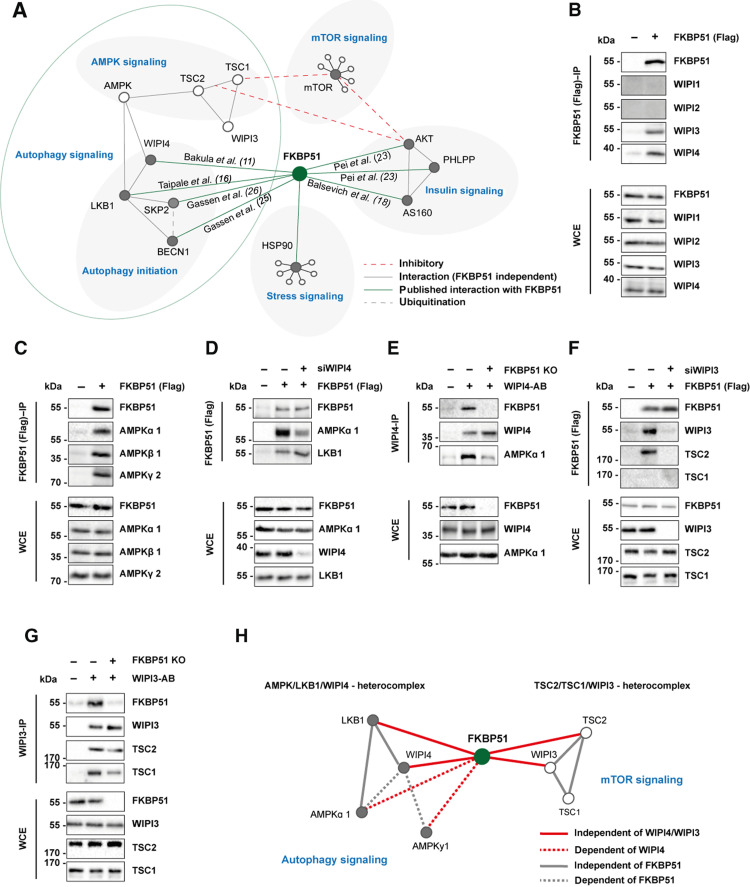
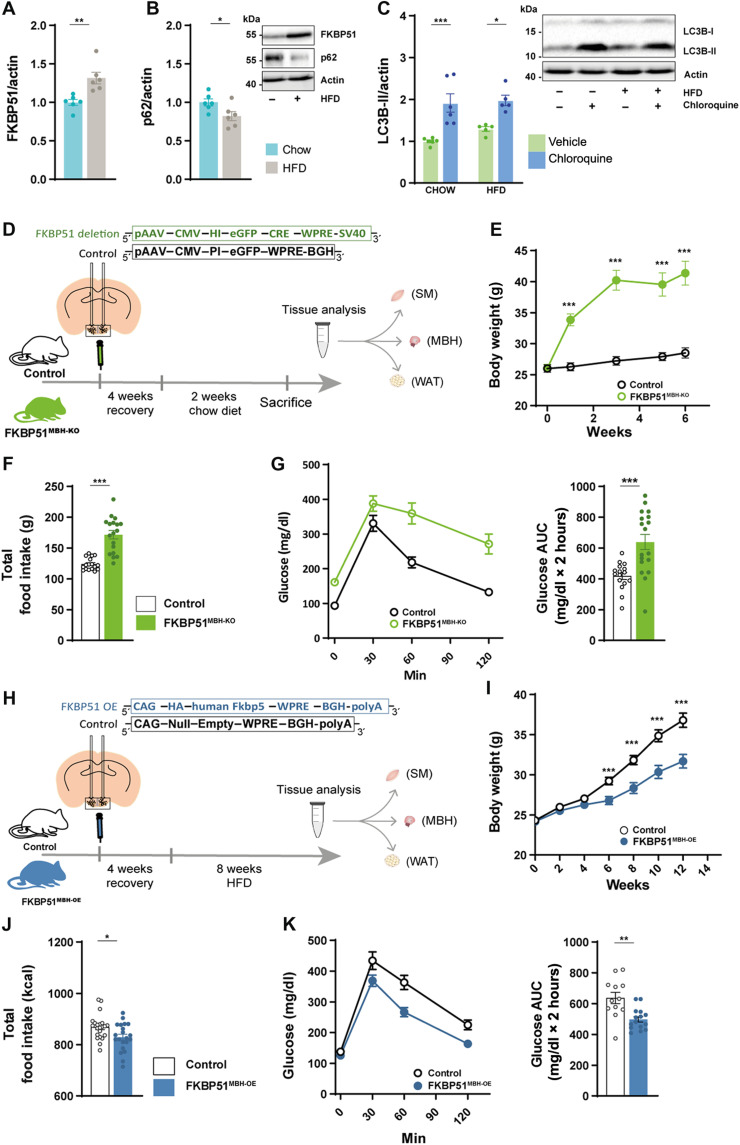
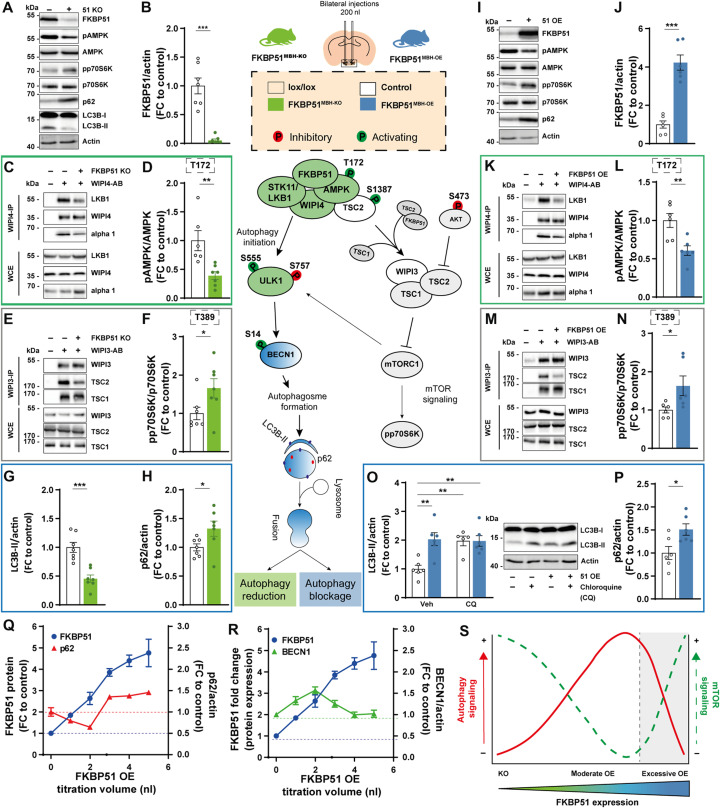
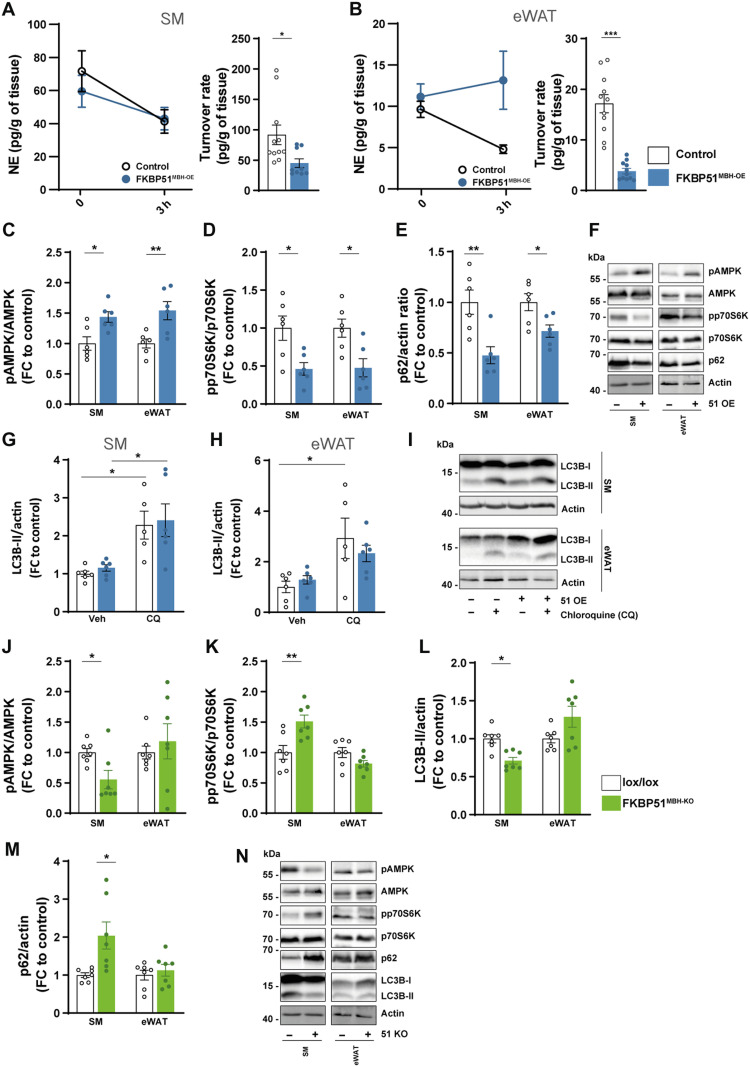
The mediobasal hypothalamus (MBH) is the central region in the physiological response to metabolic stress. The FK506-binding protein 51 (FKBP51) is a major modulator of the stress response and has recently emerged as a scaffolder regulating metabolic and autophagy pathways. However, the detailed protein-protein interactions linking FKBP51 to autophagy upon metabolic challenges remain elusive. We performed mass spectrometry-based metabolomics of FKBP51 knockout (KO) cells revealing an increased amino acid and polyamine metabolism. We identified FKBP51 as a central nexus for the recruitment of the LKB1/AMPK complex to WIPI4 and TSC2 to WIPI3, thereby regulating the balance between autophagy and mTOR signaling in response to metabolic challenges. Furthermore, we demonstrated that MBH FKBP51 deletion strongly induces obesity, while its overexpression protects against high-fat diet (HFD)-induced obesity. Our study provides an important novel regulatory function of MBH FKBP51 within the stress-adapted autophagy response to metabolic challenges.


Figures

Fig. 1.
Fig. 1.. FKBP51 associates with amino acids and polyamine biosynthesis pathways.
(A) Analysis and regulation of significantly altered pathways of FKBP51 KO and WT cells. The f(x) axis shows the (median) log2 fold change (FC) of all significantly altered metabolites of the indicated pathway, and the false discovery rate (FDR) (equals the −log10–adjusted P value) is shown on the x axis. The size of the circles represents the amount of significantly changed metabolites in comparison to all metabolites of a particular pathway. tRNA, transfer RNA. (B) FKBP51 deletion increases metabolites of the polyamine pathway, the AMP/ATP ratio, and enhances levels of amino acids associated with mTOR signaling. Data in (B) are shown as means + SEM and were analyzed by a two-way analysis of variance (ANOVA) and a subsequent Bonferroni multiple comparison analysis. ala, alanine; AMPK, AMP-activated protein kinase; arg, arginine; asp, asparagine; bio., biosynthesis; CoA, coenzyme A; cys, cysteine; dcSAM, decarboxylated S-adenosylmethione; gln, glutamine; glu, glutamic acid; gly, glycine; GSH, glutathione (reduced); his, histidine; ile, isoleucine; leu, leucine; LKB1, liver kinase B1; met, methionine; met., metabolism; MTA, 5′-methylthioadenosine; mTORC1, mechanistic target of rapamycin complex 1; NAput, N-acetylputrescine; NAspd, N-acetylspermidine; NAspm, N- acetylspermine; orn, ornithine pro, proline; phe, phenylalanine; put, putrescine; SAM, S- adenosylmethionine; ser, serine; spd, spermidine; spm, spermine; TFEB, transcription factor EB; TSC2, tuberous sclerosis complex 2; thr, threonine; trp, tryptophan; tyr, tyrosine; val, valine. *P < 0.05, **P < 0.01.
Fig. 2.
Fig. 2.. FKBP51 regulates AMPK and mTOR activity following nutrient deprivation.
(A) WT or FKBP51 KO cells were starved in HBSS medium for 4 hours to induce autophagy, followed by quantification of pAMPKα (T172), (B) p62, and (C) pp70S6K (T389). Representative blots are shown in (D). FKBP51 overexpression (FKBP51 OE) in N2a cells (see fig. S3D for validation) enhanced autophagy signaling. Quantification of (E) pAMPKα (T172), (F) pp70S6K (T389), (G) p62, and (H) representative blots. (I) Quantification of autophagic flux in FKBP51 KO and FKBP51 OE cells in response to starvation. GAPDH, glyceraldehyde-3-phosphate dehydrogenase. (J) Representative blots of autophagic flux measurements. (K) Representative pictures of TFEB nuclear localization/translocation. DAPI, 4′,6-diamidino-2-phenylindole. Scale bar, 10 μm. (L) Quantification of TFEB reporter assay. BL, baseline. All data (A to J) are shown as relative fold change compared to control condition; ± SEM; *P < 0.05, **P < 0.01, ***P < 0.001; ##P < 0.01, ###P < 0.001; $$P < 0.01. Two-way ANOVA was performed in (A) to (C) and followed by a Tukey’s multiple comparisons test. One-way ANOVA was performed for (I) and (L), followed by a Dunnett’s multiple comparison test. The unpaired Student’s t test was performed for (E) to (G). *, significant genotype effect; $, significant starvation effect; #, significant treatment effect.
Fig. 3.
Fig. 3.. FKBP51 associates with AMPK, TSC2, and WIPI3 and WIPI4 to regulate autophagy and mTOR signaling.
(A) Published protein-protein interactions of FKBP51. (B) FKBP51 associates with WIPI3 and WIPI4, but not with WIPI1 and WIPI2. WCE, whole-cell extract; IP, immunoprecipitation. (C) Interaction of FKBP51 with AMPK subunits. (D) Interaction of FKBP51 with LKB1 and AMPKα in WIPI4 KD cells. (E) Interaction of WIPI4 with AMPKα in FKBP51-lacking cells. (F) FKBP51 interacts with TSC2 in dependency of WIPI3. (G) WIPI3 interacts with TSC2 and TSC1 in the presence or absence of FKBP51. (H) Identified associations of FKBP51 in the regulation of autophagy and mTOR signaling and the proposed model of interaction. FKBP51 recruits LKB1 to the AMPK-WIPI4 complex and thereby facilitates AMPK activation. Furthermore, FKBP51 scaffolds TSC2-WIPI3 binding to alter mTOR signaling. AB, antibody.
Fig. 4.
Fig. 4.. MBH FKBP51 regulates body weight gain, food intake and glucose metabolism.
(A) Ten weeks of HFD increased hypothalamic FKBP51 in the MBH [n (chow) = 6 versus n (HFD) = 6]. (B) Effects of HFD on the accumulation of p62. (C) Treatment with chloroquine (50 mg/kg) increased LC3B-II level under chow and HFD conditions. (D) FKBP51lox/lox animals were injected with 200 nl of Cre-expressing virus and fed a chow diet for 6 weeks. (E) FKBP51MBH-KO showed significant body weight increase after virus injection on a regular chow diet. (F) FKBP51MBH-KO animals showed increased food intake and (G) enhanced glucose intolerance. AUC, area under the curve. (H) For FKBP51 overexpression, animals were injected with an AAV virus into the MBH. (I) FKBP51MBH-OE animals showed reduced body weight gain on an HFD diet compared to their control animals (J) FKBP51MBH-OE animals showed reduced food intake. (K) FKBP51MBH-OE animals showed improve glucose tolerance under HFD conditions. For (A), (B), (F), (G), (J), and (K), an unpaired Student’s t test was performed. For (C), a two-way ANOVA was performed, followed by a Tukey’s multiple comparison test. For (E) and (I), a repeated measurements ANOVA was performed. ± SEM; *P < 0.05, **P < 0.01, and ***P < 0.001.
Fig. 5.
Fig. 5.. MBH FKBP51 regulates autophagy in an inversed U-shaped manner.
FKBP51 deletion is depicted in green, and FKBP51 overexpression is depicted in blue. (A) Representative blots of autophagy and mTOR markers in FKBP51MBH-KO mice. (B) Quantification of FKBP51 deletion. (C) FKBP51 deletion reduced LKB1 and AMPK binding to WIPI4 as well as (D) AMPK phosphorylation at T172. (E) TSC2-WIPI3 binding was decreased in FKBP51MBH-KO animals. (F) Quantification of mTOR substrate pp70S6K (T389). (G) LC3B-II and (H) p62 levels in the MBH. (I) Representative blots of autophagy and mTOR marker in FKBP51MBH-OE mice. (J) Quantification of viral FKBP51 overexpression. (K) FKBP51 overexpression reduced LKB1 and AMPK binding to WIPI4. (L) Quantification of AMPK phosphorylation at T172. (M) TSC2-WIPI3 binding was decreased. (N) Quantification of pp70S6K phosphorylation at T389. (O) To assess autophagic flux FKBP51MBH-OE, animals were treated with chloroquine (50 mg/kg), and LC3B-II levels were analyzed 4 hours after treatment. (P) FKBP51 overexpression blocked autophagic flux and resulted in an accumulation of p62. (Q and R) Quantification of FKBP51, p62, and BECN1, while titrating AAV-HA-FKBP51 virus into mouse neuroblastoma cells. (S) MBH FKBP51 regulates autophagy and mTOR signaling in a dose-dependent manner. All data are shown as ±SEM. Data are shown as the relative protein expression compared to control; for (A) to (N), an unpaired Student’s t test was performed. *P < 0.05, **P < 0.01, and ***P < 0.001.
Fig. 6.
Fig. 6.. MBH FKBP51 affects sympathetic outflow and peripheral autophagy signaling.
FKBP51 overexpression is depicted in blue, and FKBP51 deletion is depicted in green. (A and B) Representative decrease in tissue NE content after α-MPT injection (left) and turnover rate (right) were determined on SM and eWAT (see fig. S8 for pancreas, heart, iWAT, and BAT tissues). Quantification of (C) pAMPK (T172) and (D) pp70S6K (T389), and (E) p62 level in the SM and eWAT. (F) Representative blots. (G to H) FKBP51 overexpression increased autophagic flux and in SM and eWAT. (I) Representative blots of chloroquine the experiment. Quantification of (J) pAMPK (T172), (K) pp70S6K (T389), (L) LC3B-II, and (M) p62 levels in SM and eWAT in animals lacking FKBP51 in the MBH. (N) Representative blots of FKBP51MBH-KO protein analysis. All data are shown as ±SEM. Protein data are shown as the relative protein expression compared to control. A two-way ANOVA was performed, followed by a Tukey’s multiple comparison test in (F) and (G). For (A) to (E) and (I) to (L), an unpaired Student’s t test was performed. *P < 0.05, **P < 0.01, and ***P < 0.001.

Similar articles

Cited by

References

    1. Morton G. J., Meek T. H., Schwartz M. W., Neurobiology of food intake in health and disease. Nat. Rev. Neurosci. 15, 367–378 (2014). - PMC - PubMed
    1. Galluzzi L., Bravo-San Pedro J. M., Levine B., Green D. R., Kroemer G., Pharmacological modulation of autophagy: Therapeutic potential and persisting obstacles. Nat. Rev. Drug Discov. 16, 487–511 (2017). - PMC - PubMed
    1. Zhang Y., Sowers J. R., Ren J., Targeting autophagy in obesity: From pathophysiology to management. Nat. Rev. Endocrinol. 14, 356–376 (2018). - PubMed
    1. Rabinowitz J. D., White E., Autophagy and metabolism. Science 330, 1344–1348 (2010). - PMC - PubMed
    1. Levine B., Kroemer G., Biological functions of autophagy genes: A disease perspective. Cell 176, 11–42 (2019). - PMC - PubMed

Publication types

Substances