Limiting factors for queen conch (Lobatus gigas) reproduction: A simulation-based evaluation
- PMID: 35263325
- PMCID: PMC8906866
- DOI: 10.1371/journal.pone.0251219
Limiting factors for queen conch (Lobatus gigas) reproduction: A simulation-based evaluation
Abstract
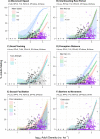
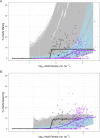
Queen conch are among the most economically, socially, and culturally important fishery resources in the Caribbean. Despite a multitude of fisheries management measures enacted across the region, populations are depleted and failing to recover. It is believed that queen conch are highly susceptible to depensatory processes, impacting reproductive success and contributing to the lack of recovery. We developed a model of reproductive dynamics to evaluate how variations in biological factors such as population density, movement speeds, rest periods between mating events, scent tracking, visual perception of conspecifics, sexual facilitation, and barriers to movement affect reproductive success and overall reproductive output. We compared simulation results to empirical observations of mating and spawning frequencies from conch populations in the central Bahamas and Florida Keys. Our results confirm that low probability of mate finding associated with decreased population density is the primary driver behind observed breeding behavior in the field, but is insufficient to explain observed trends. Specifically, sexual facilitation coupled with differences in movement speeds and ability to perceive conspecifics may explain the observed lack of mating at low densities and differences between mating frequencies in the central Bahamas and Florida Keys, respectively. Our simulations suggest that effective management strategies for queen conch should aim to protect high-density reproductive aggregations and critical breeding habitats.
Conflict of interest statement
The authors have declared that no competing interests exist.
Figures


Similar articles
-
[Density, size structure and reproductive activity of the pink conch Eustrombus gigas (Mesogastropoda: Strombidae) in Banco Chinchorro, Mexico].Rev Biol Trop. 2013 Dec;61(4):1657-69. Rev Biol Trop. 2013. PMID: 24432526 Spanish.
-
Pathology and reproductive health of queen conch (Lobatus gigas) in St. Kitts.J Invertebr Pathol. 2018 Jun;155:32-37. doi: 10.1016/j.jip.2018.04.007. Epub 2018 Apr 24. J Invertebr Pathol. 2018. PMID: 29702106
-
Queen conch (Strombus gigas) testis regresses during the reproductive season at nearshore sites in the Florida Keys.PLoS One. 2010 Sep 15;5(9):e12737. doi: 10.1371/journal.pone.0012737. PLoS One. 2010. PMID: 20856805 Free PMC article.
-
Putative Drone Copulation Factors Regulating Honey Bee (Apis mellifera) Queen Reproduction and Health: A Review.Insects. 2019 Jan 8;10(1):8. doi: 10.3390/insects10010008. Insects. 2019. PMID: 30626022 Free PMC article. Review.
-
An integrative view of sexual selection in Tribolium flour beetles.Biol Rev Camb Philos Soc. 2008 May;83(2):151-71. doi: 10.1111/j.1469-185X.2008.00037.x. Biol Rev Camb Philos Soc. 2008. PMID: 18429767 Review.
References
-
- Randall JE. Contributions to the biology of the queen conch, Strombus gigas. Bull Mar Sci. 1964; 14:246–295.
-
- Martín-Mora E, James FC, Stoner AW. Developmental plasticity in the shell of the queen conch Strombus gigas. Ecology. 1995; 76(3):981–994.
-
- McCarthy K. A review of queen conch (Strombus gigas) life history. NOAA National Marine Fisheries Service, Miami, FL. 2007.
-
- Cala de la Hera YR, de Jesús-Navarrete A, Oliva-Rivera JJ, Ocaña-Borrego FA. Auto-ecology of the queen conch (Strombus gigas L. 1758) at Cabo Cruz, Eastern Cuba: management and sustainable use implications. Proc Gulf Carib Fish Inst. 2012; 64:342–348.
-
- Stoner AW, Sandt VJ. Population structure, seasonal movements and feeding of queen conch, Strombus gigas, in deep-water habitats of the Bahamas. Bull Mar Sci. 1992; 51(3):287–300.
MeSH terms
LinkOut - more resources
Full Text Sources

