. 2022 Mar 9;17(3):e0261045.
doi: 10.1371/journal.pone.0261045. eCollection 2022.

Coronavirus Resistance Database (CoV-RDB): SARS-CoV-2 susceptibility to monoclonal antibodies, convalescent plasma, and plasma from vaccinated persons

Affiliations

Coronavirus Resistance Database (CoV-RDB): SARS-CoV-2 susceptibility to monoclonal antibodies, convalescent plasma, and plasma from vaccinated persons

Philip L Tzou et al. PLoS One. .

Abstract

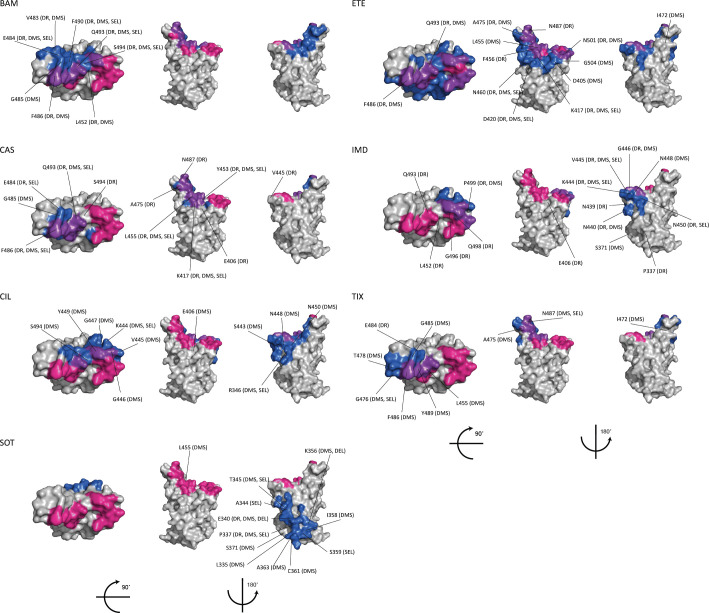
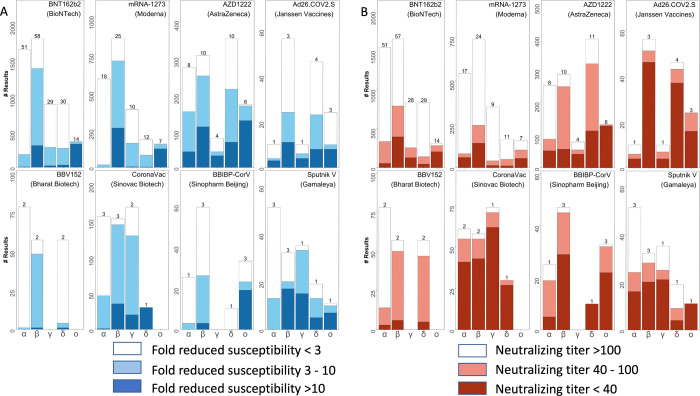
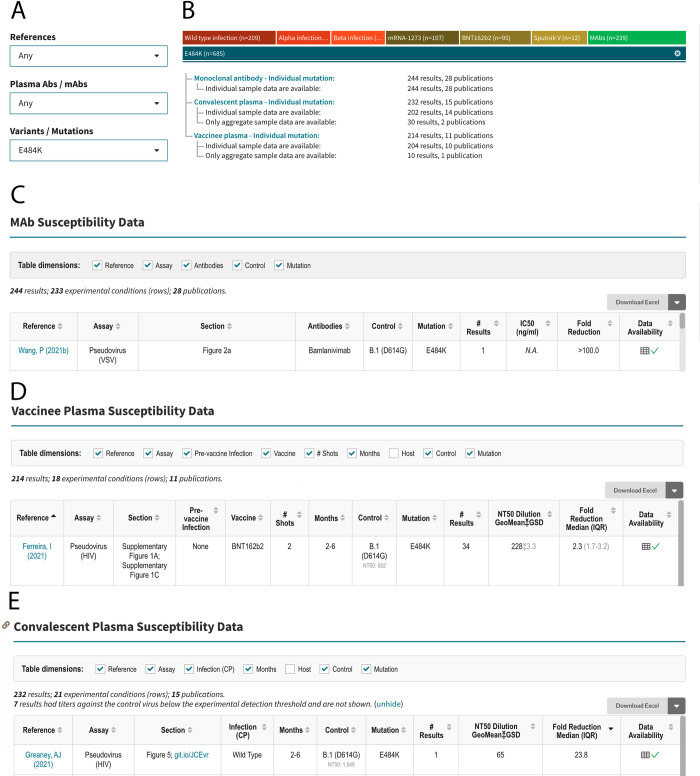
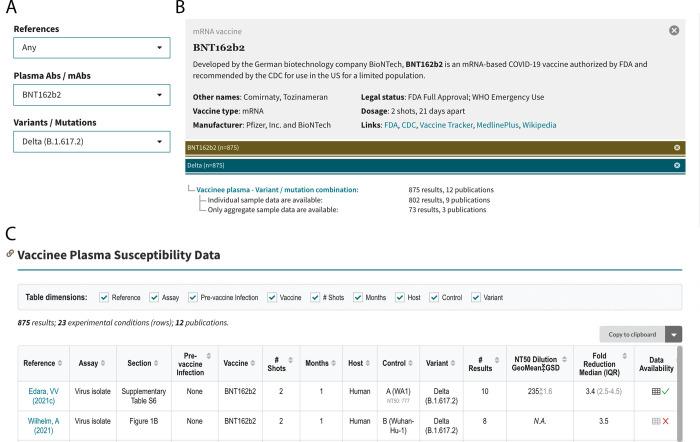
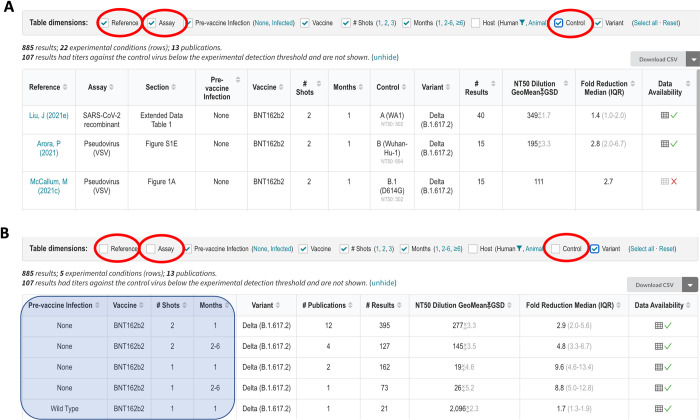
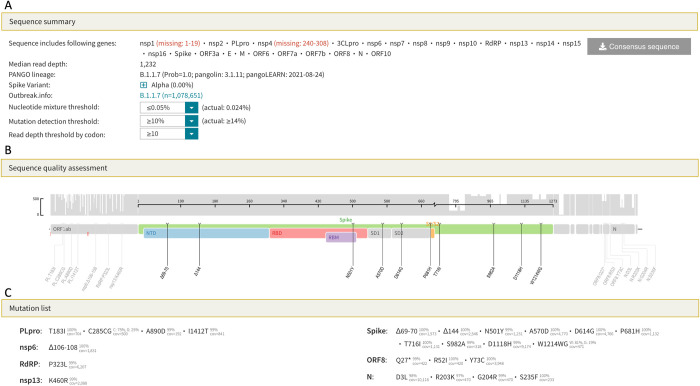
As novel SARS-CoV-2 variants with different patterns of spike protein mutations have emerged, the susceptibility of these variants to neutralization by antibodies has been rapidly assessed. However, neutralization data are generated using different approaches and are scattered across different publications making it difficult for these data to be located and synthesized. The Stanford Coronavirus Resistance Database (CoV-RDB; https://covdb.stanford.edu) is designed to house comprehensively curated published data on the neutralizing susceptibility of SARS-CoV-2 variants and spike mutations to monoclonal antibodies (mAbs), convalescent plasma (CP), and vaccinee plasma (VP). As of December 31, 2021, CoV-RDB encompassed 257 publications including 91 (35%) containing 9,070 neutralizing mAb susceptibility results, 131 (51%) containing 16,773 neutralizing CP susceptibility results, and 178 (69%) containing 33,540 neutralizing VP results. The database also records which spike mutations are selected during in vitro passage of SARS-CoV-2 in the presence of mAbs and which emerge in persons receiving mAbs as treatment. The CoV-RDB interface interactively displays neutralizing susceptibility data at different levels of granularity by filtering and/or aggregating query results according to one or more experimental conditions. The CoV-RDB website provides a companion sequence analysis program that outputs information about mutations present in a submitted sequence and that also assists users in determining the appropriate mutation-detection thresholds for identifying non-consensus amino acids. The most recent data underlying the CoV-RDB can be downloaded in its entirety from a GitHub repository in a documented machine-readable format.


Conflict of interest statement

R.W.S. has received grant funding from Janssen Pharmaceuticals, Vela Diagnostics and Insilixa; and honoraria from Gilead Sciences and GlaxoSmithKline (GSK). This does not alter our adherence to PLOS ONE policies on sharing data and materials.

Figures

Fig 1
Fig 1. Monoclonal Antibodies (mAbs) with EUAs or in advanced clinical development: Receptor Binding Domain (RBD) epitopes and immune escape positions.
For each mAb, the top of the RBD and two side views are depicted using coordinates from PDB 6M0J. ACE2 binding residues are shown in red; the mAb epitope defined as those residues within 4.5 angstroms of the mAb paratope is shown in dark blue; and ACE2 binding residues within the mAb epitope are shown in purple. Those positions containing mutations that were either selected by the mAb in vitro (“SEL”), reduced binding in a deep mutational scanning assay (“DMS”), and/or reduced in vitro neutralizing susceptibility by a median of ≥4-fold in CoV-RDB (drug resistance; “DR”) are also indicated. The mAb epitopes for BAM (bamlanivimab), ETE (etesevimab), CAS (casirivimab), IMD (imdevimab), SOT (sotrovirmab), CIL (cilgavimab) and TIX (tixagevimab) were determined from their PDB structures.
Fig 2
Fig 2
Distribution of fold-reduction in susceptibilities (A) and of absolute neutralizing titers (B) of vaccinee plasma (VP) associated with eight vaccines to the five variants of concern (VOC): Alpha, Beta, Gamma, Delta, and Omicron. The X axes indicate the Greek letter associated with each VOC. The Y axes indicate the number of neutralizing assays. The numbers above the stacked bars indicate the number of studies reporting the experimental results. The figure includes VP obtained solely from previously uninfected persons one month after receiving completing initial vaccination.
Fig 3
Fig 3. Query interface, sample query, and outline of query results for an example query for the SARS-CoV-2 RBD mutation E484K.
The query interface containing three dropdown boxes is shown at the upper left (A). E484K is selected from the “Variants / Mutations” dropdown box. The upper right summarizes the data returned by the query, which in this case includes 244 mAb neutralizing susceptibility results from 28 publications, 232 convalescent plasma (CP) results from 15 publications, and 214 vaccinee plasma (VP) results from 11 publications (B). The summary distinguishes between results for which only aggregate (mean or median) data are provided and results for which individual data are provided. The sections below show the headers and first row of the tables containing mAb (C), VP (D), and CP (E) susceptibility results. The figure was modified from a screenshot captured in October 2021. The updated and complete contents of these tables can be found on the web (https://covdb.stanford.edu/search-drdb/?host=human&mutations=S%3A484K).
Fig 4
Fig 4. Query interface, sample query, and outline of query results for an example query for the susceptibility of the SARS-CoV-2 Delta variant to the vaccinee plasma (VP) of persons who received the BNT162b2 vaccine.
The query interface containing three dropdown boxes is shown at the upper left (A). BNT162b2 is selected from the “Plasma / mAbs” dropdown box, and the Delta variant is selected from the “Variants / Mutations” dropdown box. The upper right summarizes the data returned by the query, which in this case includes 875 results from 12 publications (B). The summary distinguishes between results for which only aggregate (mean or median) data are provided and results for which individual data are provided. The section below the header shows the header and first few rows of the table entitled “Vaccinee Plasma Susceptibility Data” (C). The figure was modified from a screenshot captured in October 2021. The updated and complete contents of this table can be found on the web (https://covdb.stanford.edu/search-drdb/?host=human&vaccine=BNT162b2&variant=Delta).
Fig 5
Fig 5. Aggregating the query results for the example shown in Fig 4.
The top part of the figure shows the first three of 22 experimental conditions defined by the column headers in which BNT162b2-associated VP was tested for activity against the Delta variant (A). The results for each experimental condition are shown in different rows each containing the geometric mean of the neutralizing antibody titer and the median fold-reduction in titer compared with a control virus. The bottom part of the figure shows that the 22 rows can be displayed using 5 rows by aggregating those results obtained from different references using different assays or different control viruses by deselecting the “Reference”, “Assay”, and “Control” variant (checkboxes within red ovals). The neutralization data are now aggregated according to the number of BNT162b2 immunizations, time since immunization, and whether the VP was obtained from a person who had been infected prior to vaccination (shaded area superimposed on the first four columns). The number of experimental results in each row in Fig 5B is increased because each row may now contain data from more than one reference.
Fig 6
Fig 6. SARS-CoV-2 sequence analysis program output for FASTQ sequences or codon frequency tables.
The sequence summary section (A) lists the genes that were sequenced, the median read depth, and the PANGO lineage. This section also contains dropdown boxes that enable the user to select the minimum number and proportion of reads, respectively, required to identify a mutation. The threshold that minimizes the proportion of positions with nucleotide ambiguities can also be selected. The sequence quality assessment section displays the read depth across the genome and lists only those amino acid mutations that meet the user-defined criteria specified in the sequence summary section (B). The mutation list section lists those amino acid mutations that meet the user-defined criteria and shows the proportion of reads containing the mutation (C). The output shown in this figure can be regenerated by loading the example file B.1.1.7 (ERR5026962) at this URL: https://covdb.stanford.edu/sierra/sars2/by-reads/.

References

    1. Tao K, Tzou PL, Nouhin J, Gupta RK, de Oliveira T, Kosakovsky Pond SL, et al. The biological and clinical significance of emerging SARS-CoV-2 variants. Nat Rev Genet. 2021. doi: 10.1038/s41576-021-00408-x - DOI - PMC - PubMed
    1. Wrapp D, Wang N, Corbett KS, Goldsmith JA, Hsieh C-L, Abiona O, et al. Cryo-EM structure of the 2019-nCoV spike in the prefusion conformation. Science. 2020;367: 1260–1263. doi: 10.1126/science.abb2507 - DOI - PMC - PubMed
    1. Walls AC, Park Y-J, Tortorici MA, Wall A, McGuire AT, Veesler D. Structure, Function, and Antigenicity of the SARS-CoV-2 Spike Glycoprotein. Cell. 2020;181: 281–292.e6. doi: 10.1016/j.cell.2020.02.058 - DOI - PMC - PubMed
    1. Lan J, Ge J, Yu J, Shan S, Zhou H, Fan S, et al. Structure of the SARS-CoV-2 spike receptor-binding domain bound to the ACE2 receptor. Nature. 2020;581: 215–220. doi: 10.1038/s41586-020-2180-5 - DOI - PubMed
    1. Shang J, Ye G, Shi K, Wan Y, Luo C, Aihara H, et al. Structural basis of receptor recognition by SARS-CoV-2. Nature. 2020;581: 221–224. doi: 10.1038/s41586-020-2179-y - DOI - PMC - PubMed

Publication types

Supplementary concepts