. 2022 May 24;34(6):2286-2308.
doi: 10.1093/plcell/koac073.

COP1 positively regulates ABA signaling during Arabidopsis seedling growth in darkness by mediating ABA-induced ABI5 accumulation

Affiliations

COP1 positively regulates ABA signaling during Arabidopsis seedling growth in darkness by mediating ABA-induced ABI5 accumulation

Jing Peng et al. Plant Cell. .

Abstract

CONSTITUTIVELY PHOTOMORPHOGENIC1 (COP1), a well-characterized E3 ubiquitin ligase, is a central repressor of seedling photomorphogenic development in darkness. However, whether COP1 is involved in modulating abscisic acid (ABA) signaling in darkness remains largely obscure. Here, we report that COP1 is a positive regulator of ABA signaling during Arabidopsis seedling growth in the dark. COP1 mediates ABA-induced accumulation of ABI5, a transcription factor playing a key role in ABA signaling, through transcriptional and post-translational regulatory mechanisms. We further show that COP1 physically interacts with ABA-hypersensitive DCAF1 (ABD1), a substrate receptor of the CUL4-DDB1 E3 ligase targeting ABI5 for degradation. Accordingly, COP1 directly ubiquitinates ABD1 in vitro, and negatively regulates ABD1 protein abundance in vivo in the dark but not in the light. Therefore, COP1 promotes ABI5 protein stability post-translationally in darkness by destabilizing ABD1 in response to ABA. Interestingly, we reveal that ABA induces the nuclear accumulation of COP1 in darkness, thus enhancing its activity in propagating the ABA signal. Together, our study uncovers that COP1 modulates ABA signaling during seedling growth in darkness by mediating ABA-induced ABI5 accumulation, demonstrating that plants adjust their ABA signaling mechanisms according to their light environment.


Figures

Figure 1
Figure 1
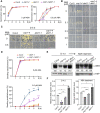
cop1 mutants are less sensitive to ABA-inhibited seedling growth in darkness. A, Germination rate measurements. Hydrated seeds for Col-0 and the cop1 mutants were sown on MS medium containing various concentrations of ABA, and then grown in darkness. Seed germination was defined as the first sign of radicle tip emergence and scored daily until day 6. Error bars represent the standard deviation (sd) of three independent sets of seeds, each set containing 50 seeds. *P < 0.05, **P < 0.01, and ***P < 0.001 (Student’s t test; Supplemental Data Set S1) for the indicated pairs of seeds. B, Growth of cop1 seedlings is insensitive to ABA. Col-0 and cop1 seedlings were grown vertically on MS medium with the indicated ABA concentrations in darkness (D) for 5 days. Bar = 1 cm. C, Seedling establishment of cop1 mutants is less sensitive to ABA. Col-0 and cop1 seedlings were grown horizontally on MS medium or MS medium containing 0.5-µM ABA in darkness for 5 days. Bar = 1 cm. D, Seedling establishment rate measurements. Col-0 and cop1 seedlings were grown horizontally on MS medium or MS medium containing 0.5-µM ABA in darkness. Error bars represent sd of three independent pools of seedlings, each pool containing 50 seedlings. *P < 0.05, **P < 0.01, and ***P < 0.001 (Student’s t test; Supplemental Data Set S1) for the indicated pairs of seedlings.
Figure 2
Figure 2
COP1 positively regulates ABA signaling during seedling growth in darkness through ABI5. A, Immunoblots showing the abundance of PYR1, OST1, ABI1, ABI2, and ABI5 in Col-0 and cop1 mutant seedlings before and after ABA treatment. Four-day-old Col-0, cop1-4, and cop1-6 mutant seedlings grown in darkness were first treated with 50-μM ABA for the indicated times, and then harvested and subjected to immunoblotting using antibodies against PYR1, OST1, ABI1, ABI2, and ABI5 proteins. Anti-RPN6 or anti-HSP was used as sample loading control. Numbers below the immunoblots indicate the relative band intensities of the respective proteins normalized to those of loading control for each panel. The ratio of the first band was set to 100 for each blot. The asterisks indicate nonspecific bands. B, Germination rate measurements. Hydrated seeds for Col-0, cop1-4, cop1-4 ABI5-GFP, and cop1-4 ABI5-MYC were sown on MS medium or MS medium containing 0.5-µM ABA. Error bars represent sd of three independent sets of seeds, each set containing 50 seeds. *P < 0.05, **P < 0.01, and ***P < 0.001 (Student’s t test; Supplemental Data Set S1) for the indicated pairs of seeds. C, Phenotypic analyses of 5-day-old dark-grown Col-0, cop1-4, ABI5-GFP, cop1-4 ABI5-GFP, ABI5-MYC, and cop1-4 ABI5-MYC seedlings. The seedlings were grown vertically on MS medium or MS medium with various ABA concentrations for 5 days in darkness. Bar = 1 cm. D, Seedling establishment rate measurements. Col-0, cop1-4, cop1-4 ABI5-GFP, and cop1-4 ABI5-MYC seedlings were grown horizontally on MS medium or MS medium containing 0.5-µM ABA in darkness. Error bars represent sd of three independent pools of seedlings, each pool containing 50 seedlings. *P < 0.05, **P < 0.01, and ***P < 0.001 (Student’s t test; Supplemental Data Set S1) for the indicated pairs of seedlings.
Figure 3
Figure 3
COP1 stabilizes ABI5 protein by inhibiting 26S proteasome pathway-mediated ABI5 degradation. A, B, Immunoblots showing the abundance of ABI5-GFP and endogenous ABI5 in ABI5-GFP and cop1-4 ABI5-GFP seedlings in darkness. Four-day-old Super:ABI5-GFP and cop1-4 Super:ABI5-GFP seedlings grown in darkness were first treated with 100-µM CHX for the indicated times, and then harvested and subjected to immunoblotting using antibodies against ABI5. Anti-RPN6 was used as a sample loading control. Representative pictures are shown in (A) and the relative levels of ABI5-GFP are shown in (B). Numbers in the immunoblots in (A) indicate the relative band intensities of ABI5-GFP and endogenous ABI5 normalized to the loading control. The ratio was set to 100 for the 0 h samples. Error bars in (B) represent sd from three independent assays. *P < 0.05 (Student’s t test; Supplemental Data Set S1) for the indicated pair of samples. C, D, COP1 is essential for ABA-induced stabilization of ABI5 proteins. Four-day-old Col-0 and cop1-4 mutant seedlings grown in darkness were first treated with mock (ethanol), 100-μM CHX, 50-μM ABA, or 100-μM CHX together with 50-μM ABA for 3 h, and then harvested and subjected to immunoblotting using antibodies against ABI5. Anti-HSP was used as a sample loading control. Representative pictures are shown in (C) and the relative ABI5 levels are shown in (D). Numbers below the immunoblots in (C) indicate the relative band intensities of ABI5 normalized to the loading control. The ratio of the first band was set to 100. Error bars in (D) represent the standard error (se) from three independent assays. Different letters represent significant differences by one-way ANOVA with Duncan’s post hoc test (P < 0.05; Supplemental Data Set S1). E, F, COP1 inhibits 26S proteasome pathway-mediated ABI5 degradation. Four-day-old Col-0 and cop1-4 mutant seedlings grown in darkness were first treated with 100-μM CHX, or 100-μM CHX together with 50-μM MG132 for 3 h, and then harvested and subjected to immunoblotting using antibodies against ABI5. Anti-HSP was used as a sample loading control. Representative pictures are shown in (E) and the relative ABI5 levels are shown in (F). Numbers below the immunoblots in (E) indicate the relative band intensities of ABI5 normalized to the loading control. The ratio of the first band was set to 100. Error bars in (F) represent se from three independent assays. Different letters represent significant differences by one-way ANOVA with Duncan’s post hoc test (P < 0.05; Supplemental Data Set S1).
Figure 4
Figure 4
COP1 physically interacts with ABD1. A, Schematic diagram of prey proteins (COP1-N282, COP1-RING, COP1-Coil, COP1-WD40, and COP1-ΔRING fused with AD domains). B, Yeast two-hybrid assays showing that the RING-finger domain of COP1 is responsible for the interaction of COP1 with ABD1. Empty vectors were used as negative controls. C, Pull-down assays showing that GST-tagged ABD1, but not GST alone, can pull down His-tagged COP1 in vitro. His-tagged COP1 was incubated with immobilized GST or GST-tagged ABD1, and then the precipitated proteins were analyzed with anti-GST and anti-His antibodies, respectively. D, Co-IP assays showing that COP1 associates with ABD1 in vivo in the dark. Col-0 and 35S:ABD1-MYC seedlings were first grown in darkness or continuous white light for 4 days, and then the total proteins were extracted and incubated with Myc-Trap beads (ChromoTek). The total and precipitated proteins were subjected to immunoblotting with antibodies against MYC, COP1 and RPN6, respectively. The asterisks indicate nonspecific bands. E, BiFC assays in N. benthamiana leaves. The indicated combinations of YFPC-ABD1, YFPN-COP1, YFPN-COP1-C, and YFPN constructs were co-infiltrated into N. benthamiana leaves. YFP signals were observed 2 days after infiltration using confocal fluorescence microscopy. Bars = 20 μm.
Figure 5
Figure 5
COP1 mediates ABD1 degradation via the 26S proteasome pathway. A, B, COP1 promotes the degradation of ABD1 in cell-free degradation assays. Recombinant purified His-ABD1 was incubated with equal amounts of total protein extracts from 4-day-old dark-grown Col-0 or cop1-4 seedlings in the presence of ATP, and then His-ABD1 was detected by immunoblotting using anti-His antibodies. Anti-RPN6 was used as a sample loading control. Representative pictures are shown in (A) and the relative levels of His-ABD1 are shown in (B). In (A), numbers below the immunoblots indicate the relative band intensities of His-ABD1 normalized to those of loading control. The ratio was set to 100 for the 0 h samples for each genotype. In (B), error bars represent sd from three independent assays. *P < 0.05 and **P < 0.01 (Student’s t test; Supplemental Data Set S1) for the indicated pairs of samples. C, D, ABD1 is destabilized by COP1 in Arabidopsis protoplasts. Super:ABD1-GFP and different amounts of 35S:HF-COP1 plasmids were cotransfected into Arabidopsis (Col-0) protoplasts. After incubation for 18 h in darkness, ABD1-GFP and HF-COP1 proteins were detected with anti-GFP and anti-COP1 antibodies, respectively. Anti-RPN6 was used as a sample loading control. Representative pictures are shown in (C) and the relative levels of ABD1-GFP are shown in (D). Numbers below the immunoblots in (C) indicate the relative band intensities of ABD1-GFP normalized to the loading control. The ratio of the first ABD1-GFP band was set to 100. Error bars in (D) represent se from three independent assays. Different letters represent significant differences by one-way ANOVA with Duncan’s post hoc test (P <0.05; Supplemental Data Set S1). E, F, Immunoblots showing the levels of ABD1 proteins in Col-0 and two cop1 mutants. Four-day-old seedlings grown in darkness (D) or continuous white (W) light were subjected to immunoblotting. Anti-HSP was used as a sample loading control. Representative pictures are shown in (E) and the relative levels of ABD1 are shown in (F). Numbers below the immunoblots in (E) indicate the relative band intensities of ABD1 normalized to the loading control. The ratio of the first ABD1 band was set to 100. Error bars in (F) represent sd from three independent assays. Different letters represent significant differences by one-way ANOVA with Duncan’s post hoc test (P < 0.05; Supplemental Data Set S1). G, H, COP1 regulates the stability of ABD1 proteins in vivo. Four-day-old Col-0 and cop1-4 mutant seedlings grown in darkness were treated with 300-μM CHX for the indicated times, and then the total proteins were extracted and subjected to immunoblotting with anti-ABD1 antibodies. Anti-HSP was used as a sample loading control. Representative pictures are shown in (G) and the relative levels of ABD1 are shown in (H). Numbers below the immunoblots in (G) indicate the relative band intensities of ABD1 normalized to the loading control. The ratio was set to 100 for the first ABD1 band of each genotype before CHX treatment. Error bars in (H) represent sd from three independent assays. *P < 0.05 (Student’s t test; Supplemental Data Set S1) for the indicated pairs of samples. I, J, ABD1 is degraded via the 26S proteasome pathway. Four-day-old Col-0 seedlings grown in darkness were treated with 300-μM CHX or 300-μM CHX together with 50-μM MG132 for the indicated times, then the total proteins were extracted and subjected to immunoblotting with anti-ABD1 antibodies. Anti-HSP was used as a sample loading control. Representative pictures are shown in (I) and the relative levels of ABD1 are shown in (J). Numbers below the immunoblots in (I) indicate the relative band intensities of ABD1 proteins normalized to the loading control. The ratio was set to 100 for the first ABD1 band before each treatment. Error bars in (J) represent sd from three independent assays. **P < 0.01 and ***P < 0.001 (Student’s t test; Supplemental Data Set S1) for the indicated pairs of samples. K, L, COP1 mediates ABA-induced ABD1 turnover via the 26S proteasome pathway. Four-day-old Col-0 and cop1-4 mutant seedlings grown in darkness were treated for 3 h with 300-μM CHX or 300-μM CHX together with 50-μM MG132 in the presence or absence of 50-μM ABA. The total proteins were subjected to immunoblotting with antibodies against ABD1. Anti-HSP was used as a sample loading control. Representative pictures are shown in (K) and the relative levels of ABD1 are shown in (L). Numbers below the immunoblots in (K) indicate the relative band intensities of ABD1 normalized to the loading control. The ratio of the first ABD1 band was set to 100. Error bars in (L) represent se from three independent assays. Different letters represent significant differences by one-way ANOVA with Duncan's post hoc test (P < 0.05; Supplemental Data Set S1).
Figure 6
Figure 6
COP1 directly ubiquitinates ABD1 in vitro and in vivo. A, COP1 ubiquitinates ABD1 in vitro. Recombinant purified MBP, MBP-COP1, GST-ABD1, and denatured COP1 (bMBP-COP1) were used in the assays. The ubiquitinated ABD1 was analyzed by immunoblots using anti-GST and anti-FLAG antibodies. B, COP1 ubiquitinates ABD1 in vivo. Arabidopsis protoplasts expressing different combinations of HA-UBQ, HF-COP1 and ABD1-GFP were incubated in darkness for 18 h in the presence of 5-μM MG132 with or without 5-μM ABA. Total proteins were then extracted and incubated with GFP-Trap beads. The total and precipitated proteins were subjected to immunoblotting with antibodies against GFP, COP1, and ubiquitin, respectively. C, Peptides produced by trypsin proteolysis of ABD1 in the LC–MS/MS showed the fragment ion mass with intact diglycine modification at K122. D, E, Cell-free degradation assays showing that the K122R mutation decreases the degradation of ABD1 in total protein extracts from Col-0 seedlings. Recombinant purified GST-ABD1 or GST-ABD1K122R proteins were incubated with equal amounts of total proteins extracted from 4-day-old dark-grown Col-0 seedlings in the presence of ATP, and then detected by immunoblotting using anti-GST antibodies. Anti-RPN6 was used as a sample loading control. Representative pictures are shown in (D) and the relative levels of GST-ABD1 from three independent assays are shown in (E). In (D), numbers below the immunoblots indicate the relative band intensities normalized to the loading control. The ratio was set to 100 for the first band before ATP treatment. In (E), error bars represent sd from three independent assays. *P < 0.05 and **P < 0.01 (Student’s t test; Supplemental Data Set S1) for the indicated pairs of samples. F, G, The K122R mutation improves the stability of ABD1 in vivo. The same amounts of Super:ABD1-GFP and Super:ABD1K122R-GFP were transfected with or without 35S:HF-COP1 plasmids into Arabidopsis (Col-0) protoplasts. After incubation for 18 h in darkness, ABD1-GFP and HF-COP1 were detected with anti-GFP and anti-COP1 antibodies, respectively. Anti-RPN6 was used as a sample loading control. Representative pictures are shown in (F) and the relative levels of ABD1-GFP proteins are shown in (G). Numbers below the immunoblots in (F) indicate the relative band intensities normalized to the loading control. The ratio was set to 100 in the absence of HF-COP1. Error bars in (G) represent sd from three independent assays. Different letters represent significant differences by one-way ANOVA with Duncan’s post hoc test (P < 0.05; Supplemental Data Set S1).
Figure 7
Figure 7
COP1 partially promotes ABI5 protein stability in darkness by degrading ABD1. A, Germination rate measurements. Hydrated seeds for Col-0, cop1-4, abd1-1, and cop1-4 abd1-1 mutants were sown on MS medium or MS medium containing 0.5-µM ABA, and then grown in darkness. Error bars represent sd of three independent sets of seeds, each set containing 50 seeds. *P < 0.05, and **P < 0.01 (Student’s t test; Supplemental Data Set S1) for the indicated pairs of seeds. B, Phenotypic analyses of 5-day-old dark-grown Col-0, cop1-4, abd1-1, and cop1-4 abd1-1 seedlings. The seedlings were grown vertically on MS medium with the indicated concentrations of ABA in darkness for 5 days. Bar = 1 cm. C, Phenotypes of Col-0, cop1-4, abd1-1, and cop1-4 abd1-1 mutants grown on MS medium or MS medium containing 0.5-µM ABA in darkness for 5 days. Bar = 1 cm. D, Seedling establishment rates for Col-0, cop1-4, abd1-1, and cop1-4 abd1-1 mutants. The seedlings were grown horizontally on MS medium or MS medium containing 0.5-µM ABA. Error bars represent sd of three independent pools of seedlings, each pool containing 50 seedlings. *P < 0.05, **P < 0.01, and ***P < 0.001 (Student’s t test; Supplemental Data Set S1) for the indicated pairs of seedlings. E, F, Immunoblots showing the levels of ABI5 protein in Col-0, cop1-4, abd1-1, and cop1-4 abd1-1 mutant seedlings. Four-day-old seedlings grown in darkness were treated with 50-μM ABA for 3 h, and then subjected to immunoblotting with anti-ABI5 antibodies. Anti-HSP was used as a sample loading control. Representative pictures are shown in (E) and the relative levels of ABI5 are shown in (F). Numbers below the immunoblots in (E) indicate the relative band intensities of ABI5 normalized to the loading control. The ratio of the first ABI5 band was set to 100 for each blot. Error bars in (F) represent sd from three independent assays. *P < 0.05, **P < 0.01, and ***P < 0.001 (Student’s t test; Supplemental Data Set S1) for the indicated pairs of samples.
Figure 8
Figure 8
ABA induces the nuclear accumulation of COP1 in darkness. A, ABA treatment induces the nuclear accumulation of YFP-COP1 in darkness. cop1-5 35S:YFP-COP1 seedlings were first grown in darkness (D) or continuous white (W) light for 4 days, and were treated with mock (ethanol) or 60-μM ABA for 1 h. YFP signals were observed under a confocal laser scanning microscope. Bar = 50 μm. 4′,6-Diamidino-2-phenylindole staining shows the nuclei of the cells. Red boxed regions are enlarged and shown as insets. The regions indicated by white brackets were used for the quantification of YFP fluorescence signals using Image J shown in (B). B, Relative intensities of YFP fluorescence signals of cop1-5 35S:YFP-COP1 seedlings after 1 h of mock or ABA treatment. For each treatment, at least 10 seedlings were observed, each seedling being taken three confocal images at different imaging depths, and error bars represent se from at least 30 confocal images. ***P < 0.001 (Student’s t test; Supplemental Data Set S1) for the indicated pairs of seedlings. n.s., not significant. C, Nuclear/cytoplasmic fractionation assays showing that ABA signaling induces the nuclear enrichment of COP1 in darkness. Four-day-old Col-0 and pyr1 pyl1458 mutant seedlings grown in darkness were treated with mock (ethanol) or 60-μM ABA for 1 h, and then the cytoplasmic and nuclear fractions were separated and subjected to immunoblotting. PEPC was used as a cytosolic marker, and histone H3 served as a nuclear marker. RPN6 was used as a total protein loading control. Numbers below the immunoblots indicate the relative band intensities of COP1 normalized to RPN6 for total, PEPC for cytosolic, and H3 for nuclear fractions, respectively. The ratio of the COP1 band treated with mock was set to 100 for each fraction. The asterisk indicates a nonspecific band.
Figure 9
Figure 9
A working model depicting the role of COP1 in mediating ABA signaling during Arabidopsis seedling growth in darkness. During Arabidopsis seedling growth in darkness, COP1 promotes ABI5 stability by targeting ABD1 for 26S proteasome pathway-mediated degradation. In addition, COP1 also promotes the stability of PIF proteins in the dark. As PIFs and ABI5 itself can activate ABI5 transcription by directly binding to the G-box motifs in the ABI5 promoter (Xu et al., 2014; Qi et al., 2020), COP1 also mediates ABA-induced ABI5 transcription in the dark. Thus, COP1 mediates ABA-induced ABI5 accumulation through transcriptional and post-translational regulatory mechanisms, thereby playing a positive role in mediating ABA signaling during Arabidopsis seedling growth in darkness. ABA signaling induces the nuclear accumulation of COP1 in darkness, thus enhancing its activity in propagating the ABA signal.

Similar articles

Cited by

References

    1. Ang LH, Chattopadhyay S, Wei N, Oyama T, Okada K, Batschauer A, Deng XW (1998) Molecular interaction between COP1 and HY5 defines a regulatory switch for light control of Arabidopsis development. Mol Cell 1: 213–222 - PubMed
    1. Antoni R, Gonzalez-Guzman M, Rodriguez L, Peirats-Llobet M, Pizzio GA, Fernandez MA, De Winne N, De Jaeger G, Dietrich D, Bennett MJ, et al. (2013) PYRABACTIN RESISTANCE1-LIKE8 plays an important role for the regulation of abscisic acid signaling in root. Plant Physiol 161: 931–941 - PMC - PubMed
    1. Bauer D, Viczian A, Kircher S, Nobis T, Nitschke R, Kunkel T, Panigrahi KC, Adam E, Fejes E, Schafer E, et al. (2004). Constitutive photomorphogenesis 1 and multiple photoreceptors control degradation of phytochrome interacting factor 3, a transcription factor required for light signaling in Arabidopsis. Plant Cell 16: 1433–1445 - PMC - PubMed
    1. Chen K, Li GJ, Bressan RA, Song CP, Zhu JK, Zhao Y (2020) Abscisic acid dynamics, signaling, and functions in plants. J Integr Plant Biol 62: 25–54 - PubMed
    1. Chen Q, Bai L, Wang W, Shi H, Ramón Botella J, Zhan Q, Liu K, Yang HQ, Song CP (2021) COP1 promotes ABA-induced stomatal closure by modulating the abundance of ABI/HAB and AHG3 phosphatases. New Phytol 229: 2035–2049 - PMC - PubMed

Publication types

MeSH terms

Substances

LinkOut - more resources