

A radiomics-boosted deep-learning model for COVID-19 and non-COVID-19 pneumonia classification using chest x-ray images
- PMID: 35263458
- PMCID: PMC9088469
- DOI: 10.1002/mp.15582
A radiomics-boosted deep-learning model for COVID-19 and non-COVID-19 pneumonia classification using chest x-ray images
Abstract
Purpose: To develop a deep learning model design that integrates radiomics analysis for enhanced performance of COVID-19 and non-COVID-19 pneumonia detection using chest x-ray images.
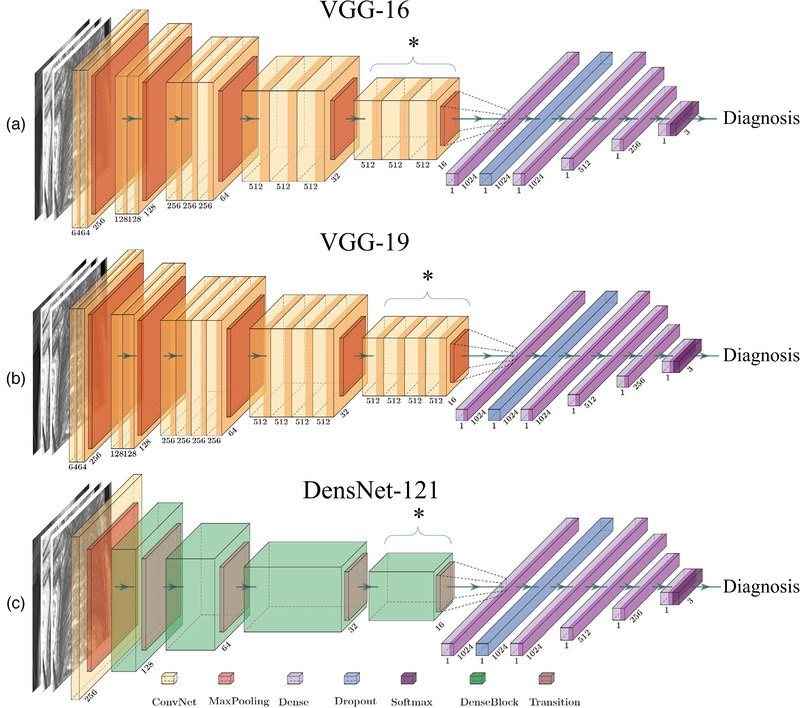
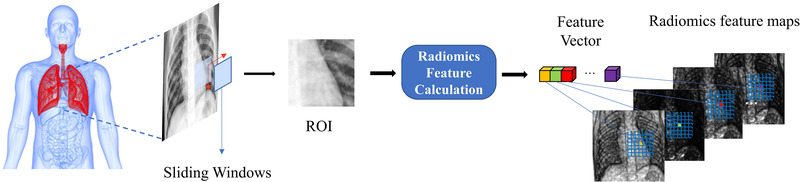
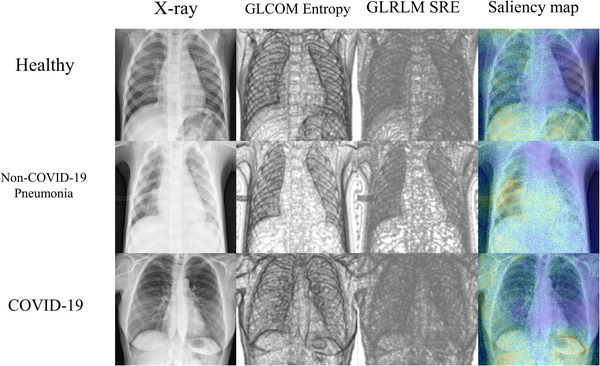
Methods: As a novel radiomics approach, a 2D sliding kernel was implemented to map the impulse response of radiomic features throughout the entire chest x-ray image; thus, each feature is rendered as a 2D map in the same dimension as the x-ray image. Based on each of the three investigated deep neural network architectures, including VGG-16, VGG-19, and DenseNet-121, a pilot model was trained using x-ray images only. Subsequently, two radiomic feature maps (RFMs) were selected based on cross-correlation analysis in reference to the pilot model saliency map results. The radiomics-boosted model was then trained based on the same deep neural network architecture using x-ray images plus the selected RFMs as input. The proposed radiomics-boosted design was developed using 812 chest x-ray images with 262/288/262 COVID-19/non-COVID-19 pneumonia/healthy cases, and 649/163 cases were assigned as training-validation/independent test sets. For each model, 50 runs were trained with random assignments of training/validation cases following the 7:1 ratio in the training-validation set. Sensitivity, specificity, accuracy, and ROC curves together with area-under-the-curve (AUC) from all three deep neural network architectures were evaluated.
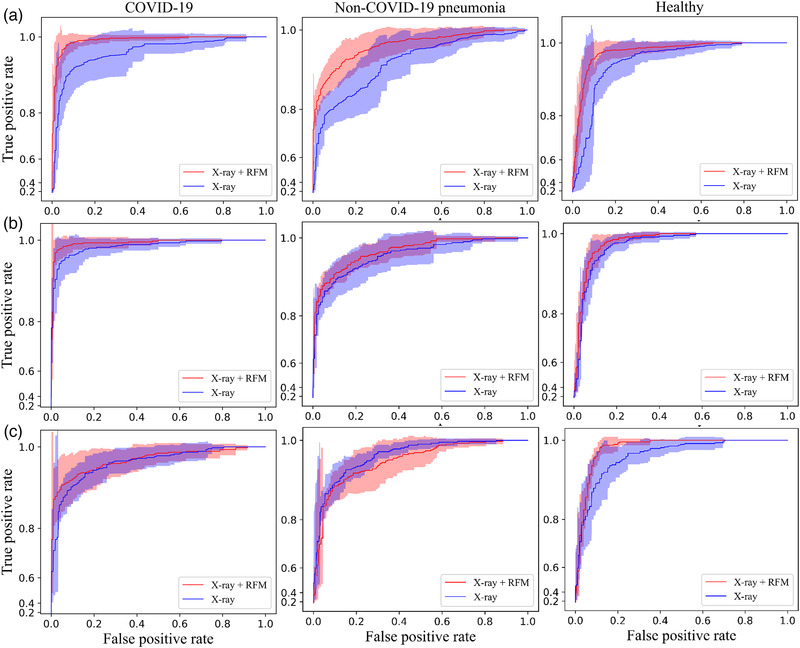
Results: After radiomics-boosted implementation, all three investigated deep neural network architectures demonstrated improved sensitivity, specificity, accuracy, and ROC AUC results in COVID-19 and healthy individual classifications. VGG-16 showed the largest improvement in COVID-19 classification ROC (AUC from 0.963 to 0.993), and DenseNet-121 showed the largest improvement in healthy individual classification ROC (AUC from 0.962 to 0.989). The reduced variations suggested improved robustness of the model to data partition. For the challenging non-COVID-19 pneumonia classification task, radiomics-boosted implementation of VGG-16 (AUC from 0.918 to 0.969) and VGG-19 (AUC from 0.964 to 0.970) improved ROC results, while DenseNet-121 showed a slight yet insignificant ROC performance reduction (AUC from 0.963 to 0.949). The achieved highest accuracy of COVID-19/non-COVID-19 pneumonia/healthy individual classifications were 0.973 (VGG-19)/0.936 (VGG-19)/ 0.933 (VGG-16), respectively.
Conclusions: The inclusion of radiomic analysis in deep learning model design improved the performance and robustness of COVID-19/non-COVID-19 pneumonia/healthy individual classification, which holds great potential for clinical applications in the COVID-19 pandemic.
Keywords: COVID-19; deep learning; radiomics; x-ray.
© 2022 American Association of Physicists in Medicine.
Conflict of interest statement
The authors declare that the research was conducted in the absence of any commercial or financial relationships that could be construed as a potential conflict of interest.
Figures
Similar articles
-
Explainable COVID-19 Detection Based on Chest X-rays Using an End-to-End RegNet Architecture.Viruses. 2023 Jun 6;15(6):1327. doi: 10.3390/v15061327. Viruses. 2023. PMID: 37376626 Free PMC article.
-
COVID-19 diagnosis from chest X-ray images using transfer learning: Enhanced performance by debiasing dataloader.J Xray Sci Technol. 2021;29(1):19-36. doi: 10.3233/XST-200757. J Xray Sci Technol. 2021. PMID: 33459685 Free PMC article.
-
A Cascade-SEME network for COVID-19 detection in chest x-ray images.Med Phys. 2021 May;48(5):2337-2353. doi: 10.1002/mp.14711. Epub 2021 Mar 29. Med Phys. 2021. PMID: 33778966 Free PMC article.
-
Diagnostic performance of corona virus disease 2019 chest computer tomography image recognition based on deep learning: Systematic review and meta-analysis.Medicine (Baltimore). 2022 Oct 21;101(42):e31346. doi: 10.1097/MD.0000000000031346. Medicine (Baltimore). 2022. PMID: 36281129 Free PMC article.
-
Detection of COVID-19 from CT and Chest X-ray Images Using Deep Learning Models.Ann Biomed Eng. 2022 Jul;50(7):825-835. doi: 10.1007/s10439-022-02958-5. Epub 2022 Apr 12. Ann Biomed Eng. 2022. PMID: 35415768 Free PMC article. Review.
Cited by
-
The Clinical Utility of Molecular Imaging in COVID-19: An Update.Semin Nucl Med. 2023 Jan;53(1):98-106. doi: 10.1053/j.semnuclmed.2022.09.002. Epub 2022 Sep 22. Semin Nucl Med. 2023. PMID: 36243572 Free PMC article. Review.
-
Detection of Pneumonia from Chest X-ray Images Utilizing MobileNet Model.Healthcare (Basel). 2023 May 26;11(11):1561. doi: 10.3390/healthcare11111561. Healthcare (Basel). 2023. PMID: 37297701 Free PMC article.
-
DEELE-Rad: exploiting deep radiomics features in deep learning models using COVID-19 chest X-ray images.Health Inf Sci Syst. 2024 Dec 29;13(1):11. doi: 10.1007/s13755-024-00330-6. eCollection 2025 Dec. Health Inf Sci Syst. 2024. PMID: 39741501
-
Efficient clinical decision-making process via AI-based multimodal data fusion: A COVID-19 case study.Heliyon. 2024 Oct 10;10(20):e38642. doi: 10.1016/j.heliyon.2024.e38642. eCollection 2024 Oct 30. Heliyon. 2024. PMID: 39640748 Free PMC article.
-
A neural ordinary differential equation model for visualizing deep neural network behaviors in multi-parametric MRI-based glioma segmentation.Med Phys. 2023 Aug;50(8):4825-4838. doi: 10.1002/mp.16286. Epub 2023 Mar 2. Med Phys. 2023. PMID: 36840621 Free PMC article.
References
-
- Worldometer . COVID‐19 Coronavirus Pandemic . https://www.worldometers.info/coronavirus/
MeSH terms
Grants and funding
LinkOut - more resources
Full Text Sources
Medical
Research Materials
