. 2022 Mar 8;55(3):494-511.e11.
doi: 10.1016/j.immuni.2022.02.003.

A nonredundant role for T cell-derived interleukin 22 in antibacterial defense of colonic crypts

Affiliations

A nonredundant role for T cell-derived interleukin 22 in antibacterial defense of colonic crypts

Carlene L Zindl et al. Immunity. .

Abstract

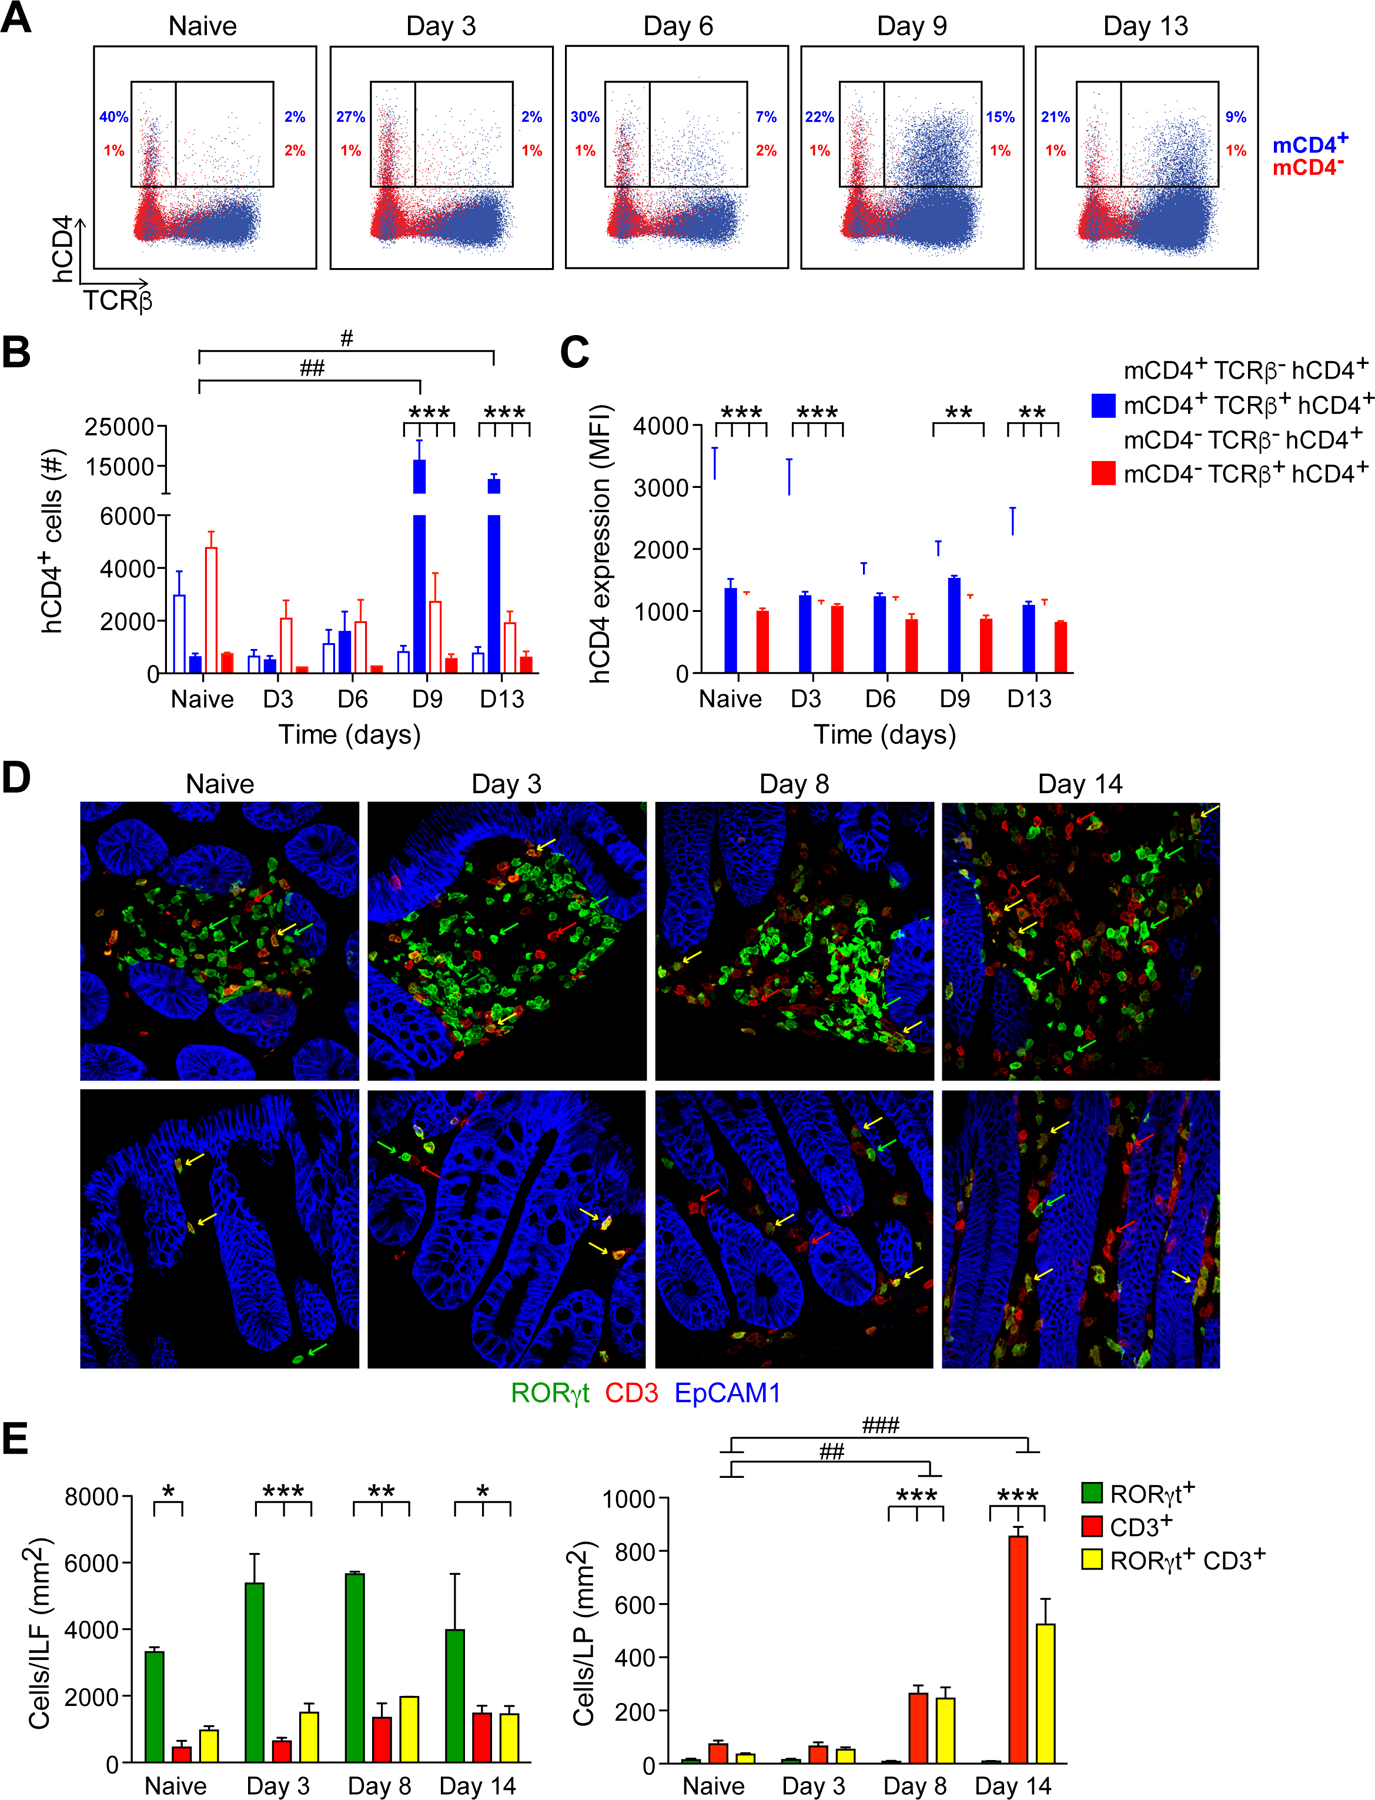
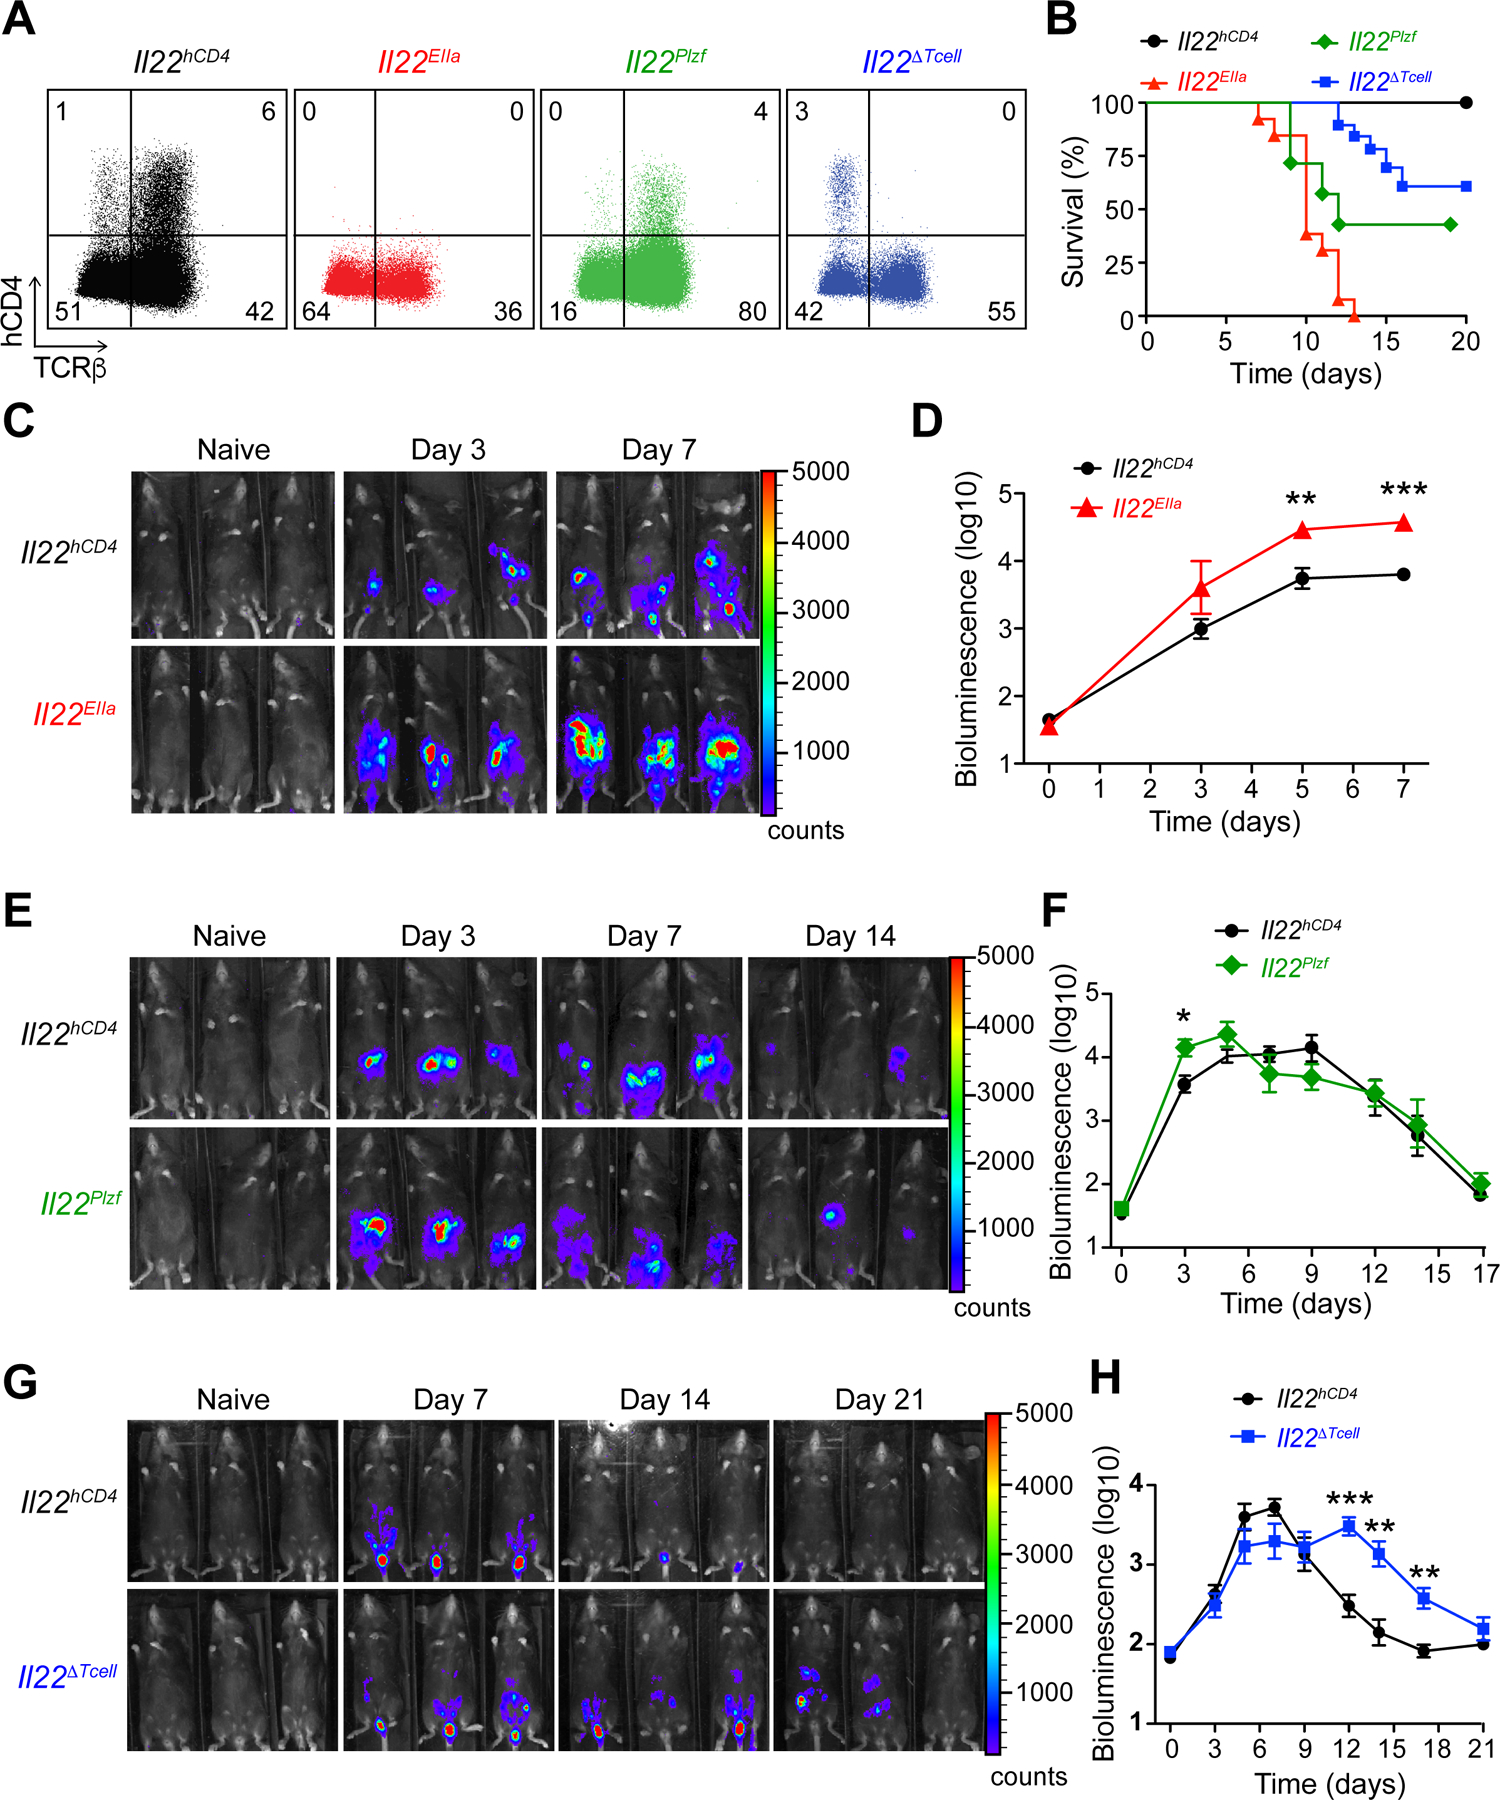
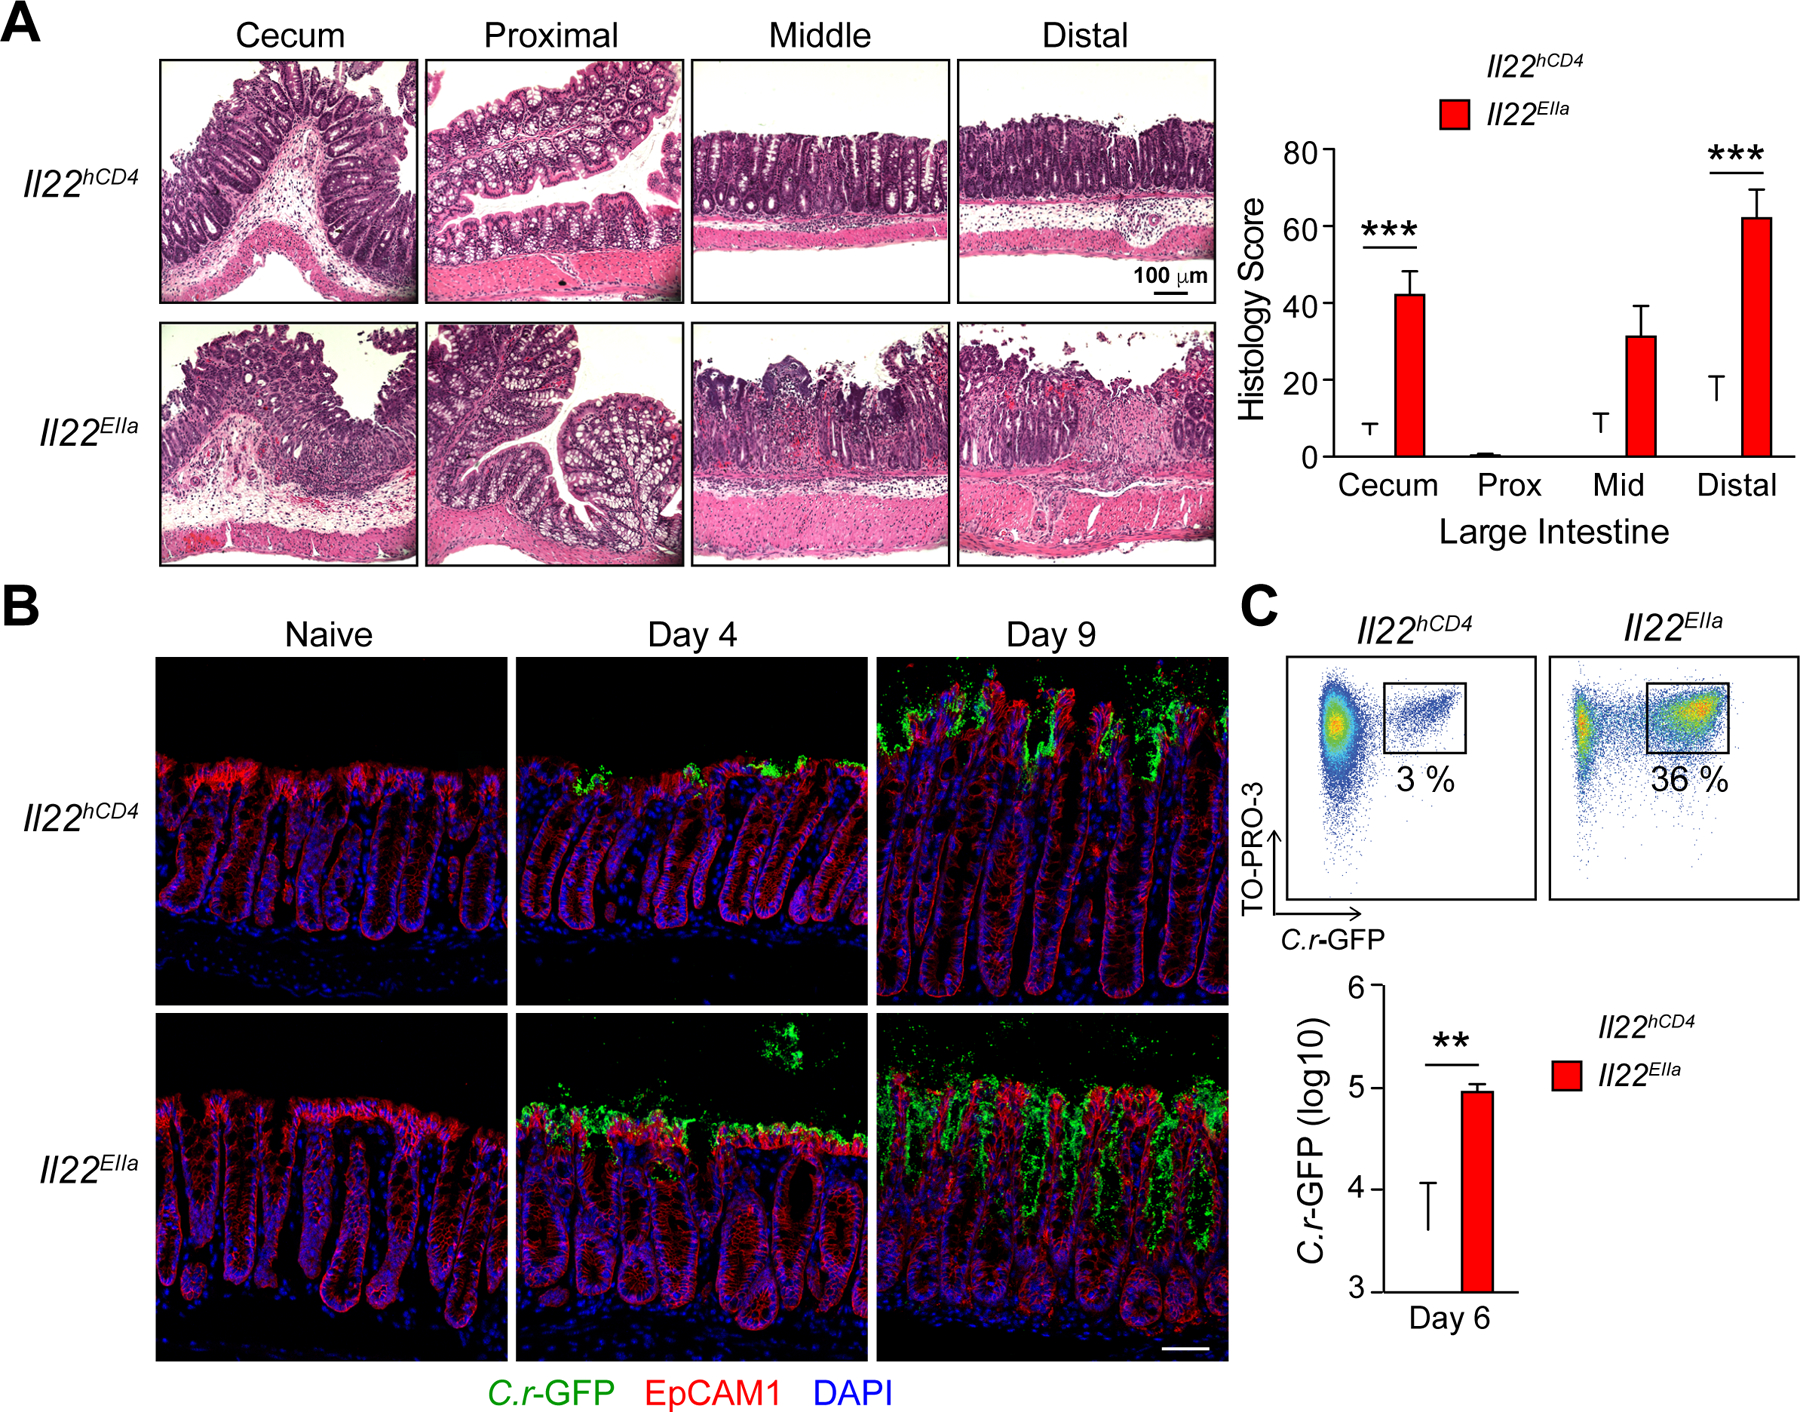
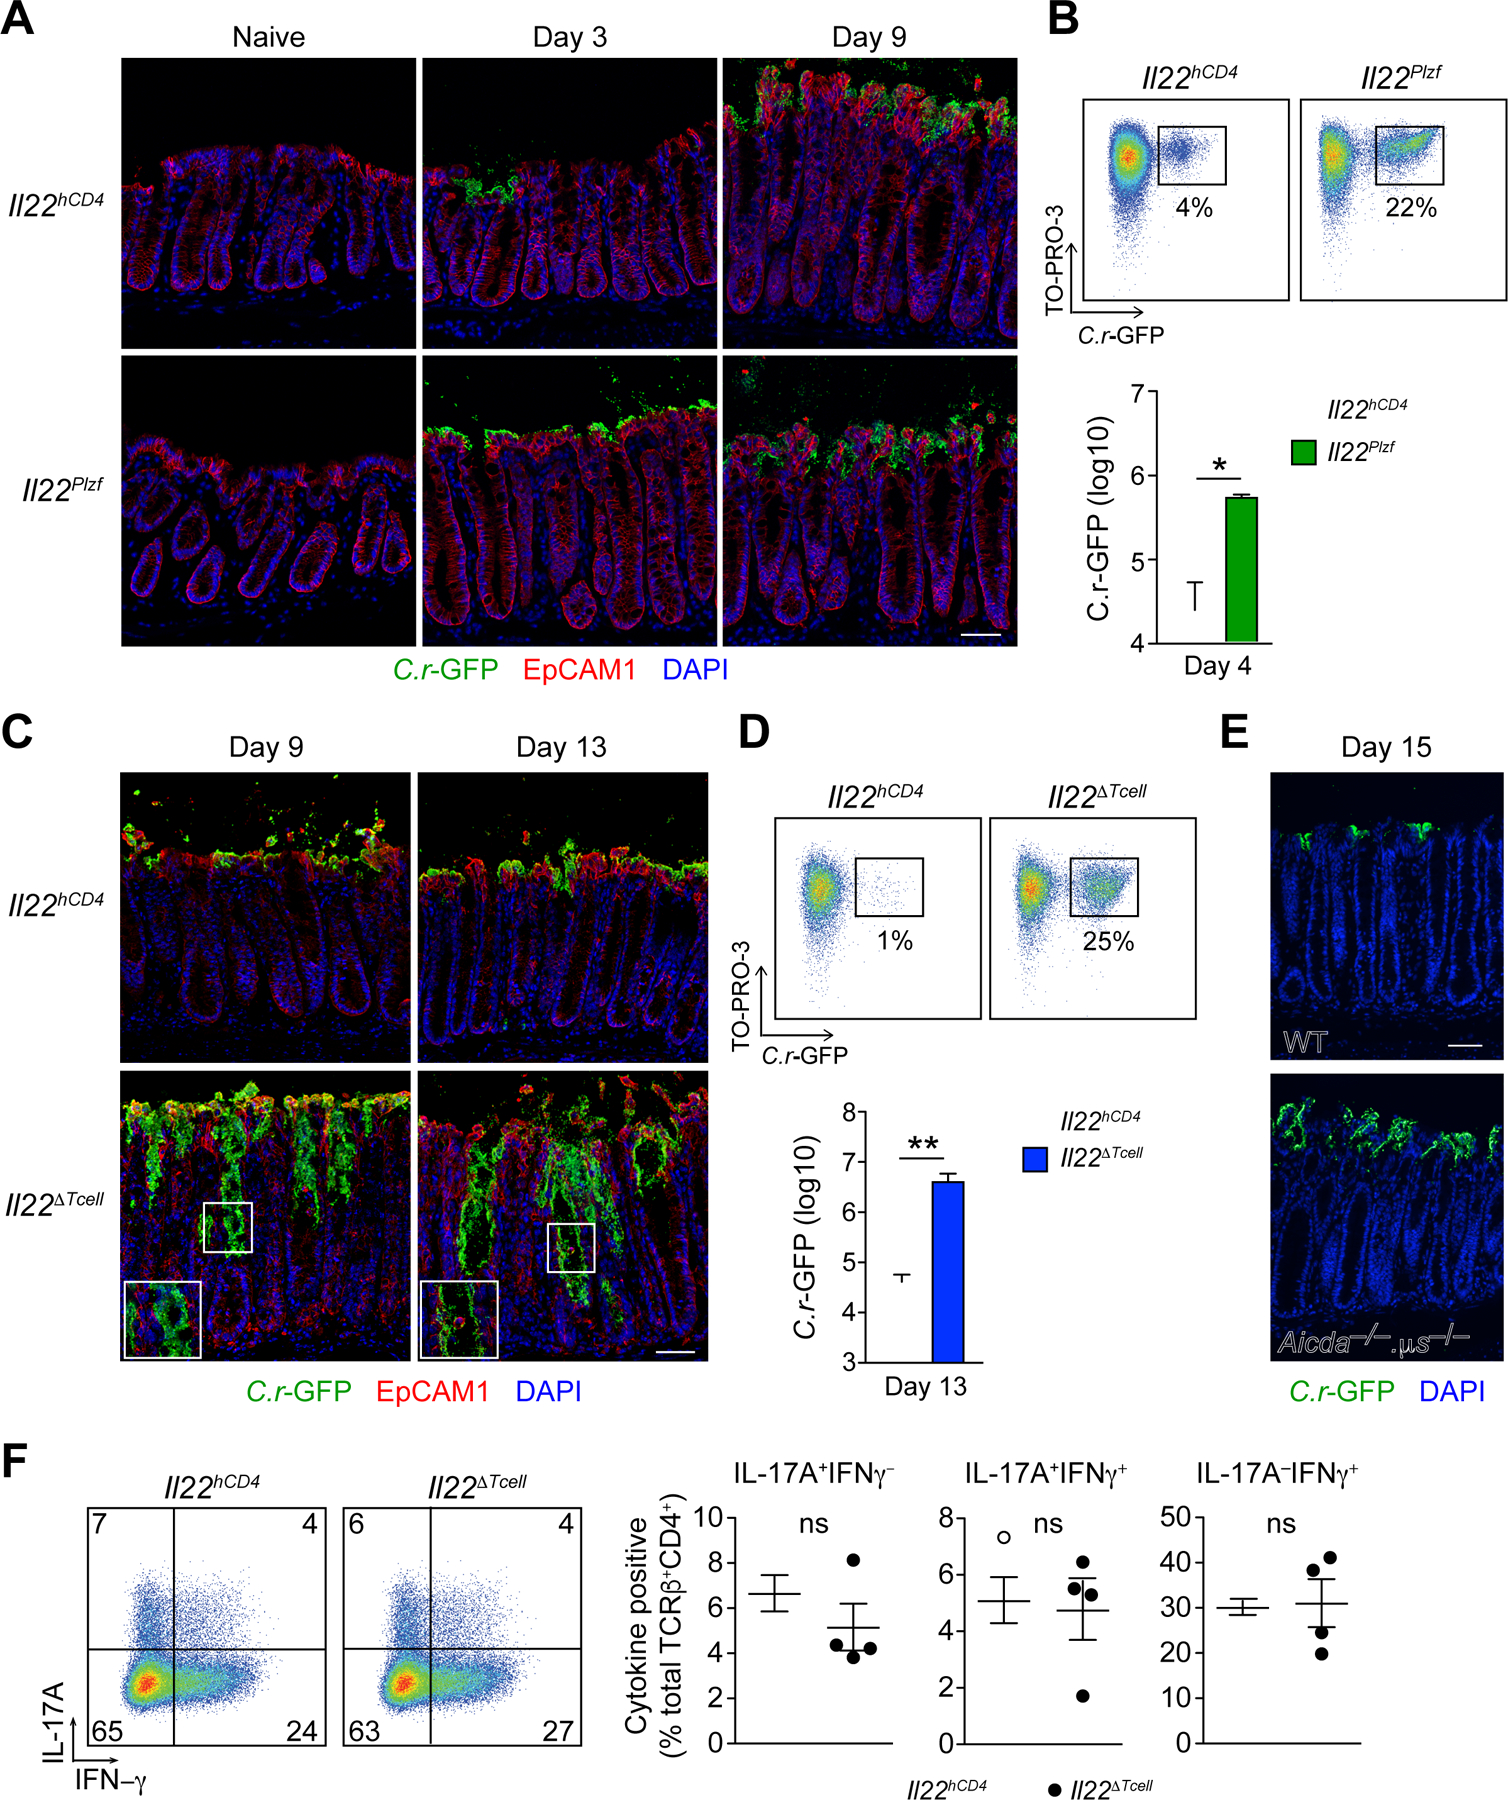
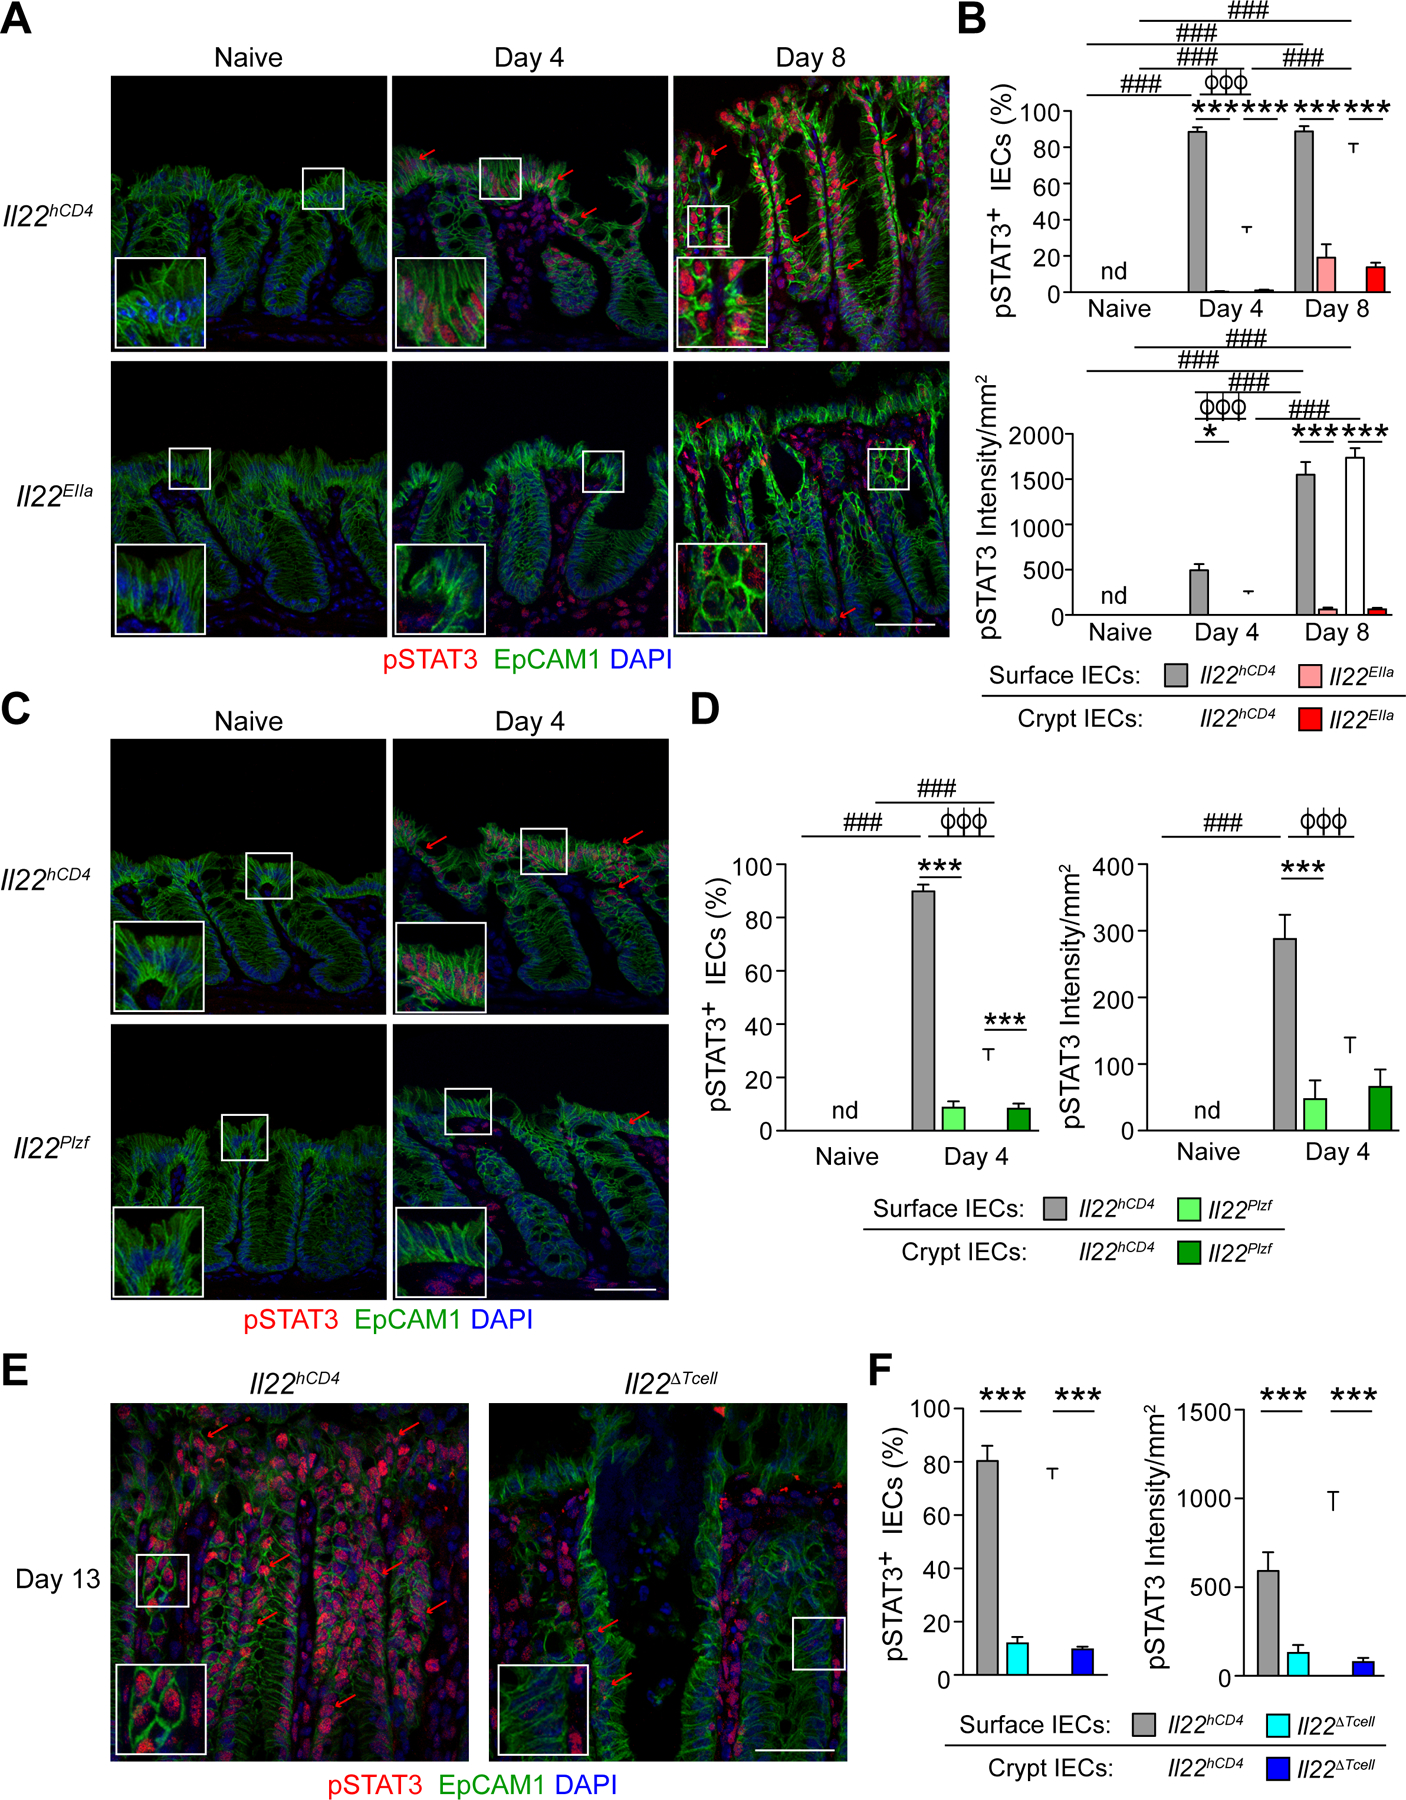
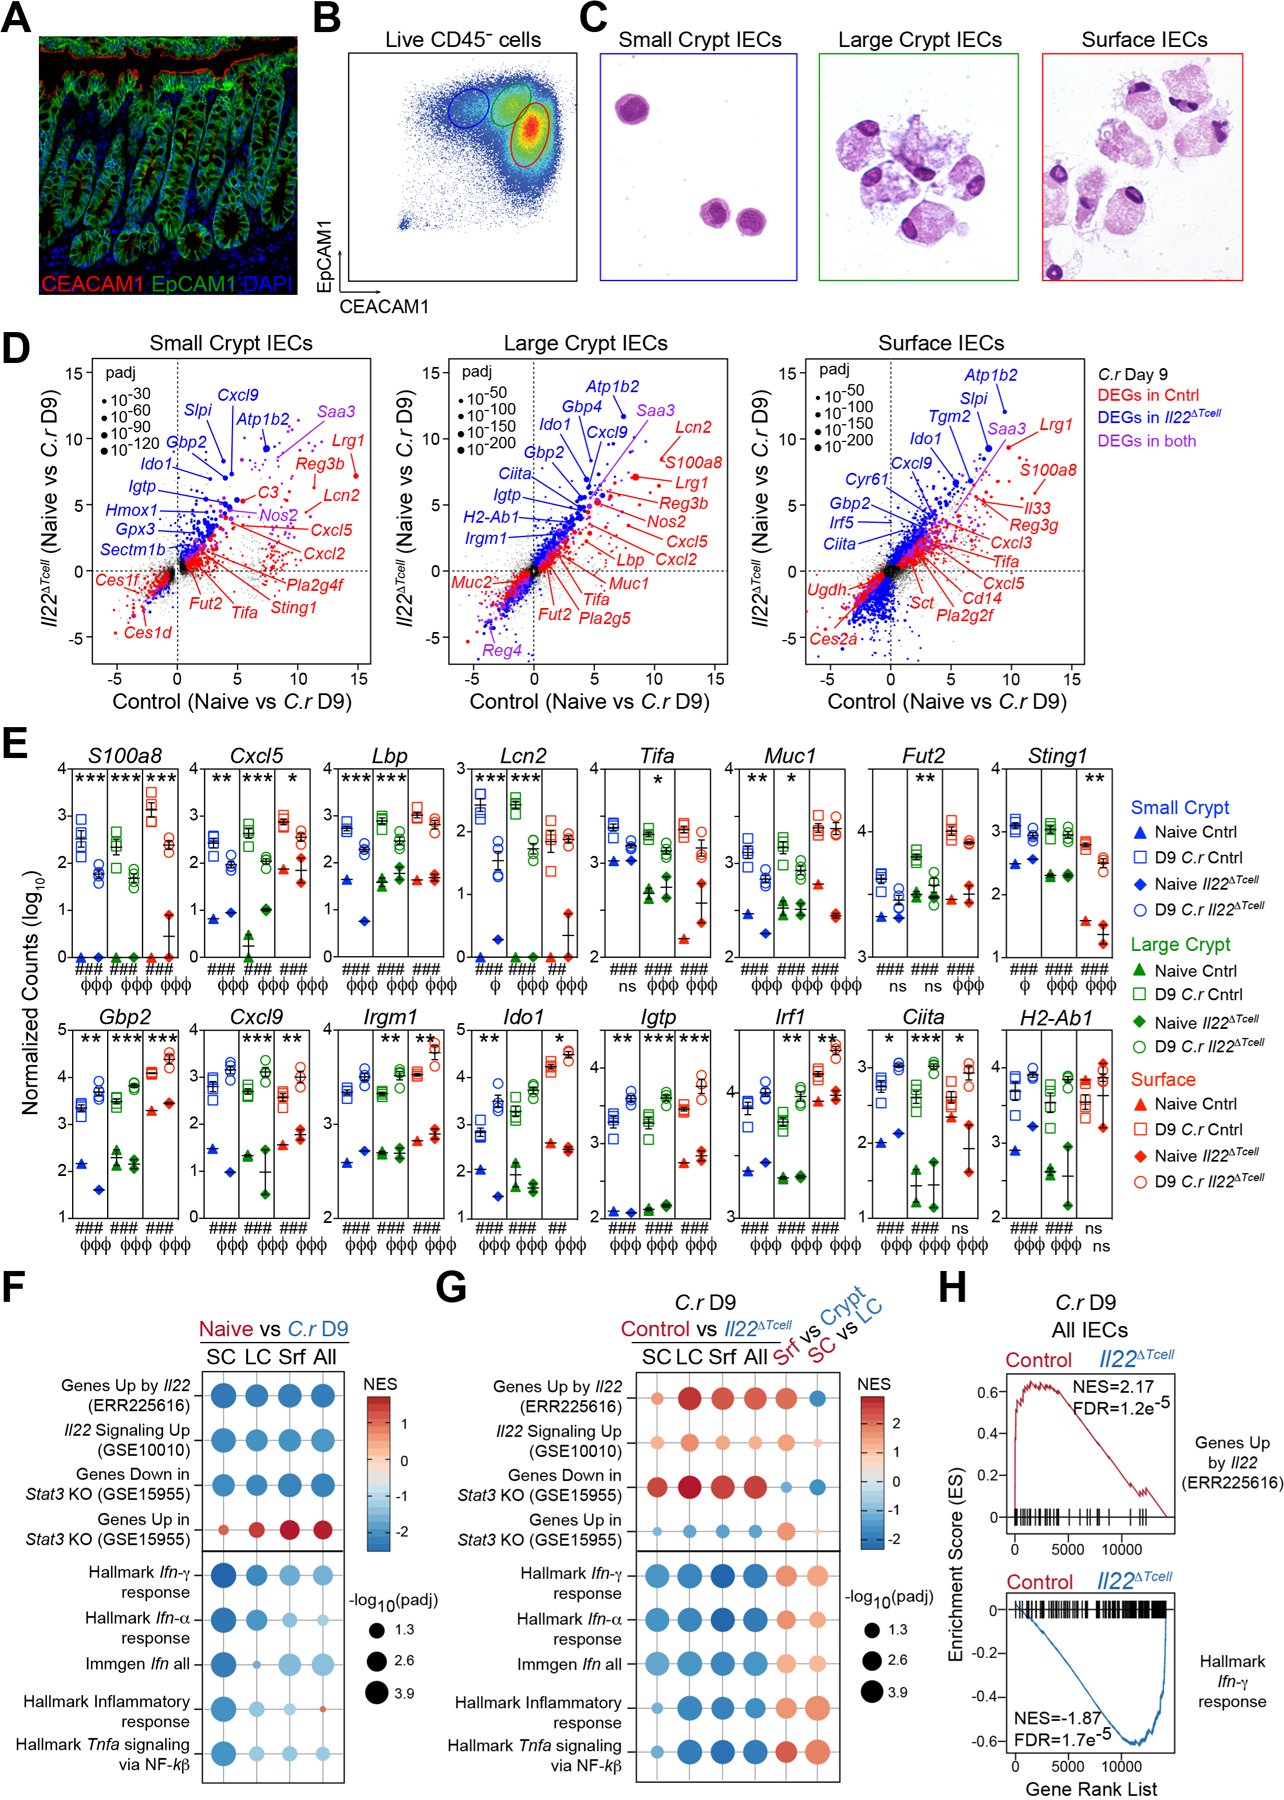
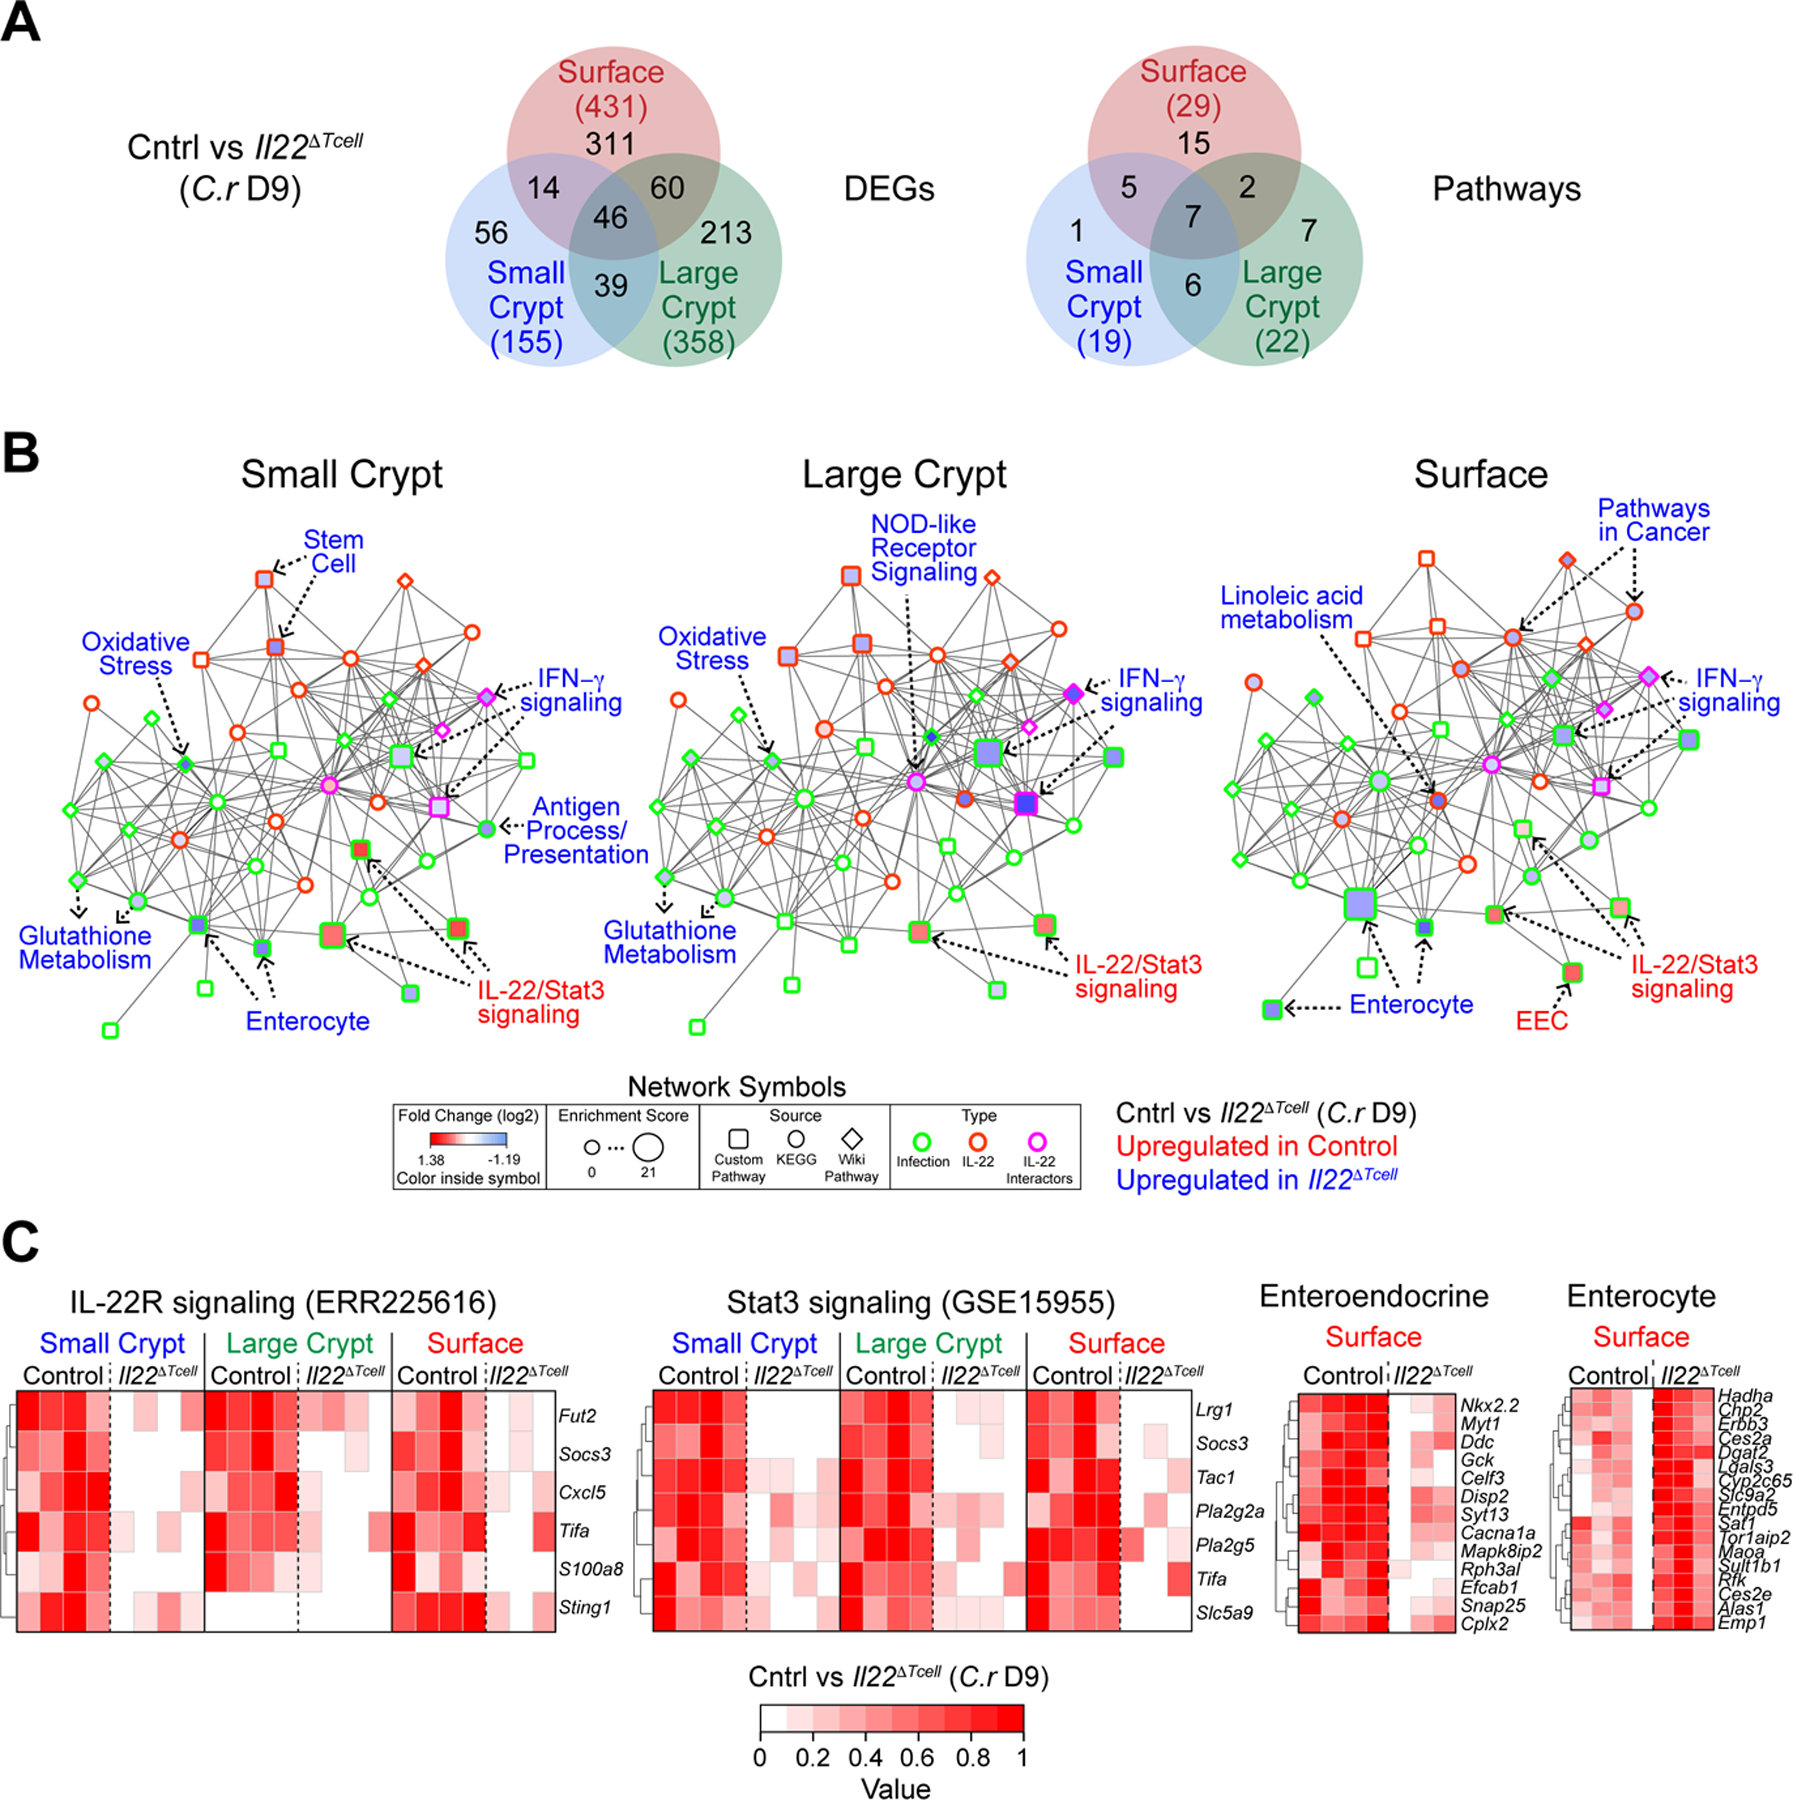
Interleukin (IL)-22 is central to immune defense at barrier sites. We examined the contributions of innate lymphoid cell (ILC) and T cell-derived IL-22 during Citrobacter rodentium (C.r) infection using mice that both report Il22 expression and allow lineage-specific deletion. ILC-derived IL-22 activated STAT3 in C.r-colonized surface intestinal epithelial cells (IECs) but only temporally restrained bacterial growth. T cell-derived IL-22 induced a more robust and extensive activation of STAT3 in IECs, including IECs lining colonic crypts, and T cell-specific deficiency of IL-22 led to pathogen invasion of the crypts and increased mortality. This reflected a requirement for T cell-derived IL-22 for the expression of a host-protective transcriptomic program that included AMPs, neutrophil-recruiting chemokines, and mucin-related molecules, and it restricted IFNγ-induced proinflammatory genes. Our findings demonstrate spatiotemporal differences in the production and action of IL-22 by ILCs and T cells during infection and reveal an indispensable role for IL-22-producing T cells in the protection of the intestinal crypts.

Keywords: AMPs; CD4 T cells; Citrobacter rodentium; IFNγ; IL-22; TNF; chemokines; colonic crypt IECs; colonic surface IECs; innate cells; mucins.


Conflict of interest statement

Declaration of interests The authors declare no competing interests.

Figures

Figure 1.
Figure 1.. Dynamics of IL-22 expression and cellular localization during C.r infection
(A). Colon LP cells from naïve and C.r-infected Il22hCD4 mice stimulated with P/I+IL-23 for 4h, stained for TCRβ, hCD4, mCD4, and L/D dye and analyzed by flow cytometry. Numbers represent percentages of hCD4 (IL-22+) innate cells (TCRβ-) or T cells (TCRβ+) and are split into CD4+ (blue) and CD4– (red). (B). Cell numbers and (C) IL-22/hCD4 expression based on mean fluorescence intensity (MFI). Cells were split into mCD4+ (open; blue) and mCD4 (open; red) innate cells, and mCD4+ (solid; blue) and mCD4- (solid; red) T cells. Error bars represent mean ± SEM. (D). Colons from naïve and C.r-infected RorcEGFP mice stained for GFP (green), CD3 (red), and EpCAM1 (blue). Arrows depict RORγ/GFP+ cells (green), CD3+ cells (red), and GFP+ CD3+ cells (yellow). Scale bar, 20 µm. (E). Quantitation of cells in colonic ILFs and LP. Error bars represent mean ± SEM. One-way ANOVA, naïve vs infected; #p<0.05, ##p<0.01 and ###p<0.001. Two-way ANOVA, comparing different cell populations; *p<0.05, **p<0.01 and ***p<0.001. 3–4 mice per time point, 3 independent experiments. See also Figure S1.
Figure 2.
Figure 2.. Temporal bacterial burden and fatality in C.r-infected lineage-specific IL-22-deficient mice
(A). Colon LP cells from day 7 C.r Il22hCD4 (black), Il22EIIa (red), Il22Plzf (green), and Il22∆Tcell (blue) mice stained for mCD4, hCD4 (IL-22), L/D dye and TCRβ after P/I+IL-23 stimulation. (B). Survival kinetics of C.r-infected Cntrl, Il22EIIa, Il22Plzf and Il22∆Tcell mice. (C, E, and G) Serial whole-body imaging and (D, F, H) Colonization kinetics of C.r-infected Cntrl, Il22EIIa, Il22Plzf and Il22∆Tcell mice. Error bars represent mean ± SEM. Mann Whitney; *p<0.05, **p<0.01, ***p<0.001. 4–5 mice per time point, 2 independent experiments. See also Figure S2.
Figure 3.
Figure 3.. IL-22 protects the colonic crypts from deep bacterial invasion
(A) LI from day 8 C.r Il22hCD4 (white) and Il22EIIa (red) mice stained with H&E (Two-way ANOVA, ***p<0.001) Scale bars, 100 µm. (B) Colons from naïve and C.r-GFP-infected Il22hCD4 and Il22EIIa mice stained for GFP (green), EpCAM1 (red) and DAPI (blue). Scale bars, 50 µm. (C) C.r from supernatants of IEC preps from d6 C.r-GFP Il22hCD4 and Il22EIIa mice stained with TO-PRO-3 and analyzed by flow cytometry in log scale (Mann Whitney, **p<0.01). Error bars represent mean ± SEM. 3–5 mice per group, 2 independent experiments. See also Figure S3.
Figure 4.
Figure 4.. IL-22+ innate and adaptive cells protect distinct regions of the colon during C.r infection
(A). Colons from naïve and C.r-GFP-infected Il22hCD4 and Il22Plzf mice stained for GFP (green), EpCAM1 (red) and DAPI (blue). Scale bar, 50 µm. (B). C.r from supernatants of IEC preps from day 4 C.r-GFP Il22hCD4 and Il22Plzf (green) mice stained with TO-PRO-3 and analyzed by flow cytometry in log scale (Mann Whitney, *p<0.05). Error bars represent mean ± SEM. (C). Colons from day 9 and day 13 C.r-GFP Il22hCD4 and Il22∆Tcell mice stained for GFP (green), EpCAM1 (red) and DAPI (blue). Scale bar, 50 µm. (D). C.r from supernatants of IEC preps from day 13 C.r-GFP Cntrl and Il22∆Tcell (blue) mice stained with TO-PRO-3 and analyzed by flow cytometry in log scale (Mann Whitney, **p<0.01). Error bars represent mean ± SEM. (E). Colons from d15 C.r-GFP WT and Aicda–/– µs–/– mice stained for GFP (green) and DAPI (blue). Scale bar, 50 µm. (F). Colon lamina propria lymphocytes (LPLs) from day 9 C.r Cntrl (open) and Il22∆Tcell (solid) mice stimulated with P/I+GolgiPlug for 4h and stained for TCRβ, mCD4, and L/D dye, followed by IC staining for IL-17A and IFNγ. Error bars represent mean ± SEM. ns=not significant, 3–4 mice per group, 2 independent experiments. See also Figure S4.
Figure 5.
Figure 5.. IL-22+ T cells induce robust and prolonged STAT3 activation
(A, C, and E) Colons from (A) naïve, day 4 and day 8 C.r-infected Il22hCD4 and Il22EIIa, and (C) naïve and day 4 Il22hCD4 and Il22Plzf, and (E) day 13 C.r Il22hCD4 and Il22∆Tcell mice stained for EpCAM1 (green), pSTAT3 (red) and DAPI (blue). Red arrows depict pSTAT3+ IECs. Scale bar, 50 µm. (B, D, and F) Quantitation of percent pSTAT3+ cells and intensity of pSTAT3 in sIECs and cIECs from (B) naïve, day 4 and day 8 Il22hCD4 and Il22EIIa, and (D) naïve and day 4 C.r Il22hCD4 and Il22Plzf and (F) day 13 C.r Il22hCD4 and Il22∆Tcell mice. Error bars represent mean ± SEM. (B and D) Two-way ANOVA with Bonferroni posttests; ###p<0.001, comparing different time points, *p<0.05 and ***p<0.001, WT vs lineage-specific IL-22-deficient and ϕϕϕp<0.001, sIECs vs cIECs. (F) One-way ANOVA with post-hoc Tukey tests; ***p<0.001, WT vs lineage-specific IL-22-deficient. nd=not detected. 4–5 mice per group, 2 independent experiments.
Figure 6.
Figure 6.. IL-22+ T cells upregulate host defense genes and repress IFNγ–induced genes
(A) Colon stained for EpCAM1 (green), CEACAM1 (red) and DAPI (blue). Scale bar, 50 µm. (B) IECs from naïve mice stained for EpCAM1, CEACAM1, L/D dye and CD45 and analyzed by flow cytometry or (C) EpCAM1+CD45-LD/dye- cells sorted into small crypt (SC; CEACAM1loFSCloSSClo; blue), large crypt (LC; CEACAM1intFSChiSSCint; green) and surface IECs (Srf; CEACAM1hiFSChiSSChi; red) and stained with H&E. (D-H) RNA-seq of sorted SC, LC and Srf IECs from mid/distal colons of naïve and day 9 C.r-infected Il22hCD4 and Il22∆Tcell mice. padj = adjusted p-value. (D) Two-way scatter plots of DEGs in SC, LC and Srf IECs from naïve vs day 9 C.r Cntrl (red) & naïve vs day 9 C.r Il22∆Tcell (blue). DEGs in both (purple) (padj<0.05; colored dots). (E) Count plots of DE host defense genes in SC (blue), LC (green) and Srf (red) IECs from day 9 C.r Cntrl (solid) and Il22∆Tcell (open). Normalized by library size. *padj<0.1, **padj<0.01, ***padj<0.001; day 9 C.r Cntrl vs Il22∆Tcell. ##padj<0.01, ###padj<0.001; naïve Cntrl vs day 9 C.r Cntrl. ϕp<0.1, ϕϕϕp<0.001; naïve Il22∆Tcell vs day 9 C.r Il22∆Tcell. Error bars represent mean ± SEM. ns = not significant. (F and G) GSEA dot plots of IL-22, IFNα, IFNγ, TNF and Inflammatory pathways in SC, LC, Srf and pooled IECs (All) from (F) naïve (red) vs day 9 C.r Cntrl (blue) and (G) day 9 C.r Cntrl (red) vs Il22∆Tcell (blue), Srf (red) vs pooled Crypt (blue), and SC (red) vs LC (blue). (H) GSEA bar code plots of IL-22 and IFNγ pathways in pooled IECs (All) from day 9 C.r Il22∆Tcell (blue) vs Cntrl (red). See also Figure S5. NES, normal enrichment score; FDR, false discovery rate. 2–3 mice per sample, Independent experiments: 1–2 per naïve group and 3–4 per infected group.
Figure 7.
Figure 7.. T cell-derived IL-22 promotes a shift in IEC functional programming to protect intestinal crypts
(A-C) RNA-seq of SC, LC and Srf IECs from mid/distal colons of day 9 C.r-infected Il22hCD4 and Il22∆Tcell mice. (A) Venn diagram of DEGs and pathways in SC (red), LC (green) and Srf (red) IECs from day 9 C.r-infected Il22hCD4 and Il22∆Tcell. Total DEGs or Pathways (#). (B) GNPA of SC, LC and Srf IECs from day 9 C.r-infected Il22hCD4 and Il22∆Tcell. Log2 fold change (symbol fill; up in Cntrl (red), down in Cntrl (blue)), Enrichment score (symbol size), Source: Custom Pathway (square), KEGG (circle), Wiki Pathway (diamond)), and Interaction: (symbol border; Infection (green), IL-22 (orange), IL-22 interactors (pink)). (C) Heatmaps of top DEGs in IL-22R, STAT3 and custom IEC pathways. 2–3 mice per sample and 3–4 independent experiments per group. See also Figure S6.

References

    1. Aden K, Tran F, Ito G, Sheibani-Tezerji R, Lipinski S, Kuiper JW, Tschurtschenthaler M, Saveljeva S, Bhattacharyya J, Häsler R, et al. (2018). ATG16L1 orchestrates interleukin-22 signaling in the intestinal epithelium via cGAS–STING. J Exp Med 215, 2868–2886. - PMC - PubMed
    1. Ahlfors H, Morrison PJ, Duarte JH, Li Y, Biro J, Tolaini M, Meglio PD, Potocnik AJ, and Stockinger B (2014). IL-22 Fate Reporter Reveals Origin and Control of IL-22 Production in Homeostasis and Infection. J Immunol 193, 4602–4613. - PMC - PubMed
    1. Akdis M, Palomares O, van de Veen W, van Splunter M, and Akdis CA (2012). TH17 and TH22 cells: A confusion of antimicrobial response with tissue inflammation versus protection. J Allergy Clin Immun 129, 1438–1449. - PubMed
    1. Allen A, Hutton DA, and Pearson JP (1998). The MUC2 gene product: a human intestinal mucin. Int J Biochem Cell Biology 30, 797–801. - PubMed
    1. Anders S, Pyl PT, and Huber W (2015). HTSeq—a Python framework to work with high-throughput sequencing data. Bioinformatics 31, 166–169. - PMC - PubMed

Publication types