. 2022 Mar 8;55(3):512-526.e9.
doi: 10.1016/j.immuni.2022.02.005.

Mechanistic convergence of the TIGIT and PD-1 inhibitory pathways necessitates co-blockade to optimize anti-tumor CD8+ T cell responses

Affiliations

Mechanistic convergence of the TIGIT and PD-1 inhibitory pathways necessitates co-blockade to optimize anti-tumor CD8+ T cell responses

Karl L Banta et al. Immunity. .

Abstract

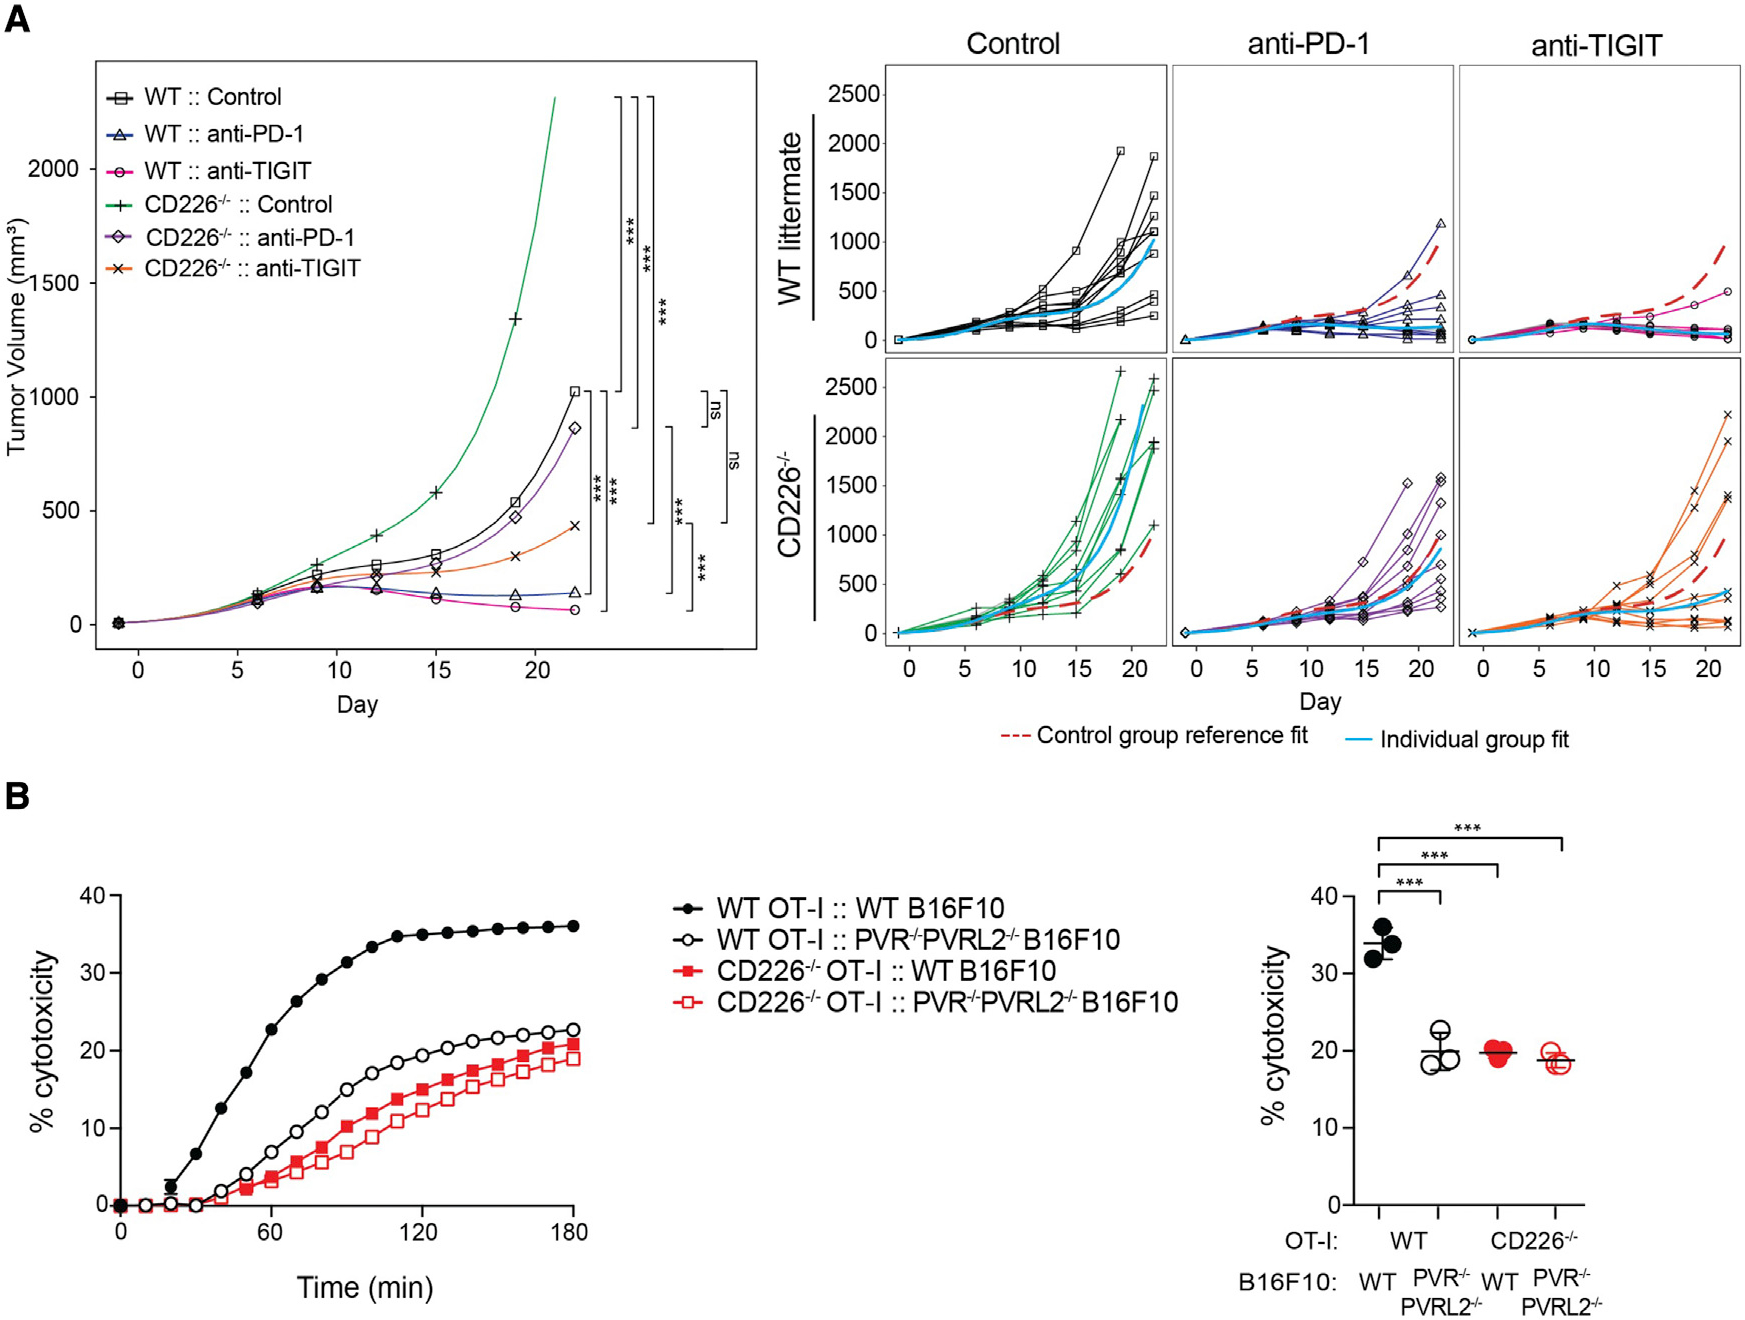
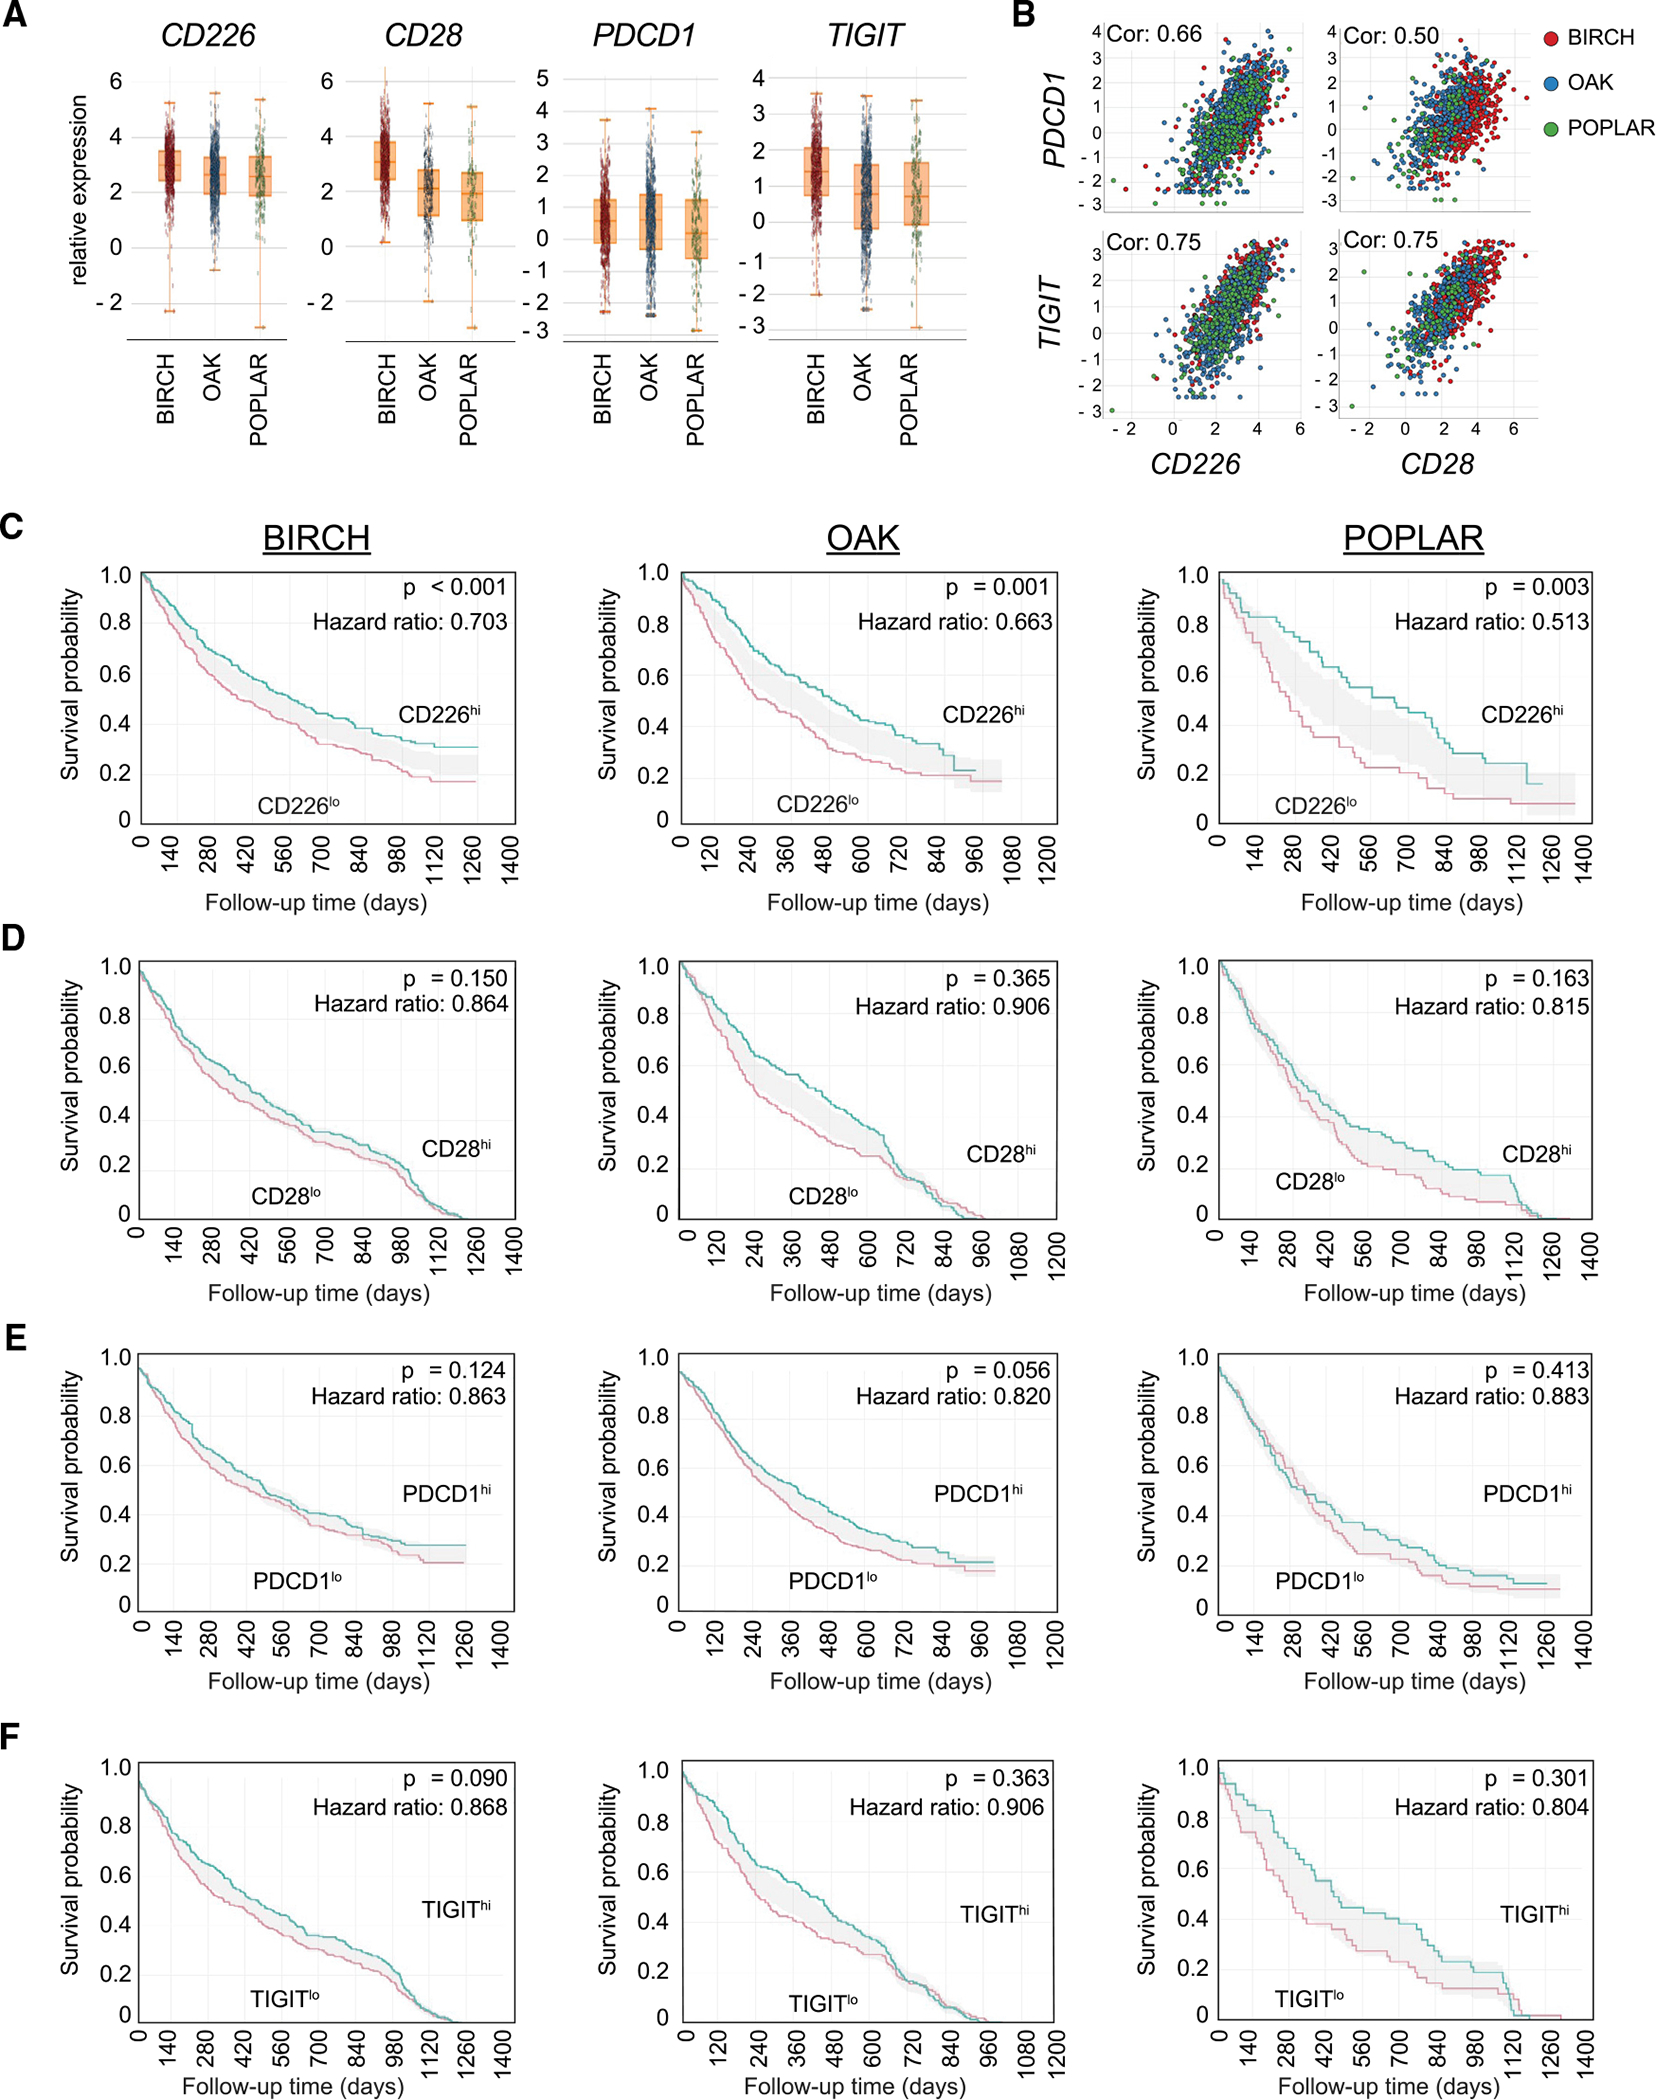
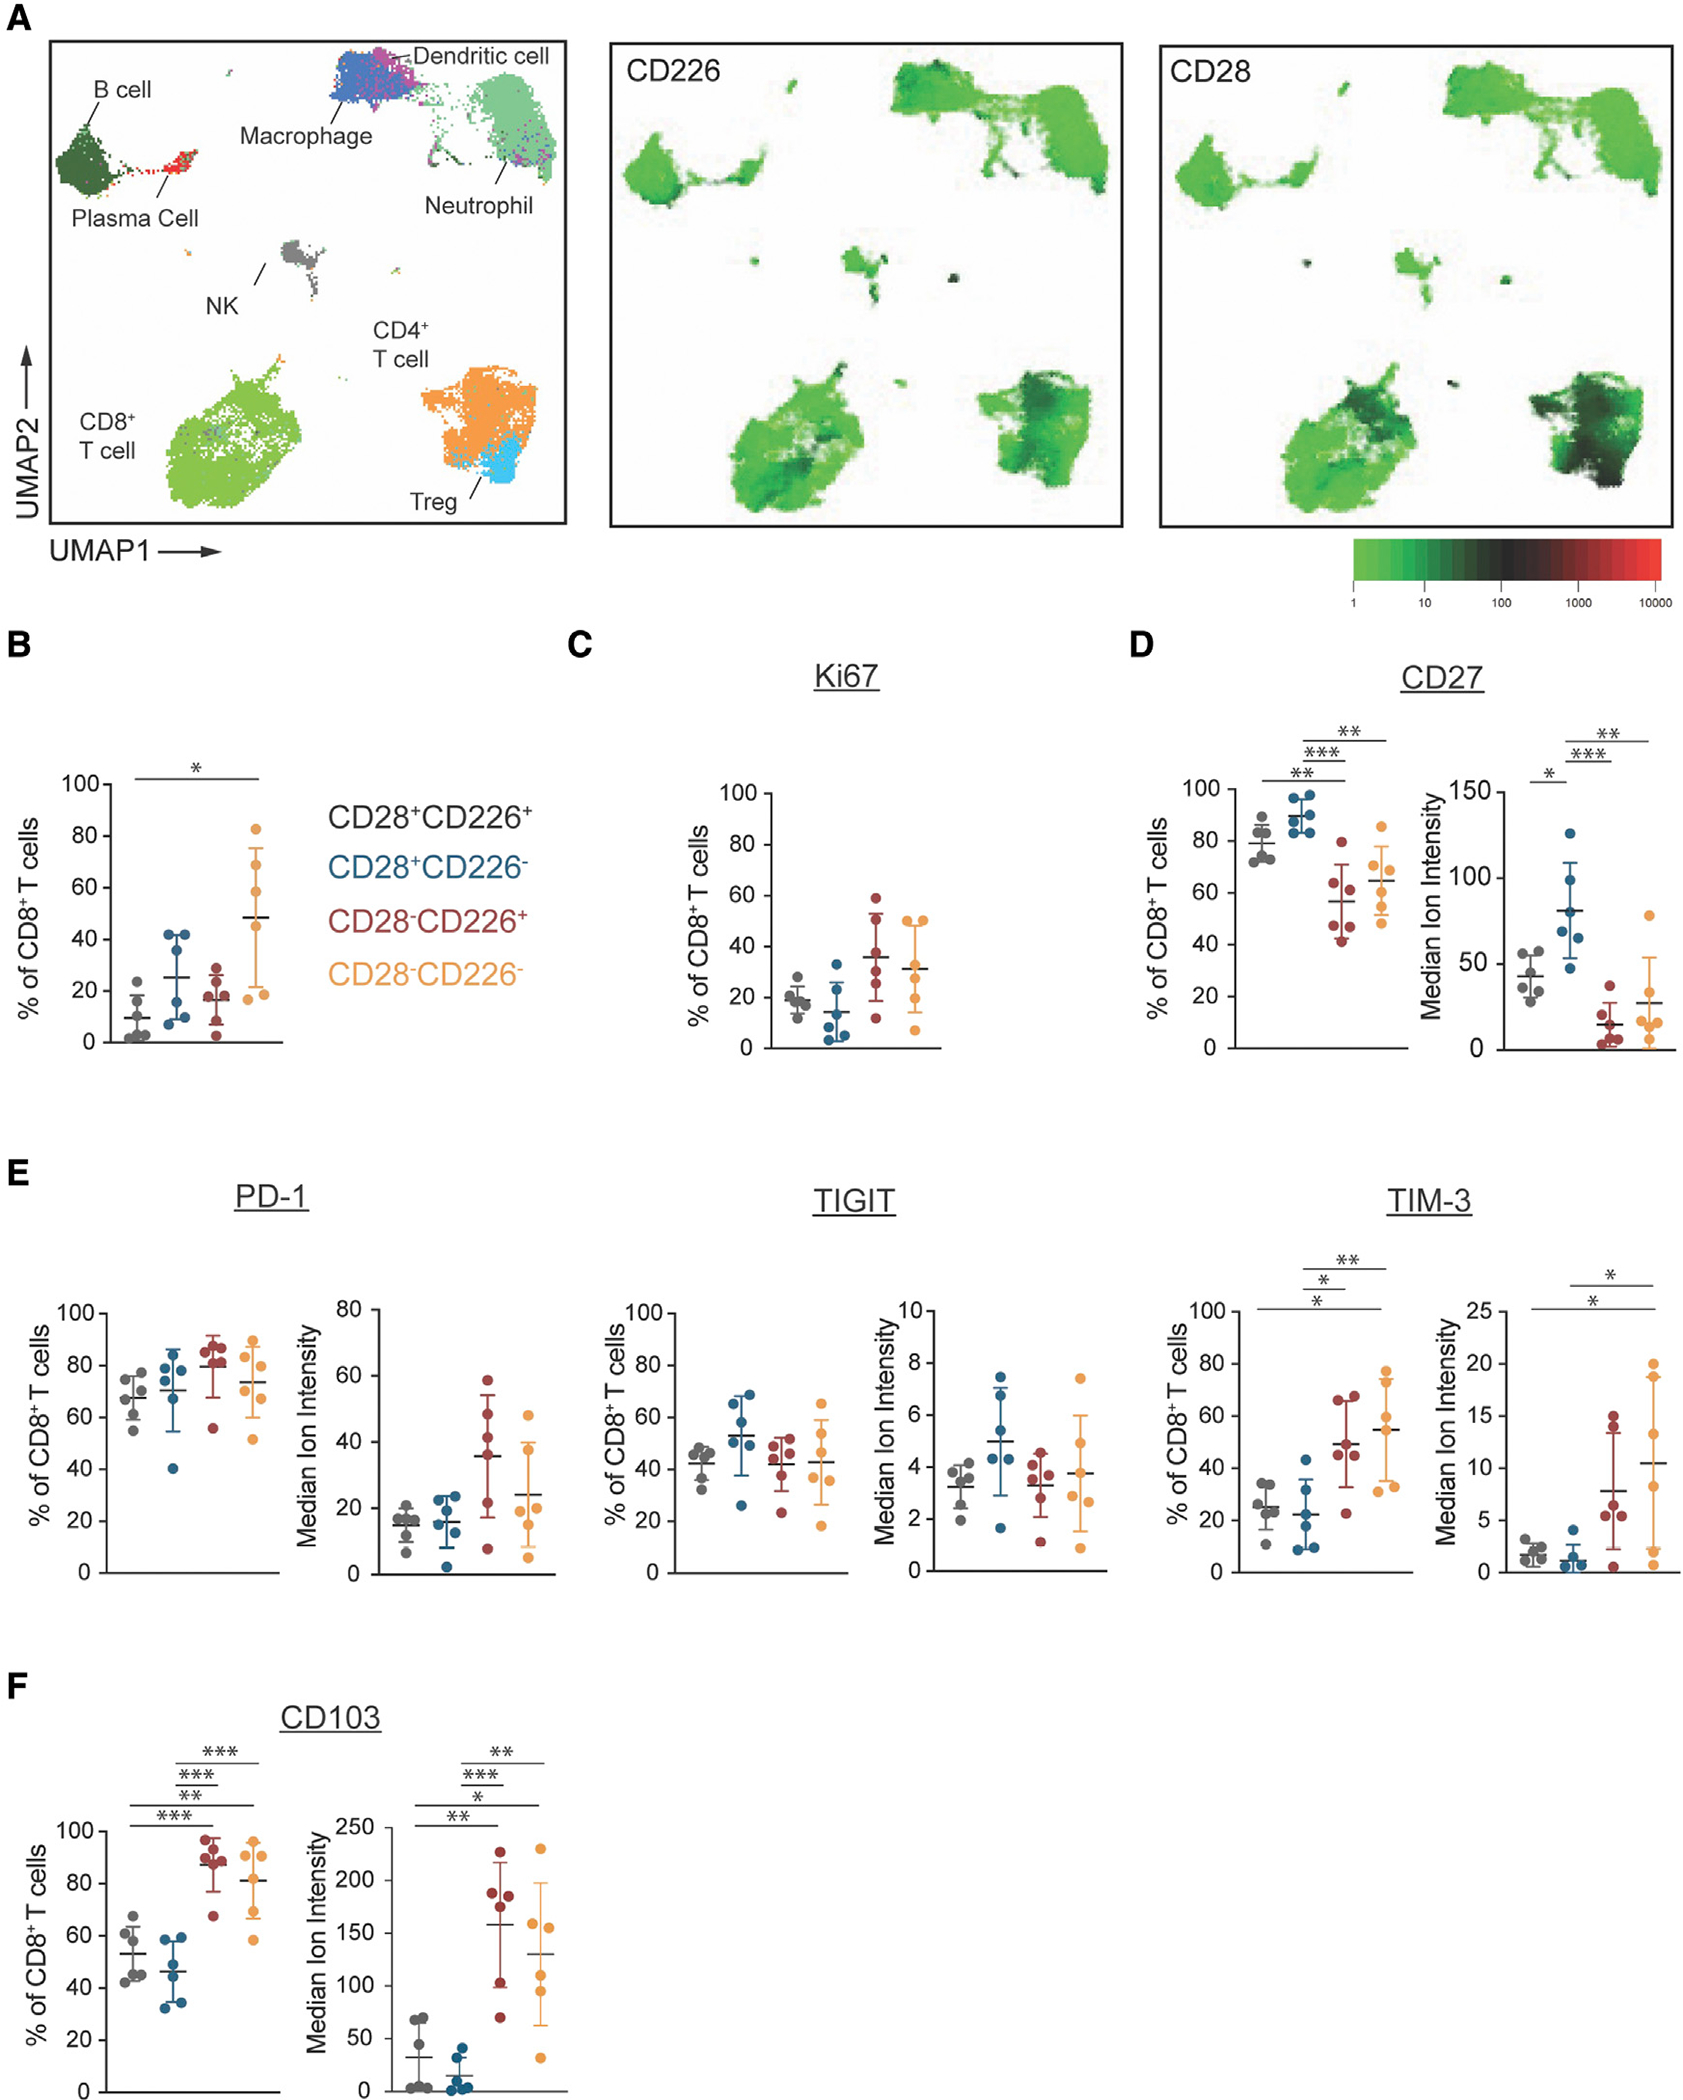
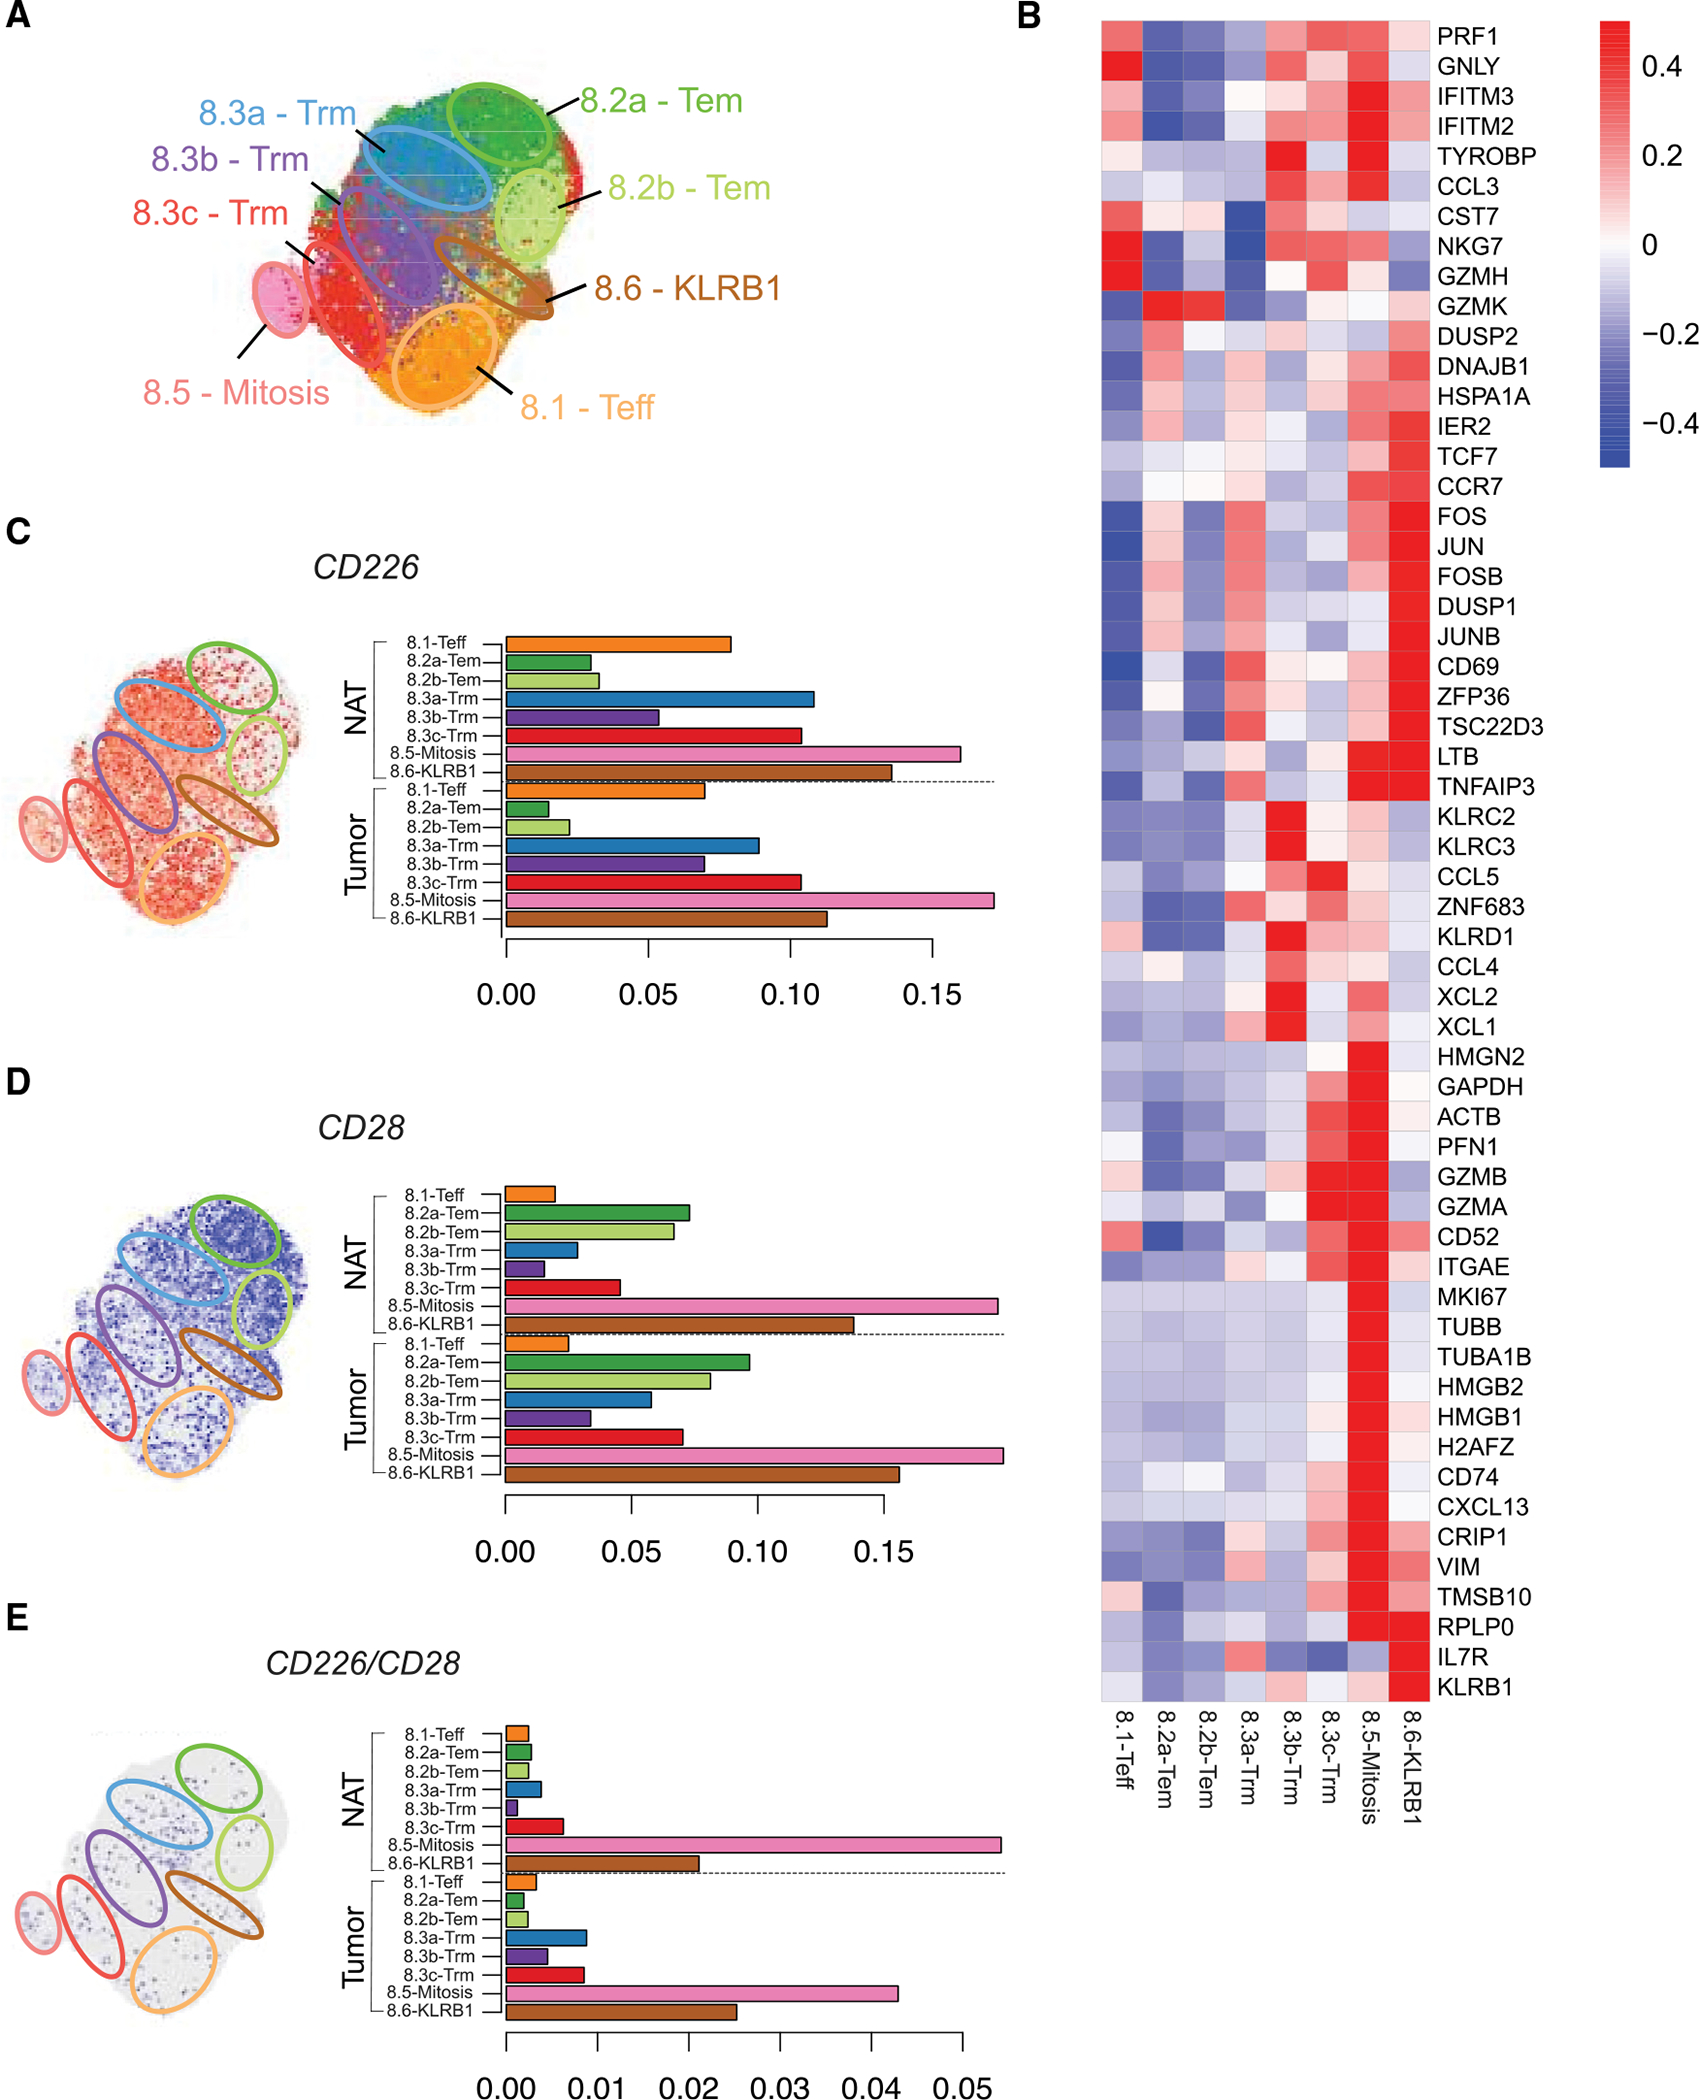
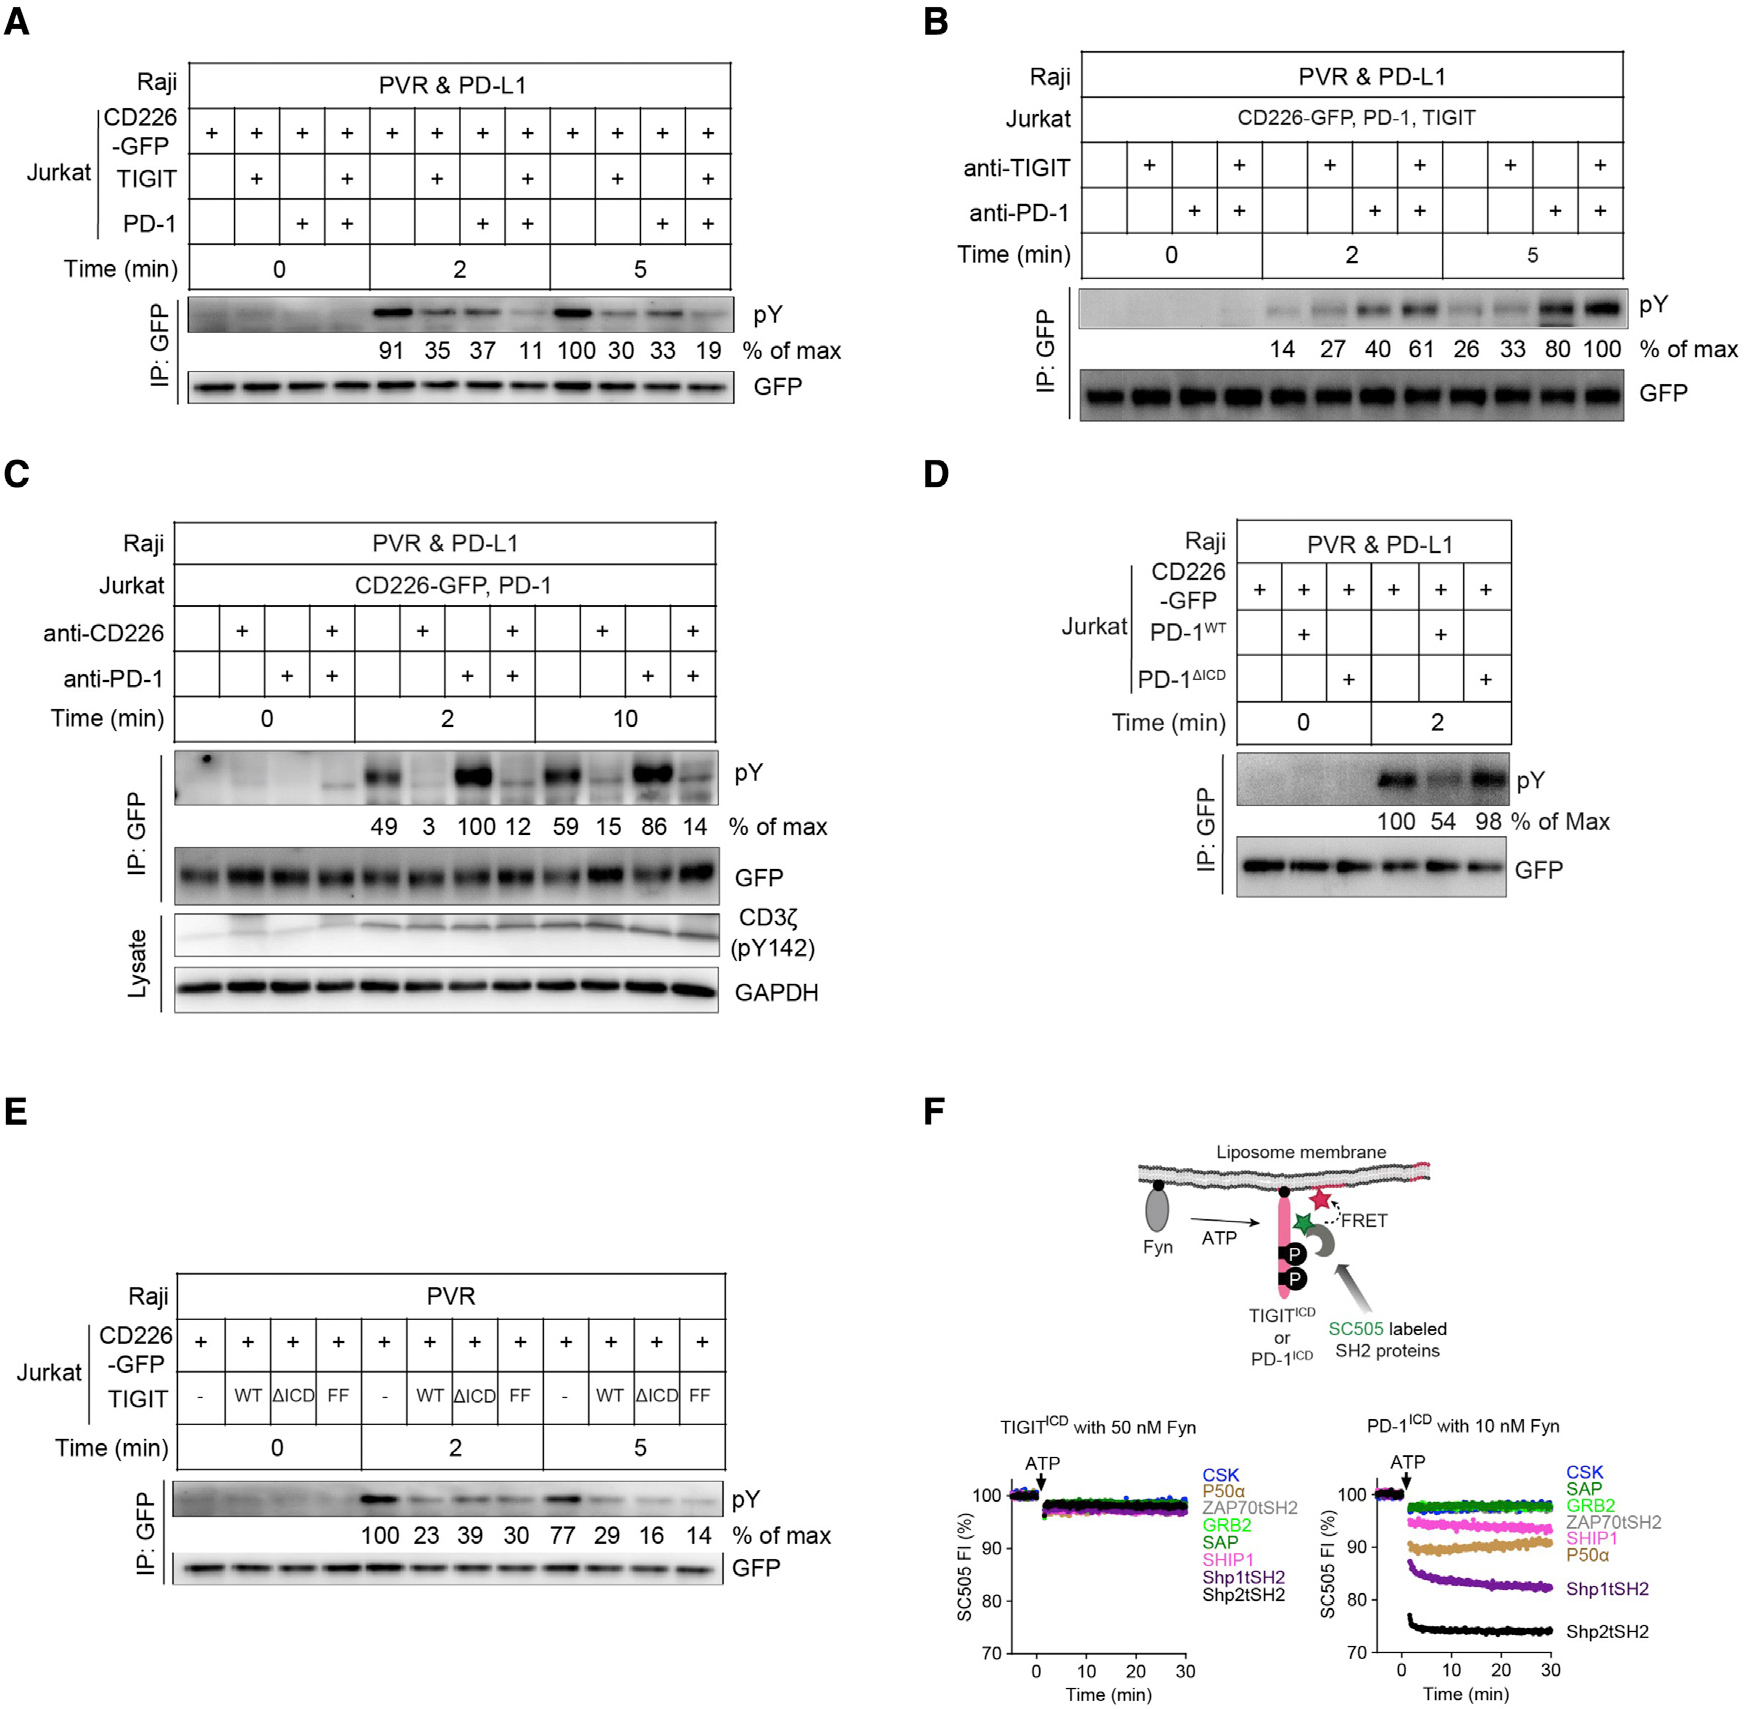
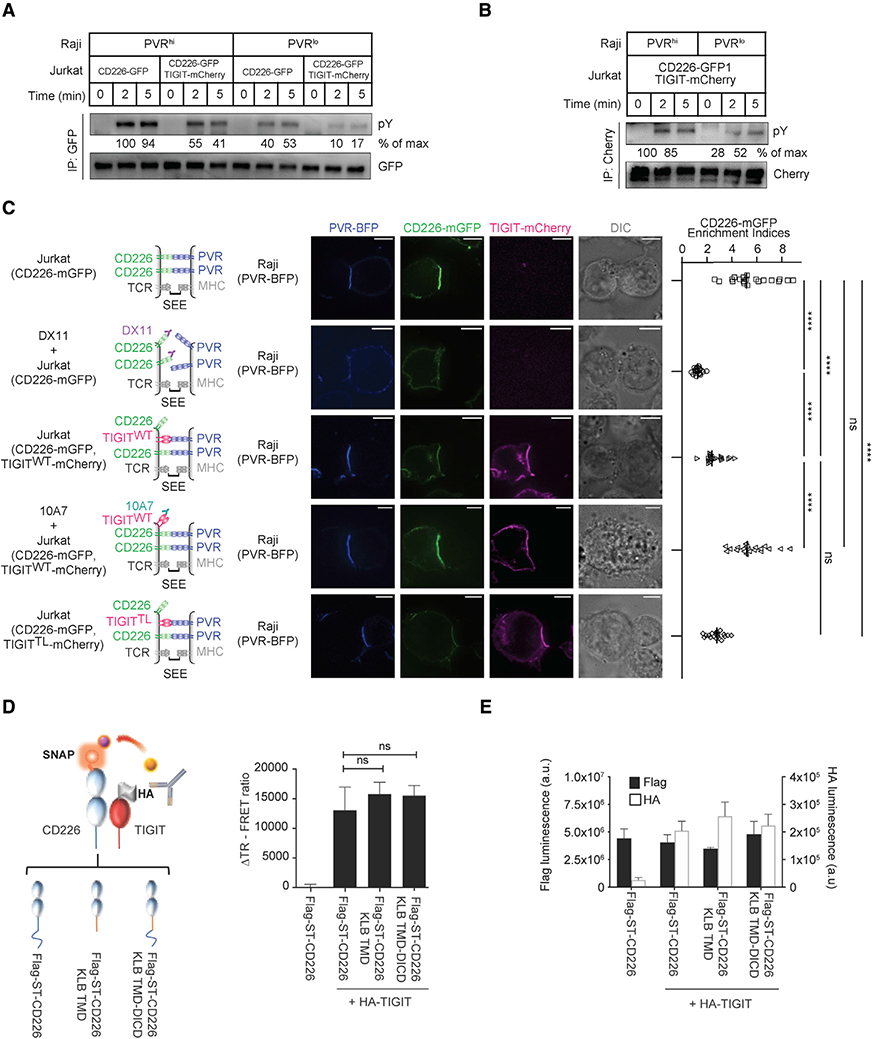
Dual blockade of the PD-1 and TIGIT coinhibitory receptors on T cells shows promising early results in cancer patients. Here, we studied the mechanisms whereby PD-1 and/or TIGIT blockade modulate anti-tumor CD8+ T cells. Although PD-1 and TIGIT are thought to regulate different costimulatory receptors (CD28 and CD226), effectiveness of PD-1 or TIGIT inhibition in preclinical tumor models was reduced in the absence of CD226. CD226 expression associated with clinical benefit in patients with non-small cell lung carcinoma (NSCLC) treated with anti-PD-L1 antibody atezolizumab. CD226 and CD28 were co-expressed on NSCLC infiltrating CD8+ T cells poised for expansion. Mechanistically, PD-1 inhibited phosphorylation of both CD226 and CD28 via its ITIM-containing intracellular domain (ICD); TIGIT's ICD was dispensable, with TIGIT restricting CD226 co-stimulation by blocking interaction with their common ligand PVR (CD155). Thus, full restoration of CD226 signaling, and optimal anti-tumor CD8+ T cell responses, requires blockade of TIGIT and PD-1, providing a mechanistic rationale for combinatorial targeting in the clinic.

Keywords: CD226; cancer immunotherapy; costimulatory receptor TIGIT; immune checkpoint blockade.


Conflict of interest statement

Declaration of interests K.L.B., A.S.C., A.A.-Y., W.E.O., T.D.W., S.M., R.C., L.C.-A., J.L.G., I.M., and E.Y.C. are or were employees of Genentech, a member of the Roche group, which develops and markets drugs for profit.

Figures

Figure 1.
Figure 1.. CD226 deficiency reduces efficacy of PD-1 and TIGIT checkpoint blockade and impairs CD8+ T cell responses
(A) BALB/c WT or Cd226−/− mice inoculated with syngeneic CT26 tumor cells and treated with isotype control, anti-PD-1, or anti-TIGIT antibodies. Tumor growth was monitored and grouped analysis and growth curves for each individual animal (n = 10 per group) are shown. Tumor volume remaining below 32 mm3 was considered to be a complete response (CR). p values are shown for end of study at day 23 using two-way ANOVA test with post hoc Tukey’s multiple comparisons; *p < 0.05; **p < 0.01; ***p < 0.001; ns, not significant. (B) CD226 deficiency impairs cytotoxicity of CD8+ T cells. WT OT-I cells (black lines) or Cd226−/− OT-I cells (red lines) were used as effector cells against B16F10 melanoma or PVR/PVRL2-deficient (PVR−/−PVRL2−/−) B16F10 target cells pulsed with OVA (SIINFEKL) peptide. Representative real-time profiling of killing is shown on the left panel. Scatterplot (right panel) shows percent cytotoxicity at the 3 h time point. Data are shown as mean ± SD of three independent experiments. p values are shown for one-way ANOVA test with post hoc Tukey’s multiple comparisons; *p < 0.05; **p < 0.01; ***p < 0.0001.
Figure 2.
Figure 2.. CD226 expression and association with clinical response to PD-L1 checkpoint blockade treatment in NSCLC
(A) Relative gene expression of CD226, CD28, PDCD1, or TIGIT in three different atezolizumab clinical trials (BIRCH, OAK, or POPLAR) in NSCLC. (B) Co-expression of CD226 (left) or CD28 (right) with PDCD1 or TIGIT are positively correlated. Shown is the Spearman correlation coefficient. (C–F) Survival based on CD226 (C), CD28 (D), PDCD1 (E), or TIGIT (F) gene expression. Kaplan-Meier plots of overall survival (OS) are shown for the atezolizumab arm in the indicated clinical trial (BIRCH, OAK, or POPLAR), with patients separated on the basis of gene expression. Patients were dichotimized into top 50% (high, green line) or bottom 50% (low, red line) relative to the median expression over all patients in the corresponding clinical trial. Two-sided p values and hazard ratios from a Cox proportional hazards model are indicated for each plot.
Figure 3.
Figure 3.. Expression of CD226 and CD28 in CD8+ T cells by CyTOF in NSCLC tumors
(A) CD45+ cells from NSCLC patient tumors (n = 6) were analyzed by CyTOF. 8,000 downloaded cells per sample were aggregated and clusters generated in an unsupervised manner by uniform approximation and projection (UMAP). Immune cell populations were defined by manual gating and projected onto the UMAP (left). Expression of CD226 (middle) or CD28 (right) across total CD45+ cells was overlaid onto the UMAP. (B) Frequencies of CD8+ T cell expressing CD226 and/or CD28 in NSCLC tumors. CD8+ T cells were subtyped by CD28+CD226+ (gray), CD28+CD226 (blue), CD28CD226+ (red), or CD28CD226 (yellow). (C–F) Comparison of expression by frequency (left), and where shown, median ion intensity (right) for indicated markers within CD8+ T cells gated on CD226 and/or CD28 expression. (C) Proliferation marker Ki67. (D) CD27. (E) Checkpoint inhibitors PD-1, TIGIT, and TIM-3. (F) Trm cell marker CD103. Whiskers denote mean ± SD (n = 6). p values are shown for one-way ANOVA with post hoc Tukey’s for multiple comparisons; *p < 0.05, **p < 0.01, ***p < 0.001.
Figure 4.
Figure 4.. CD226 and CD28 expression in CD8+ T cells in NSCLC tumors by scRNA-seq
(A) Cluster analysis was performed on scRNA-seq data of CD8+ T cells obtained from all six NSCLC patients and plotted by UMAP dimensionality reduction. Cluster assignments were generated by unsupervised clustering and colored by cluster assignment. Approximate regions of the clusters are demarcated with labeled ovals (top left). (B) Relative expression of T cell-associated genes across CD8+ clusters. (C–E) Individual CD8+ T cells are plotted within each UMAP (left) or plotted by bar graph to depict frequency (right) of CD226 (C), CD28 (D), or CD226 and CD28 (E) expression within each CD8+ T cell cluster.
Figure 5.
Figure 5.. PD-1 and TIGIT converge to regulate CD226 through distinct mechanisms.
(A–E) Representative phospho-tyrosine immunoblots showing CD226 phosphorylation upon co-culture of Jurkat cells expressing indicated receptors with SEE-loaded Raji cells expressing indicated ligands. In (B) and (C), Jurkat cells were pretreated with anti-TIGIT (10A7), anti-PD-1 (pembrolizumab), anti-CD226 (DX11), or in combination. CD226-GFP was enriched by GFP IP after lysing the Raji:Jurkat conjugates at the indicated time points. The “% of max” values under each blot denote the optical densities (OD) of the corresponding bands above normalized to the OD of the strongest band of the same blot. (F) Cartoon on top depicts a liposome-based FRET assay for measuring the recruitment of SC505-labeled SH2 proteins to liposome-reconstituted, Fyn-phosphorylated TIGITICD or PD-1ICD. Shown on the bottom are representative time courses of SC505 FI before and after addition of 1 mM ATP for TIGITICD (left) or PD-1ICD (right). Green stars denote SC505 dye, red stars denote rhodamine-PE lipid, black circles denote His10 tags.
Figure 6.
Figure 6.. TIGIT inhibits CD226 through lateral associations through ECDs
(A and B) Representative immunoblots showing the degrees of CD226 and TIGIT phosphorylation (pY) after co-culturing Jurkat cells expressing indicated receptors and SEE-loaded Raji cells expressing indicated ligands. Times denote the duration of co-culture before lysis. CD226-GFP and TIGIT-mCherry were captured using GFP IP and mCherry IP, respectively. The “% of max” values under each blot denote the OD of the corresponding bands above normalized to the OD of the strongest band of the same blot. (C) Confocal images of Jurkat:Raji cell conjugates probing the effects of TIGIT on PVR-mediated CD226 accumulation to the Raji:Jurkat interface. Left: depiction of the relevant proteins at the cell conjugate. Middle: confocal and differential interference contrast (DIC) images of a Raji:Jurkat conjugate acquired five minutes after contact. Right: scatterplot summarizing CD226 enrichment indices of the five conditions (means ± SD, n = 20 conjugates from three independent experiments). Scale bars, 5 μm. ****p < 0.0001; ns, not significant; Student’s t test (n = 20). (D and E) Interaction studies between CD226 and TIGIT using FRET. (D) Cell surface TR-FRET signal between acceptor labeled full-length or chimeric Flag-ST-CD226 and donor labeled full length HA-TIGIT. (E) Cell surface expression of Flag-ST-CD226 constructs (black bar) and HA-TIGIT (white bar) as measured by ELISA. Data are average of 2 independent experiments, each performed in triplicate, and shown as mean ± SEM ns = not significant.

References

    1. Amsen D, van Gisbergen KPJM, Hombrink P, and van Lier RAW (2018). Tissue-resident memory T cells at the center of immunity to solid tumors. Nat. Immunol. 19, 538–546. - PubMed
    1. Balança C-C, Salvioni A, Scarlata C-M, Michelas M, Martinez-Gomez C, Gomez-Roca C, Sarradin V, Tosolini M, Valle C, Pont F, et al. (2021). PD-1 blockade restores helper activity of tumor-infiltrating, exhausted PD-1hiCD39+ CD4 T cells. JCI Insight 6, e142513. - PMC - PubMed
    1. Banchereau R, Chitre AS, Scherl A, Wu TD, Patil NS, de Almeida P, Kadel EE III, Madireddi S, Au-Yeung A, Takahashi C, et al. (2021). Intratumoral CD103+ CD8+ T cells predict response to PD-L1 blockade. J. Immunother. Cancer 9, e002231. - PMC - PubMed
    1. Béziat V, Rapaport F, Hu J, Titeux M, Bonnet des Claustres M, Bourgey M, Griffin H, Bandet É, Ma CS, Sherkat R, et al. (2021). Humans with inherited T cell CD28 deficiency are susceptible to skin papillomaviruses but are otherwise healthy. Cell 184, 3812–3828.e30. - PMC - PubMed
    1. Braun M, Aguilera AR, Sundarrajan A, Corvino D, Stannard K, Krumeich S, Das I, Lima LG, Meza Guzman LG, Li K, et al. (2020). CD155 on Tumor Cells Drives Resistance to Immunotherapy by Inducing the Degradation of the Activating Receptor CD226 in CD8+ T Cells. Immunity 53, 805–823.e15. - PubMed

MeSH terms