. 2022 Mar 8;38(10):110489.
doi: 10.1016/j.celrep.2022.110489.

Monosodium urate crystals regulate a unique JNK-dependent macrophage metabolic and inflammatory response

Affiliations

Monosodium urate crystals regulate a unique JNK-dependent macrophage metabolic and inflammatory response

Isidoro Cobo et al. Cell Rep. .

Abstract

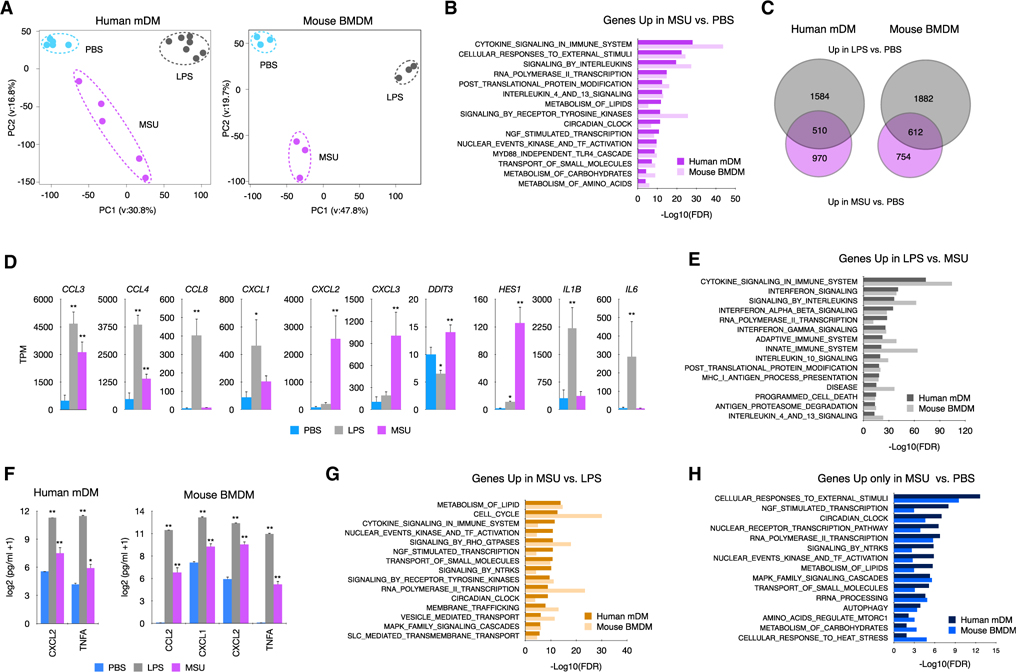
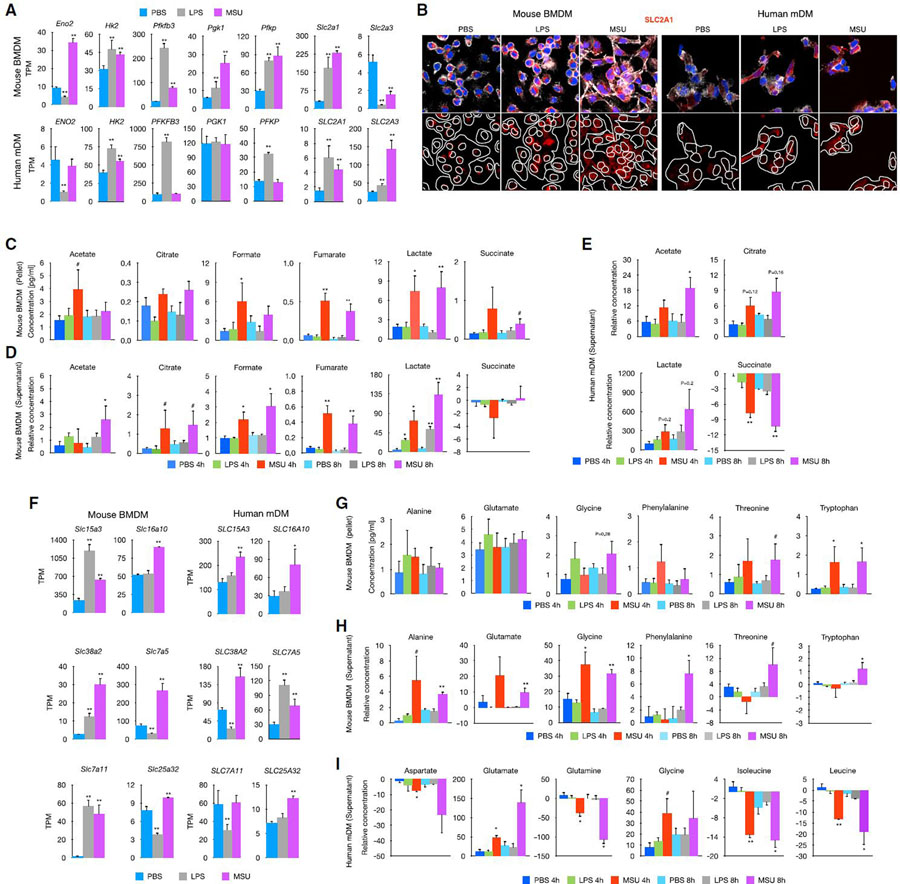
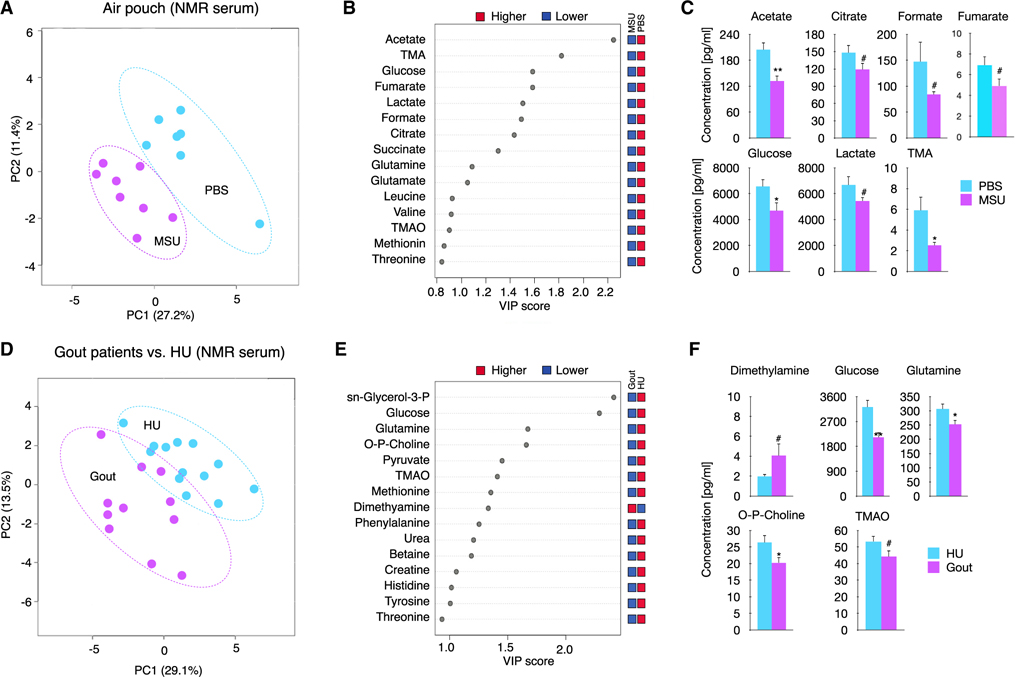
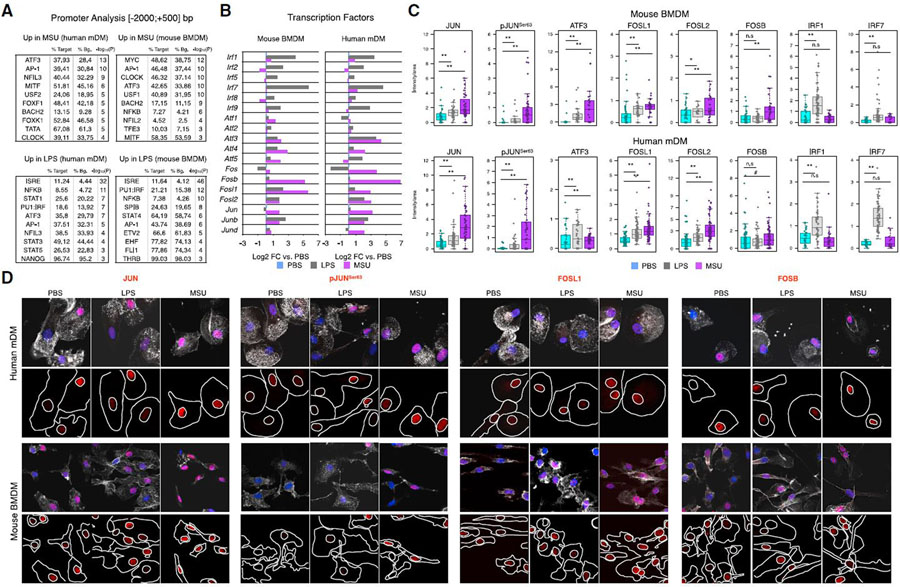
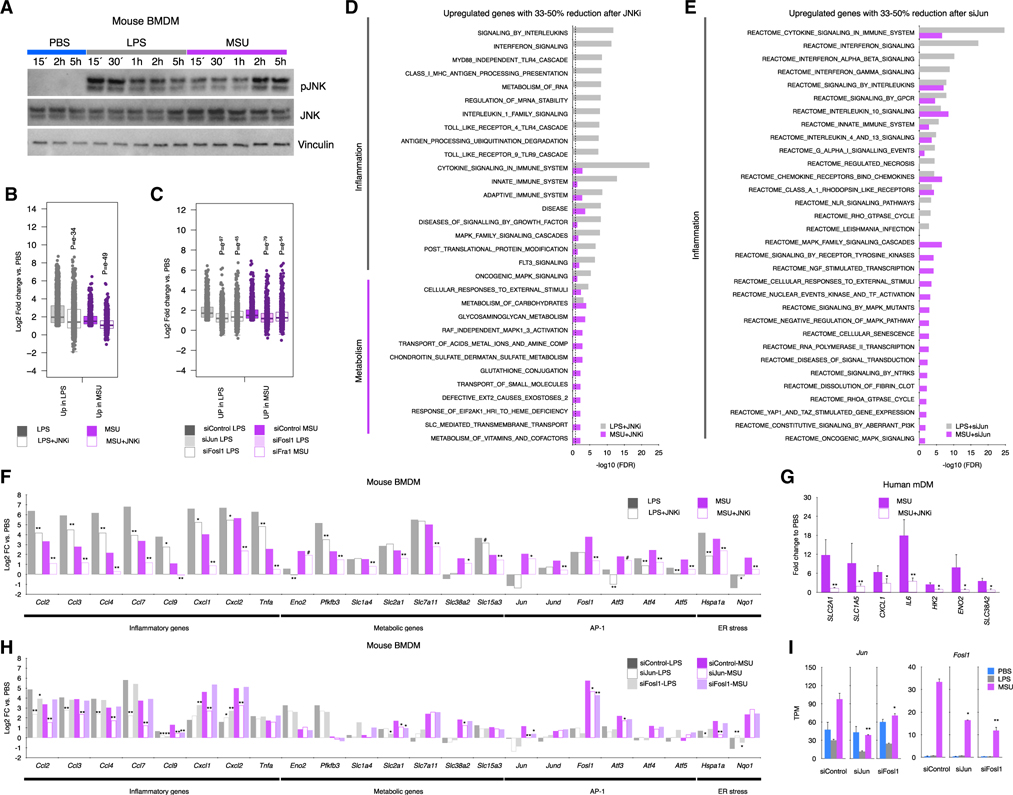
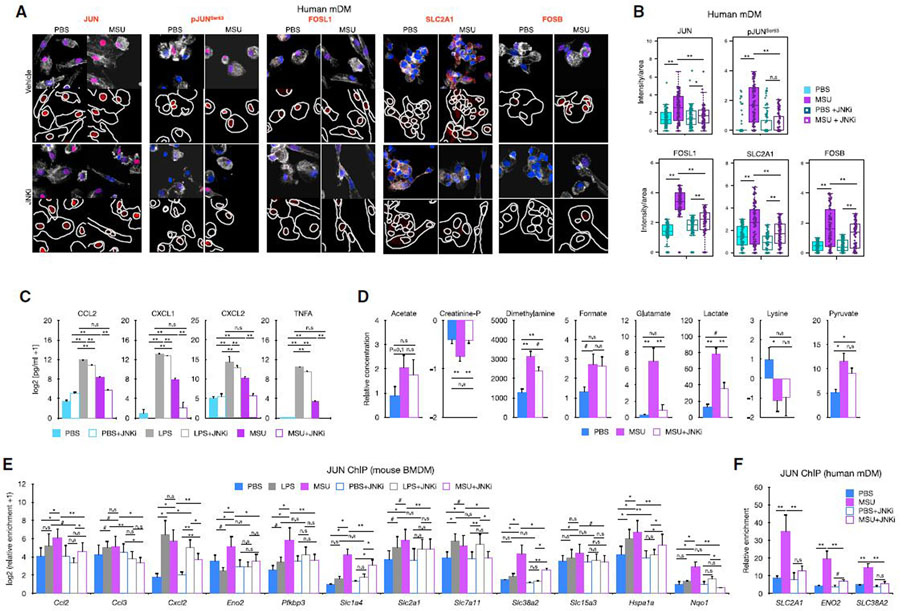
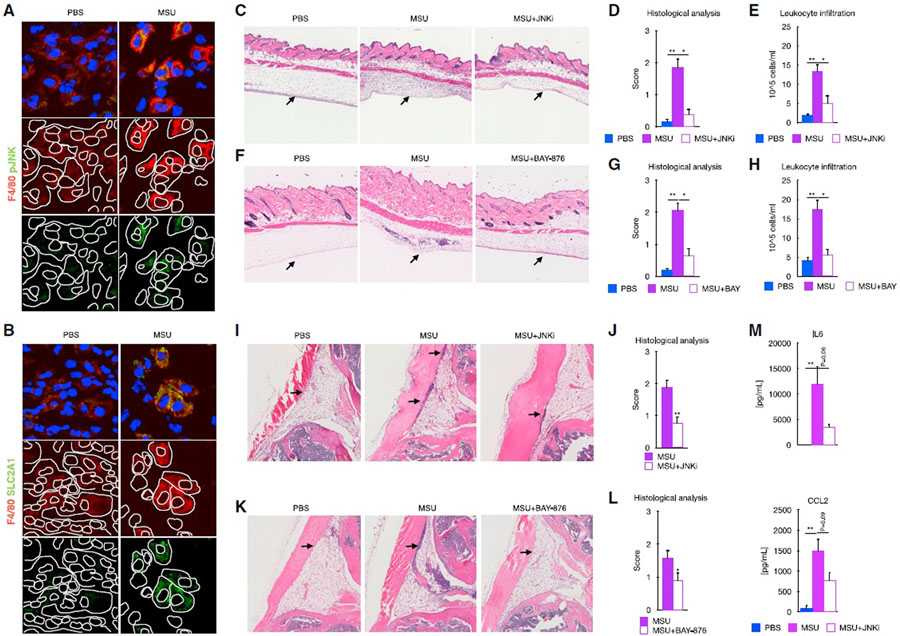
Monosodium urate crystals (MSUc) induce inflammation in vivo without prior priming, raising the possibility of an initial cell-autonomous phase. Here, using genome-wide transcriptomic analysis and biochemical assays, we demonstrate that MSUc alone induce a metabolic-inflammatory transcriptional program in non-primed human and murine macrophages that is markedly distinct to that induced by LPS. Genes uniquely upregulated in response to MSUc belong to lipid and amino acid metabolism, glycolysis, and SLC transporters. This upregulation leads to a metabolic rewiring in sera from individuals and mice with acute gouty arthritis. Mechanistically, the initiating inflammatory-metabolic changes in acute gout flares are regulated through a persistent expression and increased binding of JUN to the promoter of target genes through JNK signaling-but not P38-in a process that is different than after LPS stimulation and independent of inflammasome activation. Finally, pharmacological JNK inhibition limits MSUc-induced inflammation in animal models of acute gouty inflammation.

Keywords: AP-1 activation; JNK; MSU crystals; SLC2A1; glycolysis; gout; macrophage; transcriptional regulation.


Conflict of interest statement

Declaration of interests Research grant Astra-Zeneca (R.T.) and consulting at SOBI, Selecta, Horizon, Allena, Astra-Zeneca (R.T.). Research grant Aspire-Pfizer and Novartis (M.G.).

Figures

Figure 1.
Figure 1.. MSUc activates a distinct transcriptional program
(A) Principal-component analysis of human mDMs (left) or mouse BMDMs (right) treated with LPS (100 ng/mL) or MSUc (250 μg/mL) for 5 h showing the divergence of the transcriptomic program (n ≥ 5 donors in mDMs and n = 3 for BMDMs). (B) Gene ontology analysis of genes upregulated in macrophages treated with MSUc versus PBS showing inflammatory gene sets as well as activation of nuclear receptor, NGF, circadian clock and metabolic signaling pathways. (C) Venn diagram showing the overlap between genes upregulated in macrophages treated with LPS or MSUc. (D) Examples of inflammatory genes upregulated in mDMs treated with LPS or MSUc showing upregulation of some genes in MSUc but greater upregulation in LPS. (E) Gene ontology analysis of genes downregulated in MSUc versus LPS showing inflammatory gene sets including signaling by interferons. (F) ELISA for CXCL2 and TNFA in mDMs and additionally CCL2 and CXCL1 for BMDMs in the supernatant of macrophages treated with LPS or MSUc showing increased concentration. (G) Gene ontology analysis using REACTOME of genes upregulated in MSUc versus LPS showing metabolic gene sets as well as activation of NGF, receptors tyrosine kinase (RTKs), and circadian clock signaling pathways. (H) Gene ontology analysis using REACTOME of genes uniquely upregulated by MSUc showing enrichment in genes sets of response to external stimuli activation of circadian clock, NGF, and metabolic signaling pathways (#p < 0.10, *p < 0.05, **p < 0.01).
Figure 2.
Figure 2.. MSUc alters the metabolic program of macrophages
(A) Bar plot showing upregulation of genes involved in glucose metabolism in macrophages treated with MSUc (250 μg/mL) or LPS (100 ng/mL) at 5 h. (B) Protein analysis by IF showing upregulation of SLC2A1 in macrophages treated with MSUc or LPS at 5 h. Signal for specific antibodies is pseudocolored in red. DAPI in blue is used to delineate DNA structures. (C and D) Analysis of the concentration of glycolytic metabolites by 1D 1H-NMR in the pellet (C) or supernatant (D) or BMDMs treated with LPS or MSUc for 4 or 8 h showing activation of glycolysis in macrophages treated with MSUc to a higher degree than LPS (n ≥ 4/condition). (E) 1D 1H-NMR showing increased levels of acetate, citrate, and lactate and reduced levels of succinate in the supernatant of mDMs treated with MSUc for 4 or 8 h (n = 3 donors/condition). (F) Bar graphs showing upregulation of several amino acid transporters (top) or genes involved in glycine/serine/threonine metabolism (bottom) in macrophages treated with MSUc or LPS for 5 h assessed by RNA-seq. (G and H) 1D 1H-NMR showing increased levels of glycine, threonine, and tryptophan in the pellet (G) and alanine, glutamate, phenylalanine, and tryptophan in supernatant (H) of BMDMs treated with MSUc or LPS for 4 or 8 h (n ≥ 4/condition). (I) 1D 1H-NMR showing increased levels of glutamate and glycine, and reduced levels of aspartate, glutamine, isoleucine, and leucine in the supernatant of mDMs treated with MSUc for 4 or 8 h (n = 3 donors/condition) (#p < 0.10, *p < 0.05, **p < 0.01).
Figure 3.
Figure 3.. MSUc leads to systemic metabolic changes
(A) PLS-DA showing serum levels of metabolites of mice injected with PBS or MSUc (3 mg) in the air pouch as assessed by 1D 1H-NMR showing the divergence between groups (n ≥ 7 mice/group). (B) The top 15 metabolites were ranked based on variable important projection (VIP) scores from the PLS-DA model (A). The blue and red squares indicate whether metabolite abundance was higher or lower between phenotypes. (C) Bar graphs showing reduced concentration of several metabolites including acetate, citrate, formate, fumarate, glucose, lactate, and trimethylamine (TMA) in the serum of mice collected 8 h after injected with MSUc in the air pouch. (D) PLS-DA showing serum levels of metabolites of individuals with gout flare versus HU as assessed by 1D 1H-NMR. Data show the divergence between groups (n = 11 individuals with gout and n = 13 individuals with HU). (E) The top 15 metabolites were ranked based on VIP scores from the PLS-DA model (B). The blue and red squares indicate whether metabolite abundance was higher or lower between phenotypes. (F) Bar graphs show reduced concentration of several metabolites including glucose, glutamine, phosphocholine, and TMA and increased dimethylamine in the serum of individuals with gout (#p < 0.10, *p < 0.05, **p < 0.01).
Figure 4.
Figure 4.. MSUc leads to activation of AP-1 but not IRFs
(A) Motif analysis using HOMER of the promoter (−2,000; +500 bp, from the transcription start site) of genes upregulated by LPS (100 ng/mL) or MSUc (250 μg/mL) for 5 h in mDMs or BMDMs showing enrichment in motifs for AP-1, MYC, MITF, NRF2, and nuclear receptors—but not IRFs—in the promoters of genes upregulated by MSUc. (B) Bar plots showing upregulation of several AP-1 members—but not IRFs—in macrophages treated with MSUc for 5 h assessed by RNA-seq. Note the higher upregulation of AP-1 in MSUc compared with LPS except for ATF3 in mDMs. (C) Quantification of nuclear expression of JUN, pJUNSer63, ATF3, FOSL1, FOSL2, FOSB, IRF1, and IRF7 in macrophages treated with MSUc or LPS for 5 h showing upregulation of AP-1 family members—but not IRF1 or IRF7—in macrophages treated with MSUc. (D) Representative images of protein analysis by IF showing upregulation of JUN, pJUNSer63, FOSL1, and FOSB in macrophages treated with MSUc or LPS for 5 h used to generate plots in (C). Signal for specific antibodies is pseudocolored in red. DAPI in blue is used to delineate DNA structures. Note the higher upregulation of AP-1 in MSUc compared with LPS (#p < 0.10, *p < 0.05, **p < 0.01).
Figure 5.
Figure 5.. The inflammatory and metabolic program induced by MSUc is regulated through JNK
(A) Protein analysis by WB of JNK and pJNK expression in BMDMs treated with LPS (100 ng/mL) or MSUc (250 μg/mL) at various time points. Data show prolonged pJNK expression in BMDMs treated with MSUc. (B and C) Boxplots showing amelioration of gene expression after treatment with JNKi (20 μM) versus vehicle of genes upregulated by LPS or MSUc (B), genes upregulated only in LPS o rMSUc or commonly upregulated in LPS and MSUc for 5 h (C) (n ≥ 5/group). Data represent the distribution of fold change of upregulated genes in MSUc versus PBS or LPS versus PBS in cells treated with MSU + JNKi or LPS + JNKi. (D) Gene ontology analysis using REACTOME of genes between 33% and 50% reduction of expression in MSUc + JNKi versus MSUc or LPS + JNKi versus LPS. Data show enrichment in inflammatory gene sets in LPS and MSUc and metabolic gene sets in MSUc. (E) Gene ontology analysis using REACTOME of genes between 33% and 50% reduction of expression in siJun-MSUc versus siControl-MSUc or siJun-LPS versus siControl-LPS. Data show enrichment in inflammatory gene sets in LPS and MSUc gene sets. (F–H) Expression analysis by RNA-seq (F and H) or qRT-PCR (G) of inflammatory and metabolic genes induced by MSUc or LPS showing reduction after treatment with JNKi in BMDMs (F) (n ≥ 5/group) or mDMs (G) (n = 3 donors/group), or in BMDMs after treatment with siJun or siFosl1 (H). (I) Expression analysis by RNS-seq of Jun or Fosl1 in cells incubated with siControl or siJun or siFosl1 showing downregulation of Jun or Fosl1 in siJun or siFosl1 (#p < 0.10, *p < 0.05, **p < 0.01). Broken lines in (D and E) represents the cutoff for significance −log10(0.05) = 1.30.
Figure 6.
Figure 6.. Increased JUN binding to the promoter of inflammatory and metabolic genes is regulated by JNK and is required for the activation of the inflammatory and metabolic program induced by MSUc
(A and B) Protein analysis by IF of JUN, pJUNSer63, FOSL1, SLC2A1, and FOSB in mDMs treated with MSUc (250 μg/mL) or MSUc + JNKi (20 μM) for 5 h. Quantification of (B) corresponds to experiment shown in (A), and shows downregulation of protein expression in MSU + JNKi versus MSUc (n = 3/condition). Signal for specific antibodies is pseudocolored in red. DAPI in blue is used to delineate DNA structures. (C) Protein analysis by ELISA of cytokines in the supernatant of BMDMs treated with LPS or MSUc overnight w/wo JNKi showing complete reduction in MSUc + JNKi versus MSUc and partial reduction in LPS + JNKi versus LPS (n = 3/group). (D) Analysis of metabolites by 1D 1H-NMR in the culture medium of BMDMs treated with MSUc or MSUc + JNKi for 8 h showing varying degree of recovery (n = 3/condition). (E and F) JUN ChIP in BMDMs (E) or mDMs (F) treated with LPS, MSUc, LPS + JNKi, or MSUc + JNKi and qPCR over regulatory regions of genes upregulated by LPS or MSUc. Data show higher levels of JUN binding in macrophages treated with MSUc that is reduced upon treatment with JNKi (n = 4/condition) (#p < 0.10, *p < 0.05, **p < 0.01).
Figure 7.
Figure 7.. Signaling by JNK and SLC2A1 is required for the MSUc-induced damage in vivo
(A and B) Protein analysis by IF showing expression of SLC2A1 (A) and pJNK (B) in macrophages in the subcutaneous cavity of the air pouch when injected with MSUc for 8 h(n = 2/group). Signal for specific antibodies is pseudocolored in red. DAPI in blue is used to delineate DNA structures. (C) Histological analysis by H&E is showing the recruitment of inflammatory cells (arrows) induced by MSUc in the air pouch is reduced upon treatment with JNKi (15 mg/kg; n ≥ 4/group). (D and E) Pathological assessment of inflammatory cell infiltrates of the air pouch (D) and neutrophil count of the air pouch lavage (E) showing reduction in MSUc + JNKi versus MSUc (n ≥ 4/group). (F) Histological analysis by H&E is showing the recruitment of inflammatory cells (arrows) induced by MSUc in the air pouch is reduced upon treatment with BAY-876 (5 mg/kg; n ≥ 5/group). (G and H) Pathological assessment of inflammatory cell infiltrates of the air pouch (G) and neutrophil count of the air pouch lavage (H) showing reduction in MSUc + BAY-876 versus MSUc (n ≥ 10/group). (I and J) Histological analysis by H&E showing reduction in the recruitment of inflammatory cells (arrow) in the synovial cavity of mice injected with MSUc + JNKi (15 mg/kg) versus MSUc (n ≥ 10/group). (K and L) Histological analysis by H&E showing reduction in the recruitment of inflammatory cells (arrow) in the synovium of mice injected with MSUc + BAY-876 (7.5 mg/kg) versus MSUc (n ≥ 7/group). (M) Protein analysis by ELISA of serum levels of IL-6 or CCL2 in mice injected with MSUc w/wo JNKi in the air pouch showing reduction in MSUc + JNKi versus MSUc (n = 4/group) (#p < 0.10, *p < 0.05, **p < 0.01).

References

    1. Adcock IM, and Caramori G (2001). Cross-talk between pro-inflammatory transcription factors and glucocorticoids. Immunol. Cell Biol. 79, 376–384. - PubMed
    1. Amann R, and Peskar BA (2002). Anti-inflammatory effects of aspirin and sodium salicylate. Eur. J. Pharmacol. 447, 1–9. - PubMed
    1. Ameyar-Zazoua M, Wisniewska MB, Bakiri L, Wagner EF, Yaniv M, and Weitzman JB (2005). AP-1 dimers regulate transcription of the p14/p19ARF tumor suppressor gene. Oncogene 24, 2298–2306. - PubMed
    1. Angel P, Hattori K, Smeal T, and Karin M (1988). The jun proto-oncogene is positively autoregulated by its product, Jun/AP-1. Cell 55, 875–885. - PubMed
    1. Angel P, Szabowski A, and Schorpp-Kistner M (2001). Function and regulation of AP-1 subunits in skin physiology and pathology. Oncogene 20, 24132–2423. - PubMed

Publication types