. 2022 Mar 8;38(10):110504.
doi: 10.1016/j.celrep.2022.110504.

Adaptive integration of self-motion and goals in posterior parietal cortex

Affiliations

Adaptive integration of self-motion and goals in posterior parietal cortex

Andrew S Alexander et al. Cell Rep. .

Abstract

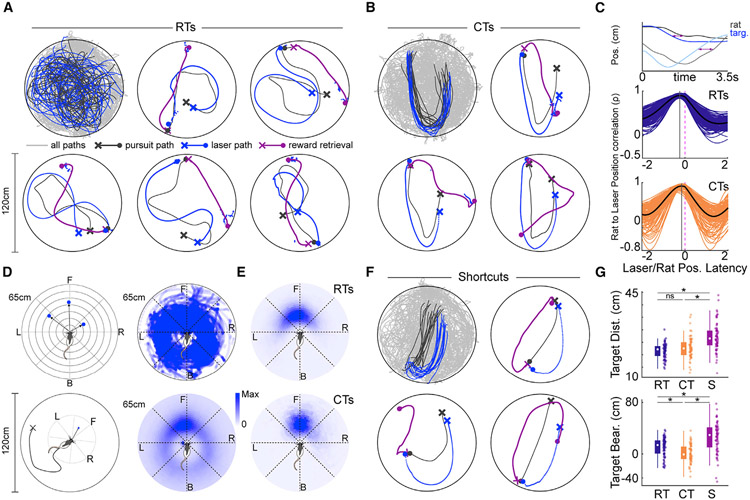
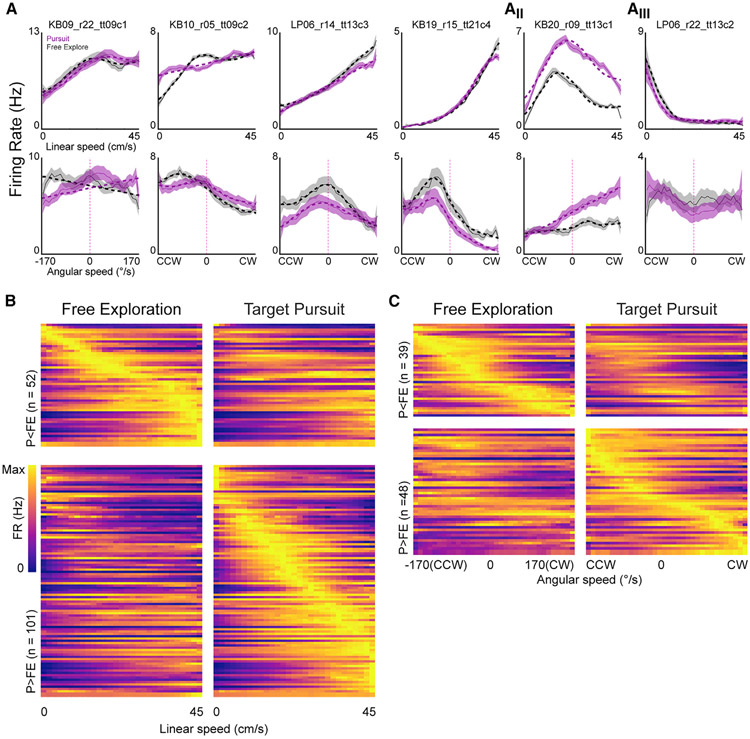
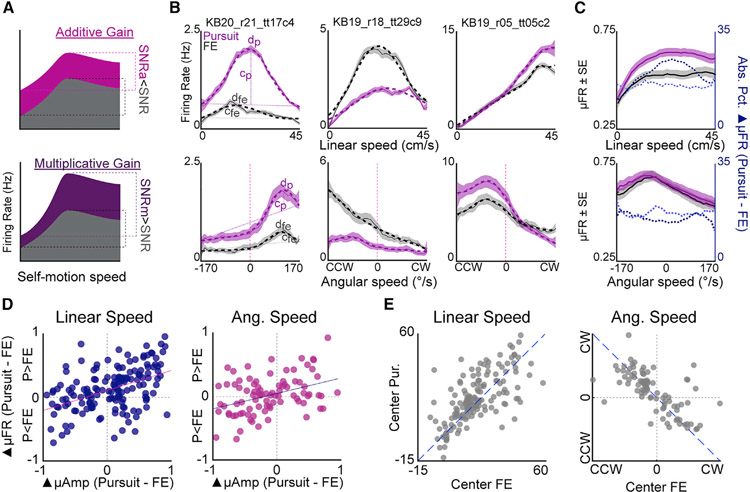
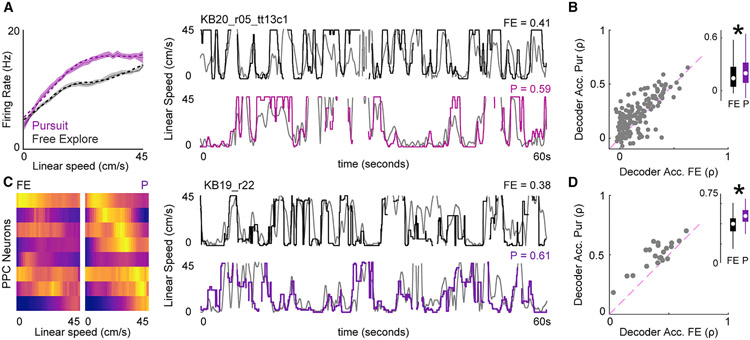
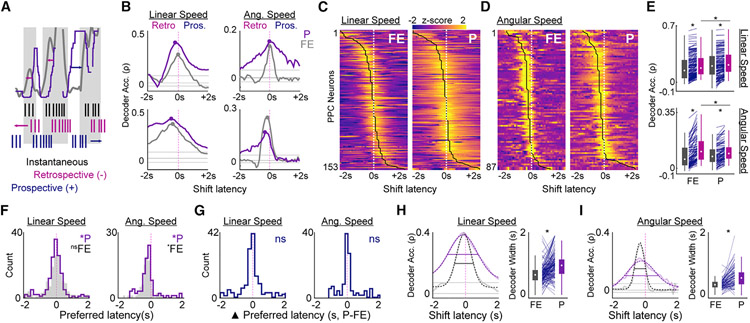
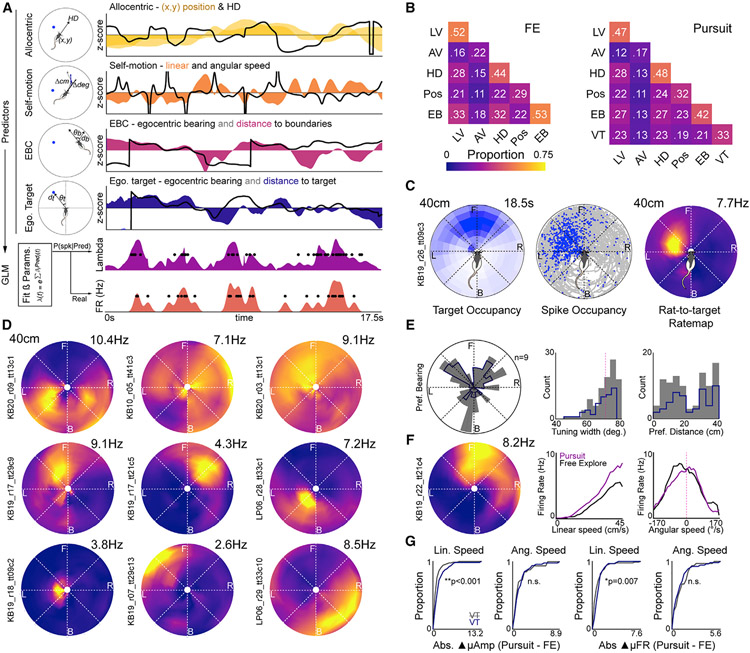
Rats readily switch between foraging and more complex navigational behaviors such as pursuit of other rats or prey. These tasks require vastly different tracking of multiple behaviorally significant variables including self-motion state. To explore whether navigational context modulates self-motion tracking, we examined self-motion tuning in posterior parietal cortex neurons during foraging versus visual target pursuit. Animals performing the pursuit task demonstrate predictive processing of target trajectories by anticipating and intercepting them. Relative to foraging, pursuit yields multiplicative gain modulation of self-motion tuning and enhances self-motion state decoding. Self-motion sensitivity in parietal cortex neurons is, on average, history dependent regardless of behavioral context, but the temporal window of self-motion integration extends during target pursuit. Finally, many self-motion-sensitive neurons conjunctively track the visual target position relative to the animal. Thus, posterior parietal cortex functions to integrate the location of navigationally relevant target stimuli into an ongoing representation of past, present, and future locomotor trajectories.

Keywords: behavior; context; egocentric; gain-modulation; posterior parietal cortex; prediction; pursuit; self-motion; timescale; vision.


Conflict of interest statement

Declaration of interests The authors declare no competing interests.

Figures

Figure 1.
Figure 1.. Rats pursue visual targets and exhibit spatial shortcuts on known trajectories
(A) Rats chase a floor-projected visual target moving in pseudo-random trajectories (RTs). Top left: all paths throughout an example target pursuit session (light gray), all RT pursuit paths (dark gray), and all RTs of the visual target (blue). Remaining plots depict 5 example pursuits with trial-starting location (X), approximate location of target interception (circle), and path to reward retrieval (purple) marked. Rat trajectories are depicted in light gray and target trajectories are in blue. (B) Top left: all paths throughout an example target pursuit session (light gray), all pursuits along the characteristic trajectory (CTs; dark gray), and all characteristic paths of the visual target (blue). Remaining plots depict 3 example characteristic trajectories marked as in (A). (C) Quantification of the temporal relationship between the animal and the visual target. Top plot: animal (x, dark gray; y, light gray) and target position (x, blue; y, light blue) across time on an example CT. Arrows illustrate temporal lag between rat and visual target position. Middle plot: correlation between rat and target position as a function of temporal shift of rat position relative to the target during RTs. Black line, mean of all trials. Purple lines, individual sessions. Bottom plot: same as above but for CTs. Position correlation curves are right shifted during CTs relative to RTs, indicating that rat and target positions were more temporally proximal during CTs. Vertical gray lines depict latency with peak correlation for each trial type. (D) Mapping of visual target relative to the rat in egocentric coordinates. Top left: scheme for examining egocentric relationship between visual target and rat (see STAR methods). Bottom left: illustration of egocentric position of target relative to the rat independent of allocentric position or heading in the 120-cm-diameter circular environment. Top right: all visual target positions relative to the animal during mobility within an example pursuit session. Bottom right: mean target occupancy in egocentric coordinates across all animals and pursuit sessions (n = 132). (E) Top: mean target occupancy in egocentric coordinates for all RTs across all animals and sessions. Bottom: same as above but for all CTs. (F) Same as in (A and B), but for CT trials in which the animal executed a spatial shortcut (S). (G) Median distance and bearing to the visual target for RT, CT, and S trials. See also Figure S1; Videos S1, S2, S3, S4, S5, S6, S7, S8, and S9.
Figure 2.
Figure 2.. Nonlinear self-motion correlates of PPC are modulated by navigational demands
(A) Linear (top) and angular (bottom) speed tuning curves for 6 PPC neurons (columns, mean ± SE). Dashed lines are best model fit and are shown only for tuning curves that had significant modulation. Aii, a neuron with Gaussian-like nonlinear linear speed tuning; Aiii, a neuron with robust firing during immobility. (B) Linear speed tuning curves for both FE and pursuit epochs for all PPC neurons with significant modulation. Top plots: linear speed tuning curves for neurons that had greater mean activation during FE (left column), sorted by peak linear speed bin in FE. Bottom plots: linear speed tuning curves for neurons that had greater mean activation during pursuit (right column), sorted by peak linear speed bin in pursuit. (C) Same as (B), but for neurons with significant angular speed tuning. See also Figures S2 and S3.
Figure 3.
Figure 3.. Gain modulation of self-motion tuning as a function of navigational demand
(A) Schematic of additive (top) and multiplicative (bottom) gain modulation on self-motion tuning curves. Gray curve depicts hypothetical relationship between self-motion and firing rate for a baseline session. Colored curves depict hypothetical relationship between self-motion and firing rate for a session in which either multiplicative or additive gain modulation manifests. Additive gain modulation reduces the signal-to-noise ratio (SNR; SNRa < SNR), while multiplicative gain produces an enhanced SNR for the modulated session (SNRm > SNR). (B) Three PPC neurons with rate differences between FE and pursuit that are concentrated at specific linear (top row) or angular (bottom row) speeds. Left plot depicts parameters of Gaussian-modified linear fits. Sloped dashed lines indicate linear regression. Self-motion receptive fields are fitted by an additive Gaussian function. The center (D) and amplitude (C) of the Gaussian map, the peak of the self-motion receptive field, and its magnitude above the linear fit, respectively. (C) Shaded line plots depict mean population tuning for linear (top) and angular (bottom) speed-sensitive neurons for pursuit (pink) and FE sessions (gray). Dashed lines depict mean percent difference in firing rate as a function of speed (dark blue, PPC neurons with greater activation in pursuit than FE [P > FE]; light blue, PPC neurons with greater activation in FE [P < FE]). (D) Peak normalized differences in receptive field amplitude between pursuit and free explore (▴μAmp) versus difference in mean firing rate (▴μFR) for PPC neurons with significant linear and/or angular speed correlates. (E) Position of linear and angular receptive fields for pursuit versus FE. See also Figures S3 and S4.
Figure 4.
Figure 4.. Multiplicative gain modulation produces enhanced dynamic range and decoding of self-motion correlates
(A) Left: a linear speed-sensitive neuron with multiplicative gain modulation. Right: decoding of linear speed using spiking activity of the same neuron in FE (top) and pursuit (bottom). Correlation (Spearman’s rho, ρ) between predicted speed (black/pink) and true speed (gray) is indicated above each plot. (B) Linear speed decoder for pursuit versus FE. Inset: median + IQR of decoder accuracy for FE (black) and pursuit (purple). (C) Left plot: linear speed tuning curves for 8 simultaneously recorded PPC neurons in FE and pursuit. Rows, linear speed tuning curves of the same neurons recorded in both conditions. Colormap, low (purple) to maximum firing (yellow) across both sessions. Right: example population decoding of linear speed for FE (top) and pursuit (bottom). (D) Ensemble decoding accuracy for pursuit versus FE. See also Figure S5.
Figure 5.
Figure 5.. History-dependent spiking correlates are informative about self-motion state over extended temporal windows
(A) Schematic of temporal relationship among spiking, self-motion, and decoding. Top: gray and purple lines, real and predicted linear speed, respectively. Gray shading, times of speed change. Colored arrows, direction of spike train temporal shift. Bottom: hypothetical spike trains for a single neuron with instantaneous (black), retrospective (pink), or prospective (blue) sensitivity to speed. (B) Decoder accuracy as a function of spike train temporal shift for 4 PPC neurons in both FE (gray) and pursuit conditions (purple). Left column: 2 PPC neurons sensitive to linear speed. Right column: 2 PPC neurons sensitive to angular speed. Gray horizontal lines, the 99th, 50th, and 1st percentiles of randomized decoding accuracy (see STAR methods). Dots, preferred latency of spike train temporal shift yielding peak decoding. (C) Decoding accuracy latency curves for all linear-speed-sensitive neurons, sorted by preferred latency within FE (left) and pursuit (right). (D) Same as in (C), but for all angular speed sensitive neurons. (E) Comparison between decoding accuracy at instantaneous (gray) and preferred latency (pink) across sessions for linear (top) and angular (bottom) speed sensitive neurons. (F) Distribution of preferred shift latencies for linear and angular speed neurons in pursuit and FE. (G) Differences in preferred latency between pursuit and FE for linear and angular speed neurons. (H) Left: decoding accuracy latency curve for a linear-speed-sensitive cell in pursuit and FE with corresponding model fits (dashed lines). Colored horizontal bars are plotted at ~50% of the peak to visualize width differences between sessions. Right: decoder in pursuit versus FE for linear speed sensitive neurons. (I) Same as in (H) but for the temporal window of angular speed decoding. See also Figure S6.
Figure 6.
Figure 6.. PPC neurons track self-motion and the egocentric position of the visual target
(A) Schema of generalized linear modeling (GLM) framework. Left column: illustrations of different predictor classes. Right column: 17.5 s of Z-scored values for the different predictor classes. Black lines, directional predictors. Shaded colors, all other predictors. Bottom plots: GLM-derived probability of spiking for each timestamp (lambda) and real spike train. (B) Proportion of all PPC neurons sensitive to each predictor class (diagonal) and all pairwise combinations of predictor classes (off diagonal) for FE (left) and pursuit (right). LV, linear velocity; AV, angular velocity; HD, head direction; Pos, allocentric position; EB, egocentric boundary; VT, visual target. (C) Rat-to-target ratemaps. Left plot: heatmap of egocentric occupancy of target relative to the rat (white, low occupancy; blue, high occupancy). Middle: trajectory plot of all egocentric target positions (gray) and positions where a single neuron spiked (blue). Right: rat-to-target ratemap of a neuron active when the target is to the animal’s front left. (D) Rat-to-target ratemaps for 9 PPC neurons with significant sensitivity to the egocentric position of the target. Top row: 3 neurons with broad bearing selectivity and limited target distance information. Bottom 2 rows: 6 neurons with more restricted target-position-receptive fields possessing both bearing and distance components. (E) Properties of egocentric target receptive fields. Left: preferred bearing of all PPC neurons with significant tuning to the target in gray. Dark blue, preferred bearing for PPC neurons with reliable bearing. Middle: widths of egocentric bearing tuning. Right: preferred distances to visual target. All colors as in left plot. (F) PPC neuron with simultaneous sensitivity to the egocentric position of the visual target and self-motion with pursuit related gain modulation. Left plot: rat-to-target ratemap. Middle plot: linear speed tuning curves in pursuit (purple) and FE (black). Right: angular speed tuning curves for both sessions. (G) Left 2 plots: cumulative density functions of absolute difference in receptive field amplitude (i.e., multiplicative gain) between pursuit and FE for linear and angular speed-sensitive neurons conjunctively sensitive to target position (VT, purple) or not (VT, gray). Significant rightward shift of VT curve indicates that neurons with target sensitivity exhibited greater gain modulation. Right 2 plots: same as left plots, but for absolute difference in mean rate (i.e., additive gain) between self-motion-sensitive neurons with or without VT sensitivity. See also Figure S7.

Similar articles

Cited by

References

    1. Akrami A, Kopec CD, Diamond ME, and Brody CD (2018). Posterior parietal cortex represents sensory history and mediates its effects on behaviour. Nature 554, 368–372. 10.1038/nature25510. - DOI - PubMed
    1. Alexander AS, Carstensen LC, Hinman JR, Raudies F, Chapman GW, and Hasselmo ME (2020). Egocentric boundary vector tuning of the retrosplenial cortex. Sci. Adv 6, eaaz2322. 10.1126/sciadv.aaz2322. - DOI - PMC - PubMed
    1. Andersen RA, and Cui H (2009). Intention, action planning, and decision making in parietal-frontal circuits. Neuron 63, 568–583. 10.1016/j.neuron.2009.08.028. - DOI - PubMed
    1. Andersen RA, and Mountcastle VB (1983). The influence of the angle of gaze upon the excitability of the light- sensitive neurons of the posterior parietal cortex. J. Neurosci 3, 532–548. - PMC - PubMed
    1. Angelaki DE, and Cullen KE (2008). Vestibular system: the many facets of a multimodal sense. Annu. Rev. Neurosci 31, 125–150. 10.1146/annurev.neuro.31.060407.125555. - DOI - PubMed

Publication types