. 2022 Apr 1;127(4):928-937.
doi: 10.1152/jn.00380.2021. Epub 2022 Mar 9.

Differential impact of movement on the alpha and gamma dynamics serving visual processing

Affiliations

Differential impact of movement on the alpha and gamma dynamics serving visual processing

Elizabeth Heinrichs-Graham et al. J Neurophysiol. .

Abstract

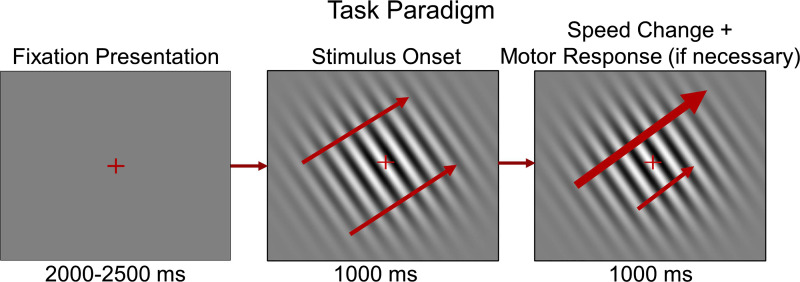
Visual processing is widely understood to be served by a decrease in alpha activity in occipital cortices, largely concurrent with an increase in gamma activity. Although the characteristics of these oscillations are well documented in response to a range of complex visual stimuli, little is known about how these dynamics are impacted by concurrent motor responses, which is problematic as many common visual tasks involve such responses. Thus, in the current study, we used magnetoencephalography (MEG) and modified a well-established visual paradigm to explore the impact of motor responses on visual oscillatory activity. Thirty-four healthy adults viewed a moving gabor (grating) stimulus that was known to elicit robust alpha and gamma oscillations in occipital cortices. Frequency and power characteristics were assessed statistically for differences as a function of movement condition. Our results indicated that occipital alpha significantly increased in power during movement relative to no movement trials. No differences in peak frequency or power were found for gamma responses between the two movement conditions. These results provide valuable evidence of visuomotor integration and underscore the importance of careful task design and interpretation, especially in the context of complex visual processing, and suggest that even basic motor responses alter occipital visual oscillations in healthy adults.NEW & NOTEWORTHY Processing of visual stimuli is served by occipital alpha and gamma activity. Many studies have investigated the impact of visual stimuli on motor cortical responses, but few studies have systematically investigated the impact of motor responses on visual oscillations. We found that when participants are asked to move in response to a visual stimulus, occipital alpha power was modulated whereas gamma responses were unaffected. This suggests that these responses have dissociable roles in visuomotor integration.

Keywords: MEG; magnetoencephalography; occipital cortex; oscillations; peak frequency.


Conflict of interest statement

No conflicts of interest, financial or otherwise, are declared by the authors.

Figures

None
Graphical abstract
Figure 1.
Figure 1.
Visual task paradigm. The fixation cross was presented 2.0–2.5 s before the mobile-gabor patch is presented. After 1.0 s, the gabor grating then either sped up or slowed down for 1.0 s. Participants were instructed to respond by button press to either an increase or decrease in the speed of the grating stimulus; the condition to which they responded was counter-balanced between participants.
Figure 2.
Figure 2.
Left: time-frequency spectrogram of peak alpha and gamma activity, with frequency (Hz) shown on the y axis and time (s) shown on the x axis. The color legend is displayed below the spectrogram and denotes percentage change from baseline power (−0.7 to -0.2 s). Time-frequency bins of significant activity (alpha: 10–16 Hz from 0.15–0.55 s and 1.15–1.55 s, 1.0 s = stimulus speed change; gamma: 44–76 Hz from 0.15–0.55 s and 1.15–1.55 s) were imaged relative to the bin’s baseline power. Right: two-dimensional (2-D) maps of the whole head sensor array are shown. Sensors with significant alpha ERD activity are denoted in cooler colors in the left array, whereas sensors of significant gamma ERS activity are denoted with warmer colors in the right array (P values < 0.001, corrected). ERD, event-related desynchronization; ERS, event-related synchronization.
Figure 3.
Figure 3.
Top: the group-averaged whole brain map (pseudo t) depicting gamma ERS activity across both conditions and time windows is displayed centrally. Plots of power (left, in % change from baseline) and peak frequency (right; in Hz) for each condition (Red: Move, Blue: No-Move) are shown for Time 1 (i.e., before speed change) and Time 2 (after speed change). There was a main effect of time on gamma power (P = 0.034), such that power decreased from Time 1 to Time 2. However, there was no effect of condition, nor was there a time-by-condition interaction (both P values > 0.05). There were no effects of time or condition, nor was there a time-by-condition interaction on peak gamma frequency (all P values > 0.05). Bottom: the group-averaged whole brain map (pseudo t) depicting alpha ERD activity across both conditions and time windows is displayed centrally. Box-and-whisker plots of power (left, in % change from baseline) and peak frequency (right; in Hz) for each condition are shown. There were significant main effects of time and condition on alpha ERD, as well as a significant time-by-condition interaction, such that the alpha ERD became stronger (i.e., more negative from baseline) from Time 1 to Time 2 in the Move relative to the No-Move condition (P = 0.017). There was also a significant effect of time on alpha peak frequency, such that peak frequency significantly decreased from Time 1 to Time 2 across conditions (P = 0.001). There was no main effect of condition, nor was there a time-by-condition interaction on alpha peak frequency (both P values > 0.05). ERD, event-related desynchronization; ERS, event-related synchronization.
Figure 4.
Figure 4.
Left: virtual sensor time series of the alpha ERD response, with % change from baseline on the y axis and time in seconds (s) on the x axis and each condition plotted separately (Red: Move, Blue: No-Move). The dotted white lines denote stimulus changes (i.e., stimulus onset, speed change, stimulus offset), whereas the gray line denotes the average reaction time. Differences in alpha ERD as a function of time and condition were compared from the speed change to the average reaction time in 0.1 s time windows using a 2 × 6 repeated-measures ANOVA. There was a main effect of time on the alpha ERD (P = 0.004), such that the response became stronger (more negative) with time. There was also a significant main effect of condition (P = 0.020), such that the alpha ERD was stronger in the Move condition relative to the No-Move condition. There was a trending time-by-condition interaction, where the difference in alpha ERD as a function of condition became larger with time (P = 0.086). Right: virtual sensor time series of gamma ERS power (in % change from baseline, y axis) as a function of time (in s; x axis) for each condition (Red: Move, Blue: No-Move). The dotted white lines denote changes in the stimulus (i.e., stimulus onset, speed change, stimulus offset), whereas the gray line denotes the average reaction time. There were no significant conditional differences in gamma ERS power, so this data were not subjected to follow-up analyses. ERD, event-related desynchronization; ERS, event-related synchronization.

Similar articles

Cited by

References

    1. Adjamian P, Holliday IE, Barnes GR, Hillebrand A, Hadjipapas A, Singh KD. Induced visual illusions and gamma oscillations in human primary visual cortex. Eur J Neurosci 20: 587–592, 2004. doi:10.1111/j.1460-9568.2004.03495.x. - DOI - PubMed
    1. Gray CM, König P, Engel AK, Singer W. Oscillatory responses in cat visual cortex exhibit inter-columnar synchronization which reflects global stimulus properties. Nature 338: 334–337, 1989. doi:10.1038/338334a0. - DOI - PubMed
    1. Kreiter A, Singer W. Stimulus-dependent synchronization of neuronal responses in the visual cortex of the awake macaque monkey. J Neurosci 16: 2381–2396, 1996. doi:10.1523/JNEUROSCI.16-07-02381.1996. - DOI - PMC - PubMed
    1. Keil A, Müller MM, Ray WJ, Gruber T, Elbert T. Human gamma band activity and perception of a gestalt. J Neurosci 19: 7152–7161, 1999. doi:10.1523/JNEUROSCI.19-16-07152.1999. - DOI - PMC - PubMed
    1. Fries P, Reynolds JH, Rorie AE, Desimone R. Modulation of oscillatory neuronal synchronization by selective visual attention. Science 291: 1560–1563, 2001. doi:10.1126/science.1055465. - DOI - PubMed

Publication types

LinkOut - more resources