. 2022 Mar 9;20(1):64.
doi: 10.1186/s12915-022-01251-0.

BET proteins are essential for the specification and maintenance of the epiblast lineage in mouse preimplantation embryos

Affiliations

BET proteins are essential for the specification and maintenance of the epiblast lineage in mouse preimplantation embryos

Mami Tsume-Kajioka et al. BMC Biol. .

Abstract

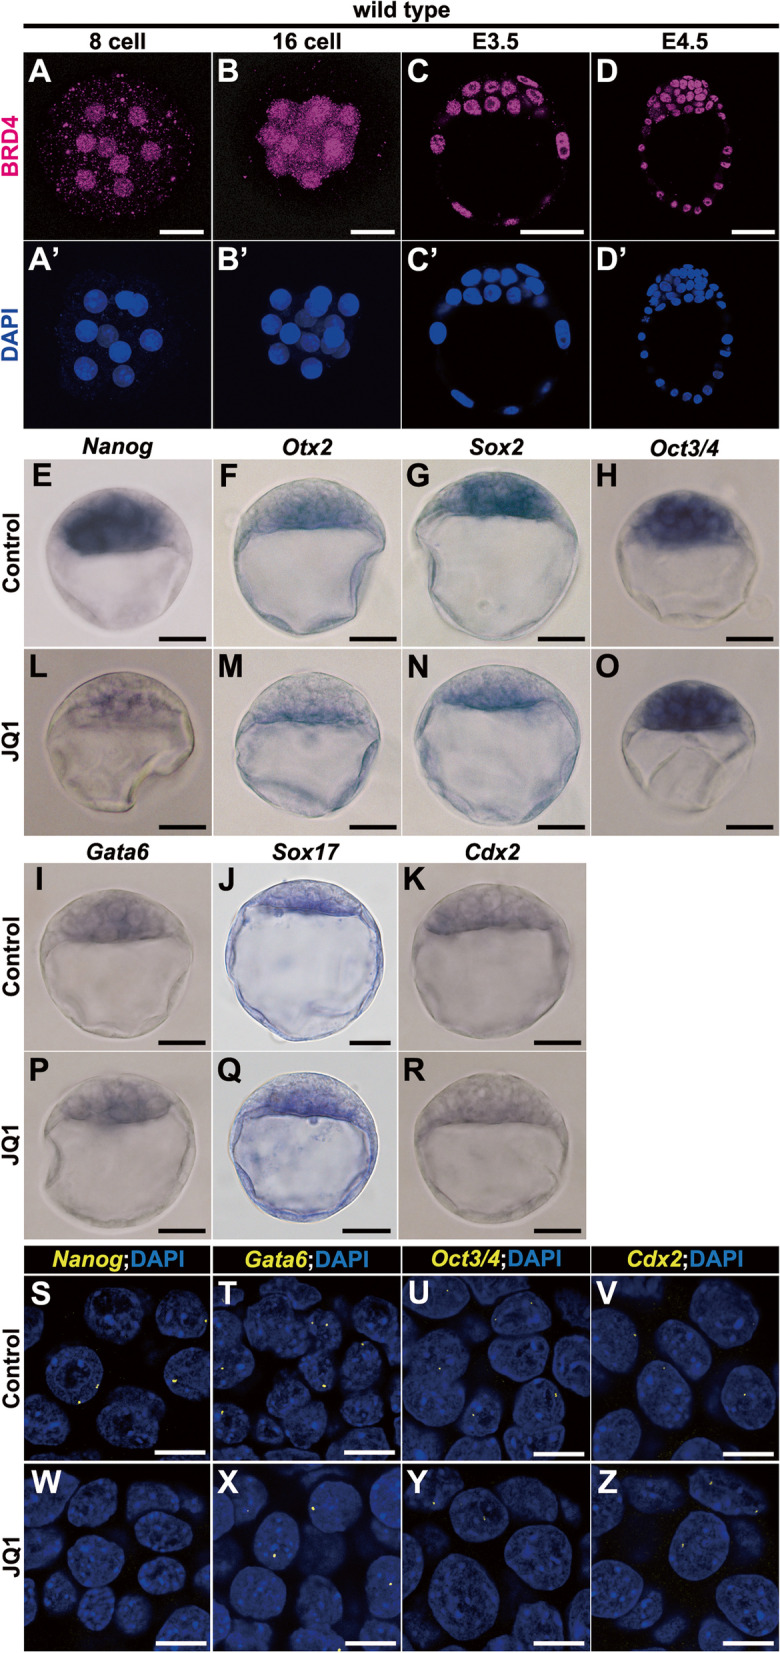
Background: During mammalian preimplantation development, as the fertilized egg develops and differentiates, three cell lineages become specified: trophectoderm (TE), epiblast, and primitive endoderm (PrE). Through two steps of cell fate decisions, 16-cell blastomeres develop into TE and an inner cell mass (ICM), and thereafter, the latter differentiates into pluripotent epiblast and PrE. Although bromodomain and extra-terminal domain (BET) proteins, such as BRD4, are necessary for the transcriptional activation of genes involved in the maintenance of mouse embryonic stem cells by occupying their enhancers, their roles in the development of mouse preimplantation are unknown.

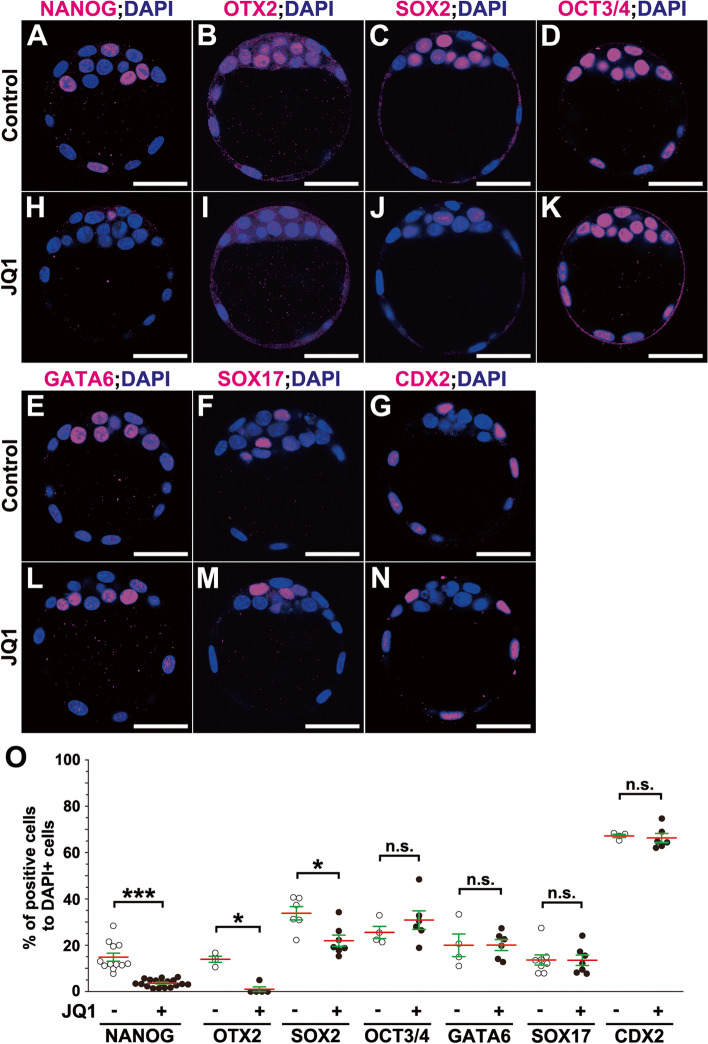
Results: To evaluate the effect of BET protein deficiency on cell lineage formation, we cultured preimplantation embryos in the presence of JQ1, which blocks the binding of BET bromodomains to acetylated-histones. We found BET inhibition blocked the transcriptional activation of genes, such as Nanog, Otx2, and Sox2, important for the formation of the epiblast lineage in blastocysts. Expression studies with lineage-specific markers in morulae and blastocysts revealed BET proteins were essential for the specification and maintenance of the epiblast lineage but were dispensable for the formation of primarily extraembryonic TE and PrE lineages. Additional Ingenuity Pathway Analysis and expression studies with a transcriptionally active form of signal transducer and activator of the transcription 3 (STAT3) suggested BET-dependent activation was partly associated with the STAT3-dependent pathway to maintain the epiblast lineage. To identify BET proteins involved in the formation of the epiblast lineage, we analyzed mutant embryos deficient in Brd4, Brd2, and double mutants. Abolishment of NANOG-positive epiblast cells was only evident in Brd4/Brd2 double-deficient morulae. Thus, the phenotype of JQ1-treated embryos is reproduced not by a Brd4- or Brd2-single deficiency, but only Brd4/Brd2-double deficiency, demonstrating the redundant roles of BRD2 and BRD4 in the specification of the epiblast lineage.

Conclusions: BET proteins are essential to the specification and maintenance of the epiblast lineage by activating lineage-specific core transcription factors during mouse preimplantation development. Among BET proteins, BRD4 plays a central role and BRD2 a complementary role in the specification and maintenance of epiblast lineages. Additionally, BET-dependent maintenance of the epiblast lineage may be partly associated with the STAT3-dependent pathway.

Keywords: BET; Blastocyst; Brd2; Brd4; Bromodomain; Epiblast; Inner cell mass; JQ1; Mouse; Nanog.


Conflict of interest statement

The authors declare that they have no competing interests.

Figures

Fig. 1
Fig. 1
Downregulation of mRNA transcription of epiblast markers in mouse E3.5 blastocysts by JQ1 treatment. AD, A'D' Immunohistochemical analysis of BRD4 protein (magenta (AD)) and DAPI (nuclei, blue (A’D’)) staining, in the wild type at 8-cell (A, A’), 16-cell (B, B’), E3.5 (C, C’), and E4.5 (D, D’) embryos. ER Whole-mount in situ hybridization of mouse blastocysts (stage 3) treated without JQ1 (control) (EK) or with 5 μM JQ1 (LR) for 3 h. Expression of Nanog (E, L), Otx2 (F, M), Sox2 (G, N), Oct3/4 (H, O), Gata6 (I, P), Sox17 (J, Q), or Cdx2 (K, R) mRNAs. S–Z RNA-fluorescence in situ hybridization (FISH) of E3.5 blastocysts treated without JQ1 (control; SV) or with 5 μM JQ1 (WZ) for 1 h. Nanog-specific probe (S, W), Gata6-specific probe (T, X), Oct3/4-specific probe (U, Y), or Cdx2-specific probe (V, Z) (yellow), with DAPI (nuclei, blue) staining. Nanog nascent mRNA precursors are absent in the nuclei following treatment with JQ1 (W). The sample numbers analyzed for each experiment are indicated in Additional file 19. Scale bars, 10 μm in SZ; 25 μm in A, B, A’, B’, and ER; 40 μm in C and C’; and 50 μm in D, D’
Fig. 2
Fig. 2
Downregulation of epiblast-lineage markers in mouse blastocysts by JQ1 treatment (stages 3 to 4). A–N Immunohistochemical analysis of mouse blastocysts (stage 3) treated without JQ1 (control) (AG) or with 5 μM JQ1 (HN) for 6 h. NANOG (A, H), OTX2 (B, I), SOX2 (C, J), OCT3/4 (D, K), GATA6 (E, L), SOX17 (F, M), or CDX2 (G, N) (magenta), with DAPI (nuclei, blue) staining. O The ratio of numbers of NANOG-, OTX2-, SOX2-, OCT3/4-, GATA6-, SOX17-, or CDX2-expressing cells to DAPI-positive cells (nuclei) (two-tailed Mann-Whitney’s U-test; ***p < 0.001, *p < 0.05; n.s., not significant; OCT3/4, p = 0.476; GATA6, p = 0.914; SOX17, p = 0.954; CDX2, p = 0.476). Red lines indicate the mean values, and green lines represent the SE bars. Individual values of marker-expressing cells are provided in Additional file 15. The sample numbers analyzed for each experiment are indicated in Additional file 19. Scale bars, 40 μm in AN
Fig. 3
Fig. 3
Downregulation of epiblast-lineage markers in mouse morulae by JQ1 treatment (stage 2). A–R Immunohistochemical analysis of mouse 16-cell morulae before treatment (AF), treated without JQ1 (control) (GL) or with 5 μM JQ1 (MR) for 6 h. NANOG (A, G, M), OTX2 (B, H, N), SOX2 (C, I, O), OCT3/4 (D, J, P), GATA6 (E, K, Q), or CDX2 (F, L, R) (magenta), with DAPI (nuclei, blue) staining. The bottom left numerical character of each panel denotes the number of DAPI-positive cells in the embryos shown. S The ratio of numbers of NANOG-, OTX2-, SOX2-, OCT3/4-, GATA6-, or CDX2-expressing cells to DAPI-positive cells (nuclei) (two-tailed Mann-Whitney’s U-test; *p < 0.05; n.s., not significant; OCT3/4, p = 0.660; GATA6, p = 1.000; CDX2, p = 0.556). Red lines indicate the mean values, and green lines represent the standard error (SE) bars. The numbers of marker-expressing cells are shown in Additional file 15. The sample numbers analyzed for each experiment are shown in Additional file 19. Scale bars: 25 μm in AR
Fig. 4
Fig. 4
NANOG- and GATA6-double-negative cells are emerged from JQ1-treated blastocysts and appear to re-induce NANOG-positive cells reversibly (stages 3 to 4). A–D, B’, B”, B”’, D’, D”, D”’ NANOG- and GATA6-doube-negative cells emerged after JQ1 treatment (yellow arrows). Immunohistochemical analysis of NANOG (magenta) and GATA6 (green), with DAPI (nuclei, blue) staining in control (A, B, B’, B”, B”’) and 5 μM JQ1-treated blastocysts (C, D, D’, D”, D”’) for 6 h at E3.5. E Schematic illustration of the experimental strategy, with or without JQ1, for an additional 24-h culture. FK, G’, G”, G”’, I’, I”, I”’, K’, K”, K”’ NANOG- and GATA6-double-negative cells are re-specified into NANOG-positive cells after JQ1 removal. Immunohistochemical analysis of NANOG (magenta) and GATA6 (green), with DAPI (blue) staining, in mouse blastocysts at E3.5 treated without JQ1 for 30 h (F, G, G’, G”, G”’), with 5 μM JQ1 for 30 h (H, I, I’, I”, I”’), and with 5 μM JQ1 for 6 h and without JQ1 for 24 h (J, K, K’, K”, K”’). The sample numbers analyzed for each experiment are indicated in Additional file 19. Scale bars, 20 μm in B, B’, B”, B”’, D, D’, D”, D”’, G, G’, G”, G”’, I, I’, I”, I”’, K, K’, K”, K”’; 40 μm in A, C, F, H, and J. DMSO, dimethyl sulfoxide
Fig. 5
Fig. 5
Downregulation of epiblast-lineage markers by JQ1 treatment associated with STAT3 inhibition (stages 3 to 4). A Representation of the top ten canonical pathways by Ingenuity Pathway Analysis (IPA). B, C, C’, C” Immunohistochemical analysis of NANOG (magenta) and pSTAT3 (green), with DAPI (blue) staining, in mouse blastocysts at E3.5. NANOG-positive cells that express pSTAT3 (yellow arrows) but do not express (asterisks) in the nuclei. D The ratio of pSTAT3-expressing and non-expressing cells to all NANOG-positive cells. White lines represent the SE bars. n indicates the number of blastocysts analyzed. ET Whole-mount in situ hybridization of mouse blastocysts treated without Stattic (EH, MP) or with 5 μM Stattic (IL) for 3 h or 1 μM Stattic (QT) for 6 h (stages 3 to 4). Expression of Nanog (E, I, M, Q), Sox2 (F, J, N, R), Gata6 (G, K, O, S), or Cdx2 (H, L, P, T) mRNAs. UX, V’, V”, V”’, X’, X”, X”’ Immunohistochemical analysis of NANOG (magenta) and GATA6 (green), with DAPI (nuclei, blue) staining of mouse blastocysts treated without Stattic (U, V, V’, V”, V”’) or with 1 μM Stattic (W, X, X’, X”, X”’) for 6 h (stages 3 to 4). Y The ratios of the numbers of NANOG- or GATA6-expressing cells to DAPI-positive total cells (nuclei) treated without Stattic or with 1 μM Stattic for 6 h of E3.5 blastocysts (two-tailed Mann-Whitney’s U-test; *p < 0.05; n.s., not significant; p = 0.748). Red lines indicate the mean values, and green lines represent the SE bars. Individual values of marker-expressing cells are provided in Additional file 15. The sample numbers analyzed for each experiment are indicated in Additional file 19. Scale bars, 20 μm in C, C’, C”, V, V’, V”, V”’, X, X’, X”, X”’; 25 μm in ET; 40 μm in B, U, W
Fig. 6
Fig. 6
The epiblast lineage can be specified in Brd4-deficient blastocysts (stage 3). A, A’ Immunohistochemical analysis of BRD4 protein (magenta; A), and DAPI (nuclei, blue; A’) staining, in the Brd4lacZ/lacZ embryos at E3.5. The expression of BRD4 protein is undetectable in a Brd4lacZ/lacZ embryo. B, C Immunohistochemical analysis of NANOG (magenta), with DAPI (blue) staining, in wild type (WT) (B) or Brd4lacZ/lacZ E3.5 blastocysts (C). NANOG expression was not reduced in a Brd4lacZ/lacZ blastocyst. D The ratio of numbers of NANOG-expressing cells to DAPI-positive cells (nuclei) in WT and Brd4lacZ/lacZ E3.5 blastocysts (two-tailed Mann-Whitney’s U-test; n.s., not significant; p = 0.571). Red lines indicate the mean values, and green lines represent the SE bars. EN Whole-mount in situ hybridization analysis in WT (EI) and Brd4lacZ/lacZ E3.5 blastocysts (JN). The expression of Nanog (E, J), Sox2 (F, K), Gata6 (G, L), Oct3/4 (H, M), or Cdx2 (I, N) mRNAs. Individual values of marker-expressing cells are provided in Additional file 15. The sample numbers analyzed for each experiment are indicated in Additional file 19. Scale bars, 25 μm in EN; 40 μm in AC, A’
Fig. 7
Fig. 7
NANOG expression is diminished in Brd2tg/tg; Brd4 knockout morulae (stage 2). A Schematic illustration of the strategy for the generation of Brd2+/+; Brd4-, Brd2tg/+; Brd4-, and Brd2tg/tg; Brd4-knockout embryos with a CRISPR-Cas9 system. BE, B’, B”, B”’, C’, C”, D’, D”, E’, E” Immunohistochemical analysis of BRD4 (B, B’, CE; yellow), NANOG (B”, C’, D’, E’; magenta), and GATA6 protein (B”’, C”, D”, E”; green), with DAPI (nuclei, blue) staining, in Brd2+/+ (C, C’, C”), Brd2tg/+ (D, D’, D”), and Brd2tg/tg (B, B’, B”, B”’, E, E’, E”) late morulae at 16- to 31-cell stages treated with (CE, C’, C”, D’, D”, E’, E”) or without (B, B’, B”, B”’) electroporation of CAS9 protein and Brd4 single guide (sg)RNAs. BRD4, NANOG, and GATA6 expression were normally found in Brd2tg/tg late morulae (B, B’, B”, B“’). The remaining NANOG-positive cell still expresses GATA6 (yellow arrows, E’, E”). F The ratio of numbers of NANOG- and GATA6-expressing cells to DAPI-positive cells (nuclei) in late morulae (Kruskal-Wallis test for two markers followed by Steel’s test for NANOG expression; NANOG in Brd2+/+ vs. Brd2tg/+, p = 0.092; GATA6 in Brd2+/+ vs. Brd2tg/+vs. Brd2tg/tg, p = 0.232; *p < 0.05; n.s., not significant). Red lines indicate the mean values, and green lines represent the SE bars. Individual values of marker-expressing cells are provided in Additional file 15. The sample numbers analyzed for each experiment are indicated in Additional file 19. Scale bars, 25 μm in BE, B’, B”, B”’, C’, C”, D’, D”, E’, E”. IVF, in vitro fertilization; WT, wild type; KO, knockout

Similar articles

Cited by

References

    1. Rossant J. Genetic control of early cell lineages in the mammalian embryo. Annu Rev Genet. 2018;52:185–201. doi: 10.1146/annurev-genet-120116-024544. - DOI - PubMed
    1. Schrode N, Xenopoulos P, Piliszek A, Frankenberg S, Plusa B, Hadjantonakis AK. Anatomy of a blastocyst: cell behaviors driving cell fate choice and morphogenesis in the early mouse embryo. Genesis. 2013;51(4):219–233. doi: 10.1002/dvg.22368. - DOI - PMC - PubMed
    1. Frum T, Ralston A. Cell signaling and transcription factors regulating cell fate during formation of the mouse blastocyst. Trends Genet. 2015;31(7):402–410. doi: 10.1016/j.tig.2015.04.002. - DOI - PMC - PubMed
    1. Chazaud C, Yamanaka Y. Lineage specification in the mouse preimplantation embryo. Development. 2016;143(7):1063–1074. doi: 10.1242/dev.128314. - DOI - PubMed
    1. Nichols J, Zevnik B, Anastassiadis K, Niwa H, Klewe-Nebenius D, Chambers I, et al. Formation of pluripotent stem cells in the mammalian embryo depends on the POU transcription factor Oct4. Cell. 1998;95(3):379–391. doi: 10.1016/S0092-8674(00)81769-9. - DOI - PubMed

Publication types