. 2022 Mar 9;20(1):125.
doi: 10.1186/s12951-022-01318-8.

Ceria-Zirconia nanoparticles reduce intracellular globotriaosylceramide accumulation and attenuate kidney injury by enhancing the autophagy flux in cellular and animal models of Fabry disease

Affiliations

Ceria-Zirconia nanoparticles reduce intracellular globotriaosylceramide accumulation and attenuate kidney injury by enhancing the autophagy flux in cellular and animal models of Fabry disease

Jong Hun An et al. J Nanobiotechnology. .

Abstract

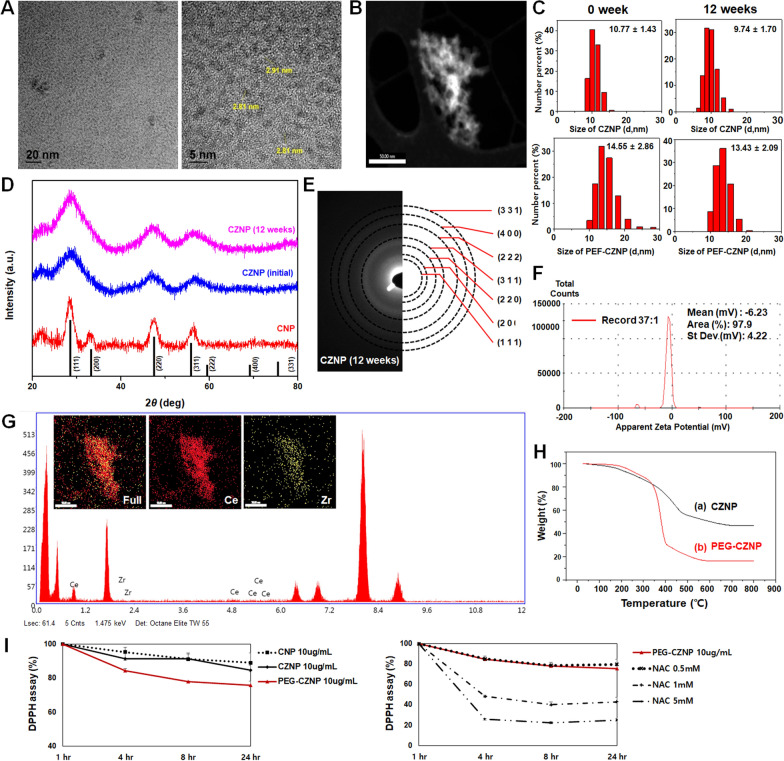
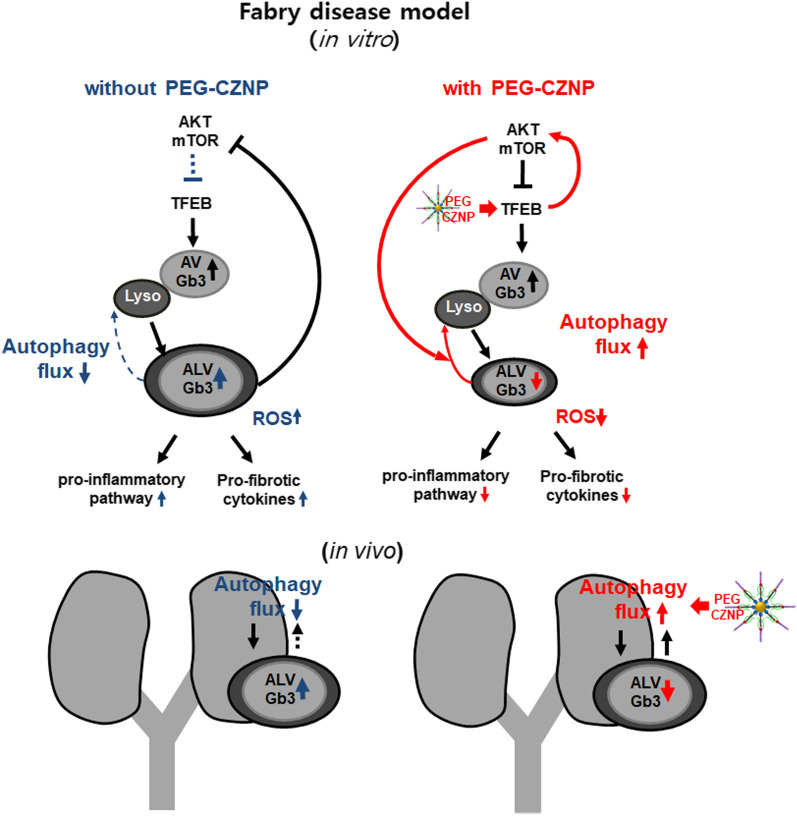
Background: Fabry disease (FD) is a lysosome storage disease (LSD) characterized by significantly reduced intracellular autophagy function. This contributes to the progression of intracellular pathologic signaling and can lead to organ injury. Phospholipid-polyethyleneglycol-capped Ceria-Zirconia antioxidant nanoparticles (PEG-CZNPs) have been reported to enhance autophagy flux. We analyzed whether they suppress globotriaosylceramide (Gb3) accumulation by enhancing autophagy flux and thereby attenuate kidney injury in both cellular and animal models of FD.

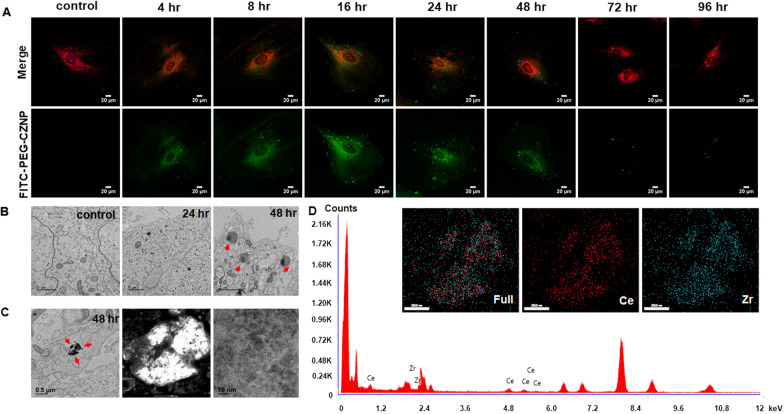
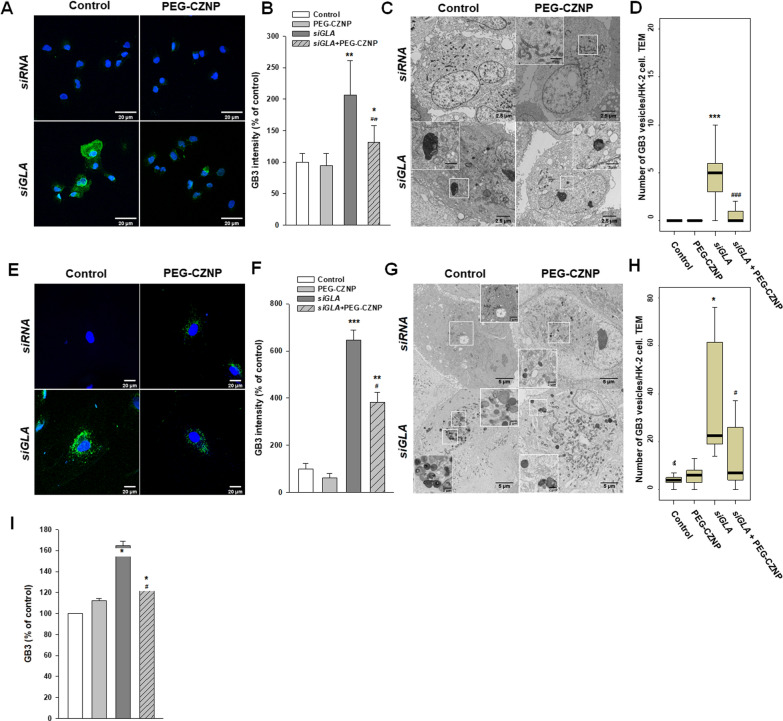
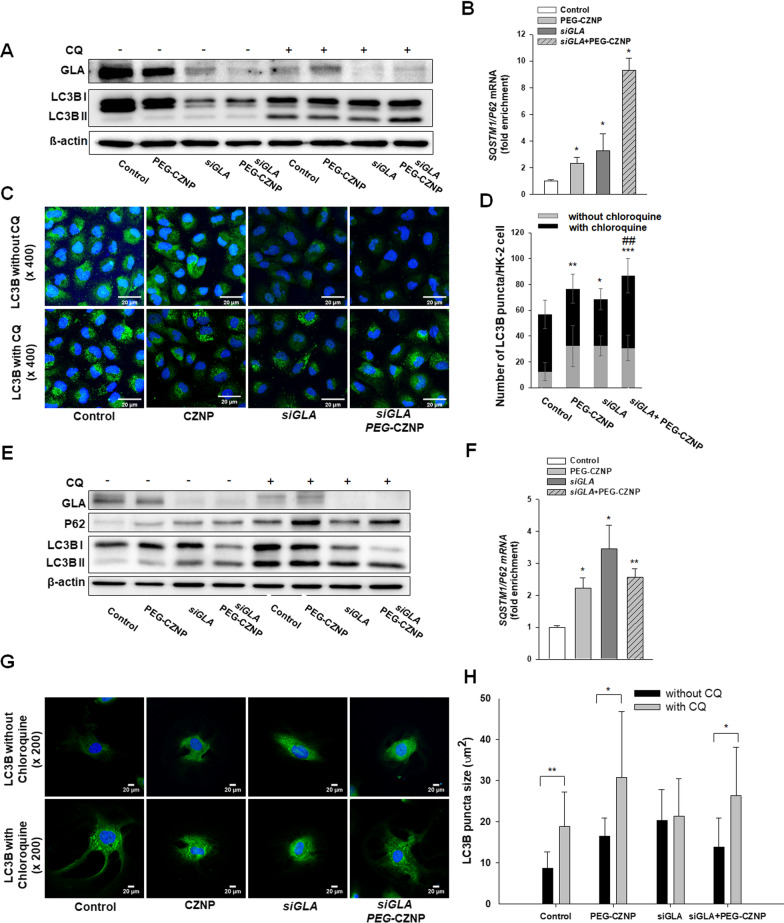
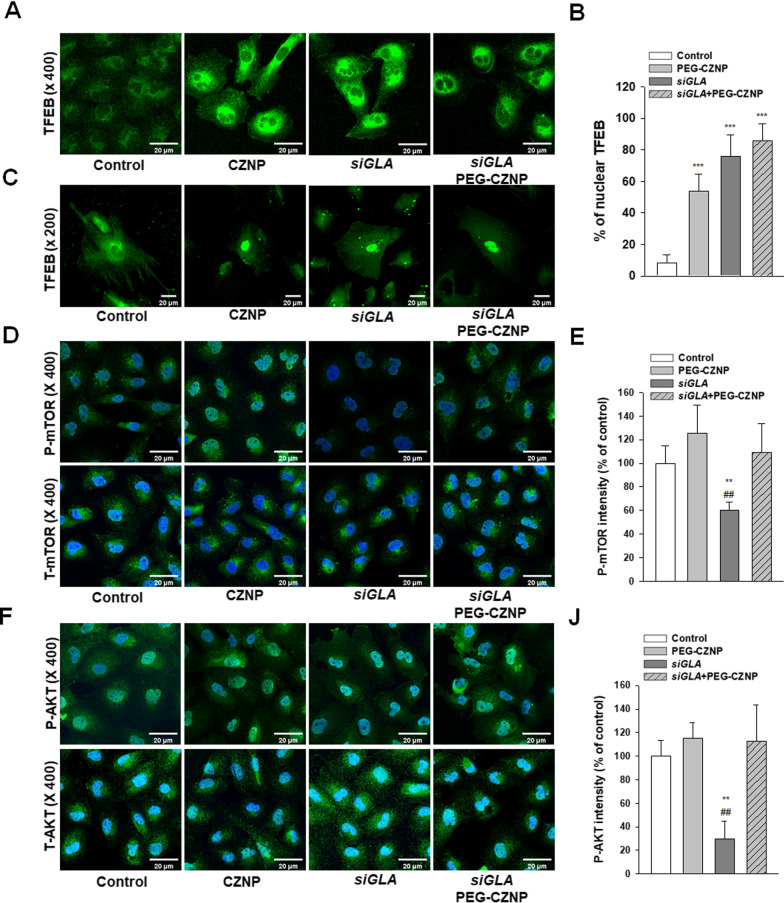
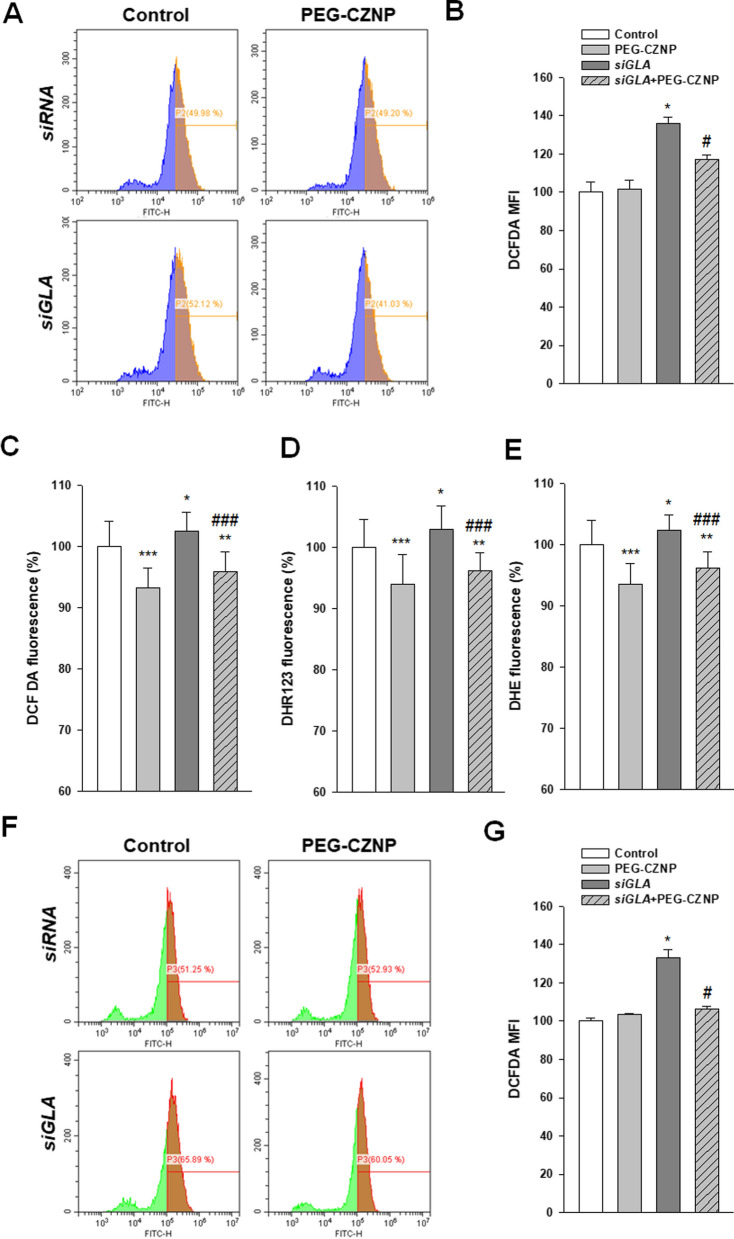
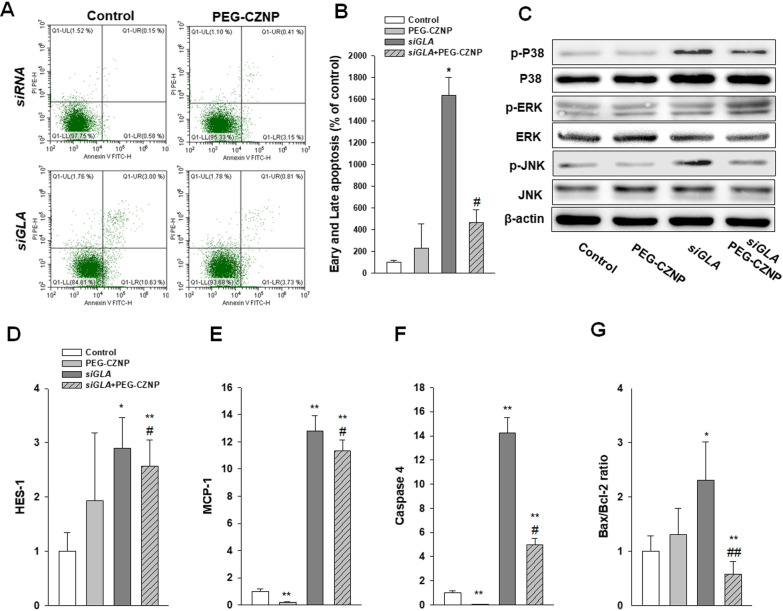
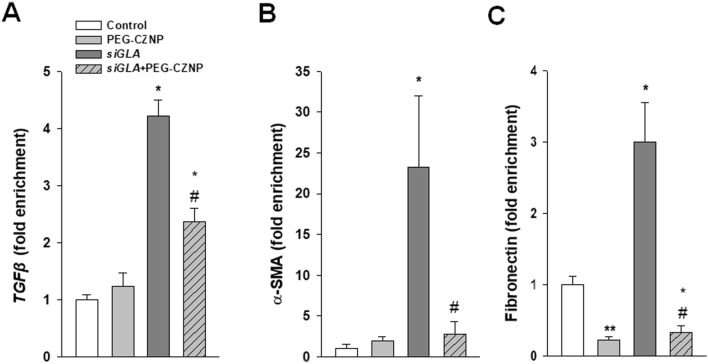
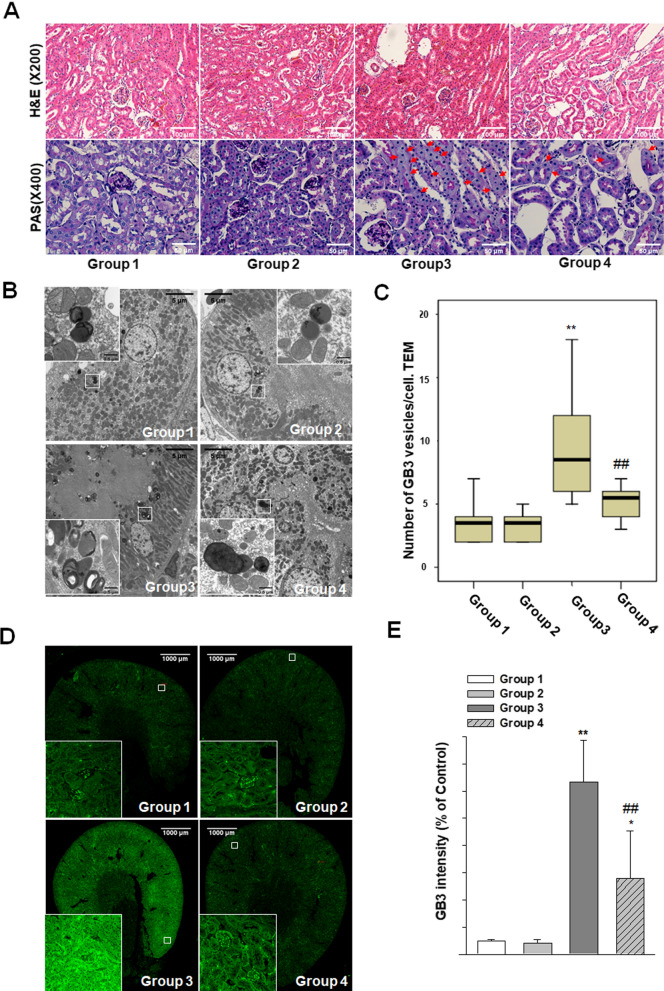
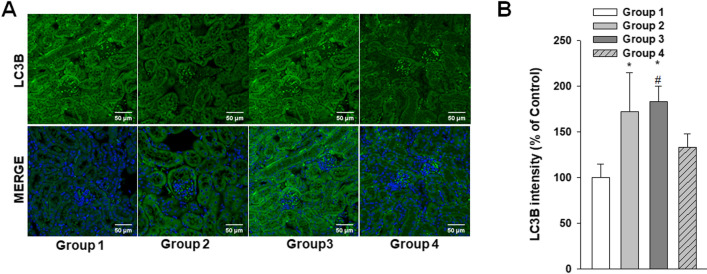
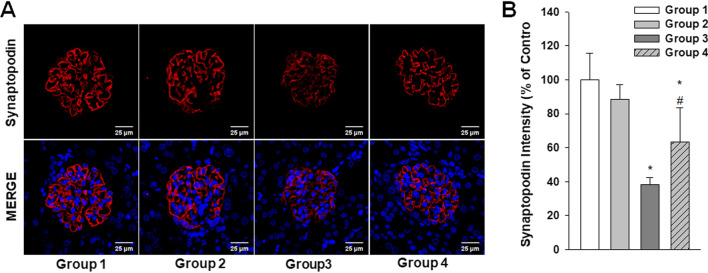
Results: Gb3 was significantly increased in cultured human renal proximal tubular epithelial cells (HK-2) and human podocytes following the siRNA silencing of α galactosidase A (α-GLA). PEG-CZNPs effectively reduced the intracellular accumulation of Gb3 in both cell models of FD and improved both intracellular inflammation and apoptosis in the HK-2 cell model of FD. Moreover these particles attenuated pro fibrotic cytokines in the human podocyte model of FD. This effect was revealed through an improvement of the intracellular autophagy flux function and a reduction in reactive oxygen species (ROS). An FD animal model was generated in which 4-week-old male B6;129-Glatm1Kul/J mice were treated for 8 weeks with 10 mg/kg of PEG-CZNPs (twice weekly via intraperitoneal injection). Gb3 levels were reduced in the kidney tissues of these animals, and their podocyte characteristics and autophagy flux functions were preserved.

Conclusions: PEG-CZNPs alleviate FD associated kidney injury by enhancing autophagy function and thus provide a foundation for the development of new drugs to treat of storage disease.

Keywords: Autophagy flux; Ceria-Zirconia nanoparticle; Fabry disease; Globotriaosylceramide.


Conflict of interest statement

The authors do not have any possible conflict of interests.

Figures

Fig. 1
Fig. 1
Characteristics of the PEG-CZNPs. A, B High-resolution transmission electron microscopy images (TEM) and low-magnification scanning transmission electron microscopy (STEM) images revealing the highly crystalline nature of the PEG-CZNPs. C Particle size distribution of CZNPs and PEG-CZNPs in deionized water, measured by dynamic light scattering (DLS). D Comparison of the X-ray diffraction (XRD) spectra for CNPs, and CZNPs at 0 and 12 weeks. The black lines represent the ceria reference peaks. E Corresponding selected area electron diffraction (SAED) patterns of CZNPs at 12 weeks. F Zeta potential curve obtained from PEG-CZNPs (Zeta potential, mV; -7.33). G Use of energy dispersive X-ray spectroscopy (EDS) spectra of the CZNPs to confirm their atomic compositions; 67 at% Ce and 33 at% Zr. H Thermogravimetric analysis (TGA) curves of CZNPs and PEG-CZNPs. I Antioxidant effects of the PEG-CZNPs assayed using 2,2-diphenyl-a-picrylhydrazyl (DPPH) at a concentration of 10 μg/mL over 4, 8, and 24 h. Data were analyzed with the Student’s t test (mean ± SD)
Fig. 2
Fig. 2
Intracellular localization and biodistribution of the PEG-CZNPs. A Confocal microscopy analysis of human podocyte treated with FITC-labeled PEG-CZNPs after 0, 4, 8, 16, 24, 48, 72 and 96 h. The human podocytes were then double-stained with Mitotracker (orange) and Lysotracker (blue). B TEM images of human podocytes treated with PEG-CZNPs after 0, 24, and 48 h. Residual PEG-CZNPs were found to be distributed in the lysosomes (red arrow). C STEM images of PEG-CZNPs in the lysosome of human podocytes D EDS spectra of PEG-CZNPs in the lysosomes of human podocytes to confirm their atomic compositions; 67 at% Ce and 32 at% Zr
Fig. 3
Fig. 3
Gb3 detection in α-GLA knockdown HK-2 cells and human podocytes at baseline and under PEG-CZNPs treatment. A–D HK-2 cell analysis A Representative confocal immunofluorescence microscopy images of Gb3 (green), with DAPI counterstaining (blue), in control (siRNA) and α-GLA deficient HK-2 cells (siGLA), with or without exposure to PEG-CZNPs. B Quantification of the fluorescence intensities in the confocal microscope images using ImageJ software. C Representative TEM images of control (siRNA) and α-GLA deficient HK-2 cells (siGLA), with or without exposure to PEG-CZNPs. D Quantitative analysis of Gb3 vesicles in control (siRNA) and α-GLA deficient HK-2 cells (siGLA), with or without exposure to PEG-CZNPs. E–I Human podocyte analysis E Representative confocal immunofluorescence microscopy images of Gb3 (green), with DAPI counterstaining (blue), in control (siRNA) and α-GLA deficient human podocytes (siGLA) with or without exposure to PEG-CZNPs. F Quantification of the fluorescence intensity of confocal microscope images using ImageJ software. G Representative TEM images of control (siRNA) and α-GLA deficient human podocytes (siGLA) with or without exposure to PEG-CZNPs. H Quantitative analysis of Gb3 vesicles from TEM images. I Quantification of the total Gb3 content using by LC–MS/MS data and the Student’s t test. Data shown are the mean ± SD; *P < 0.05, **P < 0.01, and ***P < 0.001 versus control; #P < 0.05, ##P < 0.01, and ###P < 0.001 versus siGLA knockdown alone
Fig. 4
Fig. 4
Effects of PEG-CZNPs on the autophagy response in HK-2 cells and in the human podocyte model of FD. A-D HK-2 cell analysis A Immunoblotting analysis of the autophagy response with and without chloroquine (CQ). B Quantitative real-time RT-PCR analysis of SQSTM1/P62 expression. C and D Confocal microscopy images of cells stained with LC3, with or without CQ exposure, and quantification of the fluorescence intensities using ImageJ software. E–H Human podocyte analysis E Immunoblotting analysis of the autophagy response with and without CQ exposure. F Quantitative real-time RT-PCR analysis of SQSTM1/P62 expression. G and H Confocal microscopy images of cells stained with LC3, with or without CQ exposure, and quantification of the fluorescence intensities using ImageJ software. Data values represent the mean ± SD; *P < 0.05, **P < 0.01, and ***P < 0.001 versus control; ###P < 0.001 versus siGLA knockdown alone
Fig. 5
Fig. 5
Effects of PEG-CZNPs on the TFEB and AKT/mTOR signaling pathways A, B Confocal microscopy images of HK-2 cells transfected with pEGFP-TFEB and quantification of the nuclear TFEB percentages. C Confocal microscopy images of human podocytes transfected with pEGFP-TFEB D–J HK-2 cell analysis D, E Confocal microscopy image of cells stained with P-mTOR and T-mTOR and quantification of the fluorescence intensities using ImageJ software. F Confocal microscopy images of cells stained with P-AKT and T-AKT and quantification of the fluorescence intensities using ImageJ software. Data values represent the mean ± SD; **P < 0.01 and ***P < 0.001 versus control; ##P < 0.01 versus siGLA knockdown alone
Fig. 6
Fig. 6
Effects of PEG-CZNPs on ROS production A-E HK-2 cell model of FD at day 8 A, B DCF-DA analysis in HK-2 cells using a FACS assay. C-E Intracellular ROS level measurements using DCF-DA, DHR and DHE with or without PEG-CZNP exposure. F, G DCF-DA analysis in human podocytes using a FACS assay. Data values represent the mean ± SD; *P < 0.05, *P < 0.01 and ***P < 0.001 versus control; #P < 0.01 and ###P < 0.001 versus siGLA knockdown alone
Fig. 7
Fig. 7
Beneficial effects of PEG-CZNPs on cellular survival and apoptosis in HK-2 cell model of FD. A, B Analysis of apoptosis in HK-2 cells using a FACS assay C Immunoblotting of MAPK dependent intracellular signaling. D-F Quantitative real-time RT-PCR analysis of HES-1, MCP-1, caspase 4, Bax and Bcl-2 gene expression. Data values represent the mean ± SD; *P < 0.05, and **P < 0.01, versus control; #P < 0.05, and ##P < 0.01 versus siGLA knockdown alone
Fig. 8
Fig. 8
Effects of PEG-CZNPs on fibrosis markers in the human podocyte model of FD. A–C Quantitative real-time RT-PCR analysis of TGFß, α-SMA and fibronectin expression. Data values represent the mean ± SD; *P < 0.05, and **P < 0.01, versus control; #P < 0.05, and ##P < 0.01 versus siGLA knockdown alone
Fig. 9
Fig. 9
Renal histopathology analysis in a B6;129-Glatm1Kul/J mouse model of FD, with or without PEG-CZNP exposure. A Representative photomicrographs are shown of H&E and PAS stained sections from kidney tissues isolated from the mice at 12 weeks of age, with or without PEG-CZNP pretreatment. Enlargement of the tubular cells was alleviated in the B6;129-Glatm1Kul/J mice upon PEG-CZNP exposure (red arrow). B, C Representative TEM images and quantification of the number of Gb3 vesicles. D, E Confocal micrographs of Gb3-stained kidney sections and quantification of the Gb3 signal intensity using ImageJ software. Group1; wild type, normal saline injection, Group 2; wild type + PEG-CZNP injection, Group 3; B6;129-Glatm1Kul/J mice + normal saline injection and Group 4; B6;129-Glatm1Kul/J mice + PEG-CZNP injection. Data values represent the mean ± SD; **P < 0.01 versus Group1; ##P < 0.01 versus Group 3 alone
Fig. 10
Fig. 10
Effects of PEG-CZNPs on the autophagy response in B6;129-Glatm1Kul/J mouse model of FD. A Representative confocal immunofluorescence microscopy images of LC3b (green), with DAPI counterstaining (blue), in control and α-GLA deficient B6;129-Glatm1Kul/J mice with or without PEG-CZNP exposure. B Quantification of LC3B intensity using ImageJ software. Group1; wild type, normal saline injection, Group 2; wild type + PEG-CZNP injection, Group 3; B6;129-Glatm1Kul/J mice + normal saline injection and Group 4; B6;129-Glatm1Kul/J mice + PEG-CZNP injection. Data values represent the mean ± SD; *P < 0.05 versus Group 1; #P < 0.05 versus Group 3 alone
Fig. 11
Fig. 11
Effects of PEG-CZNPs on podocyte injury in the B6;129-Glatm1Kul/J mouse model of FD. A Representative confocal immunofluorescence microscopy images of synaptopodin (red), with DAPI counterstaining (blue), in control and α-GLA deficient B6;129-Glatm1Kul/J mice with or without PEG-CZNP exposure. B Quantification of the synaptopodin intensities using ImageJ software. Group1; wild type, normal saline injection, Group 2; wild type + PEG-CZNP injection, Group 3; B6;129-Glatm1Kul/J mice + normal saline injection and Group 4; B6;129-Glatm1Kul/J mice + PEG-CZNP injection. Data values represent the mean ± SD; *P < 0.05 versus Group 1; #P < 0.05 versus Group 3 alone
Fig. 12
Fig. 12
Schematic illustrations of the PEG-CZNP induced attenuation of kidney injury from FD. This occurs via the enhancement of the autophagy flux combined with the activation of TFEB, restoration of AKT/mTOR signaling, and antioxidant effects. PEG-CZNPs thereby alleviate inflammatory and fibrosis pathways and attenuate Gb3-mediated kidney injury

Similar articles

Cited by

References

    1. Ortiz A, Germain DP, Desnick RJ, Politei J, Mauer M, Burlina A, et al. Fabry disease revisited: management and treatment recommendations for adult patients. Mol Genet Metab. 2018;123(4):416–427. - PubMed
    1. Germain DP. Fabry disease. Orphanet J Rare Dis. 2010;5:30. - PMC - PubMed
    1. Hwu WL, Chien YH, Lee NC, Chiang SC, Dobrovolny R, Huang AC, et al. Newborn screening for Fabry disease in Taiwan reveals a high incidence of the later-onset GLA mutation c936+919G>A (IVS4+919G>A) Hum Mutat. 2009;30(10):1397–1405. - PMC - PubMed
    1. Waldek S, Patel MR, Banikazemi M, Lemay R, Lee P. Life expectancy and cause of death in males and females with Fabry disease: findings from the Fabry Registry. Genet Med. 2009;11(11):790–796. - PubMed
    1. Schiffmann R, Kopp JB, Austin HA, 3rd, Sabnis S, Moore DF, Weibel T, et al. Enzyme replacement therapy in Fabry disease: a randomized controlled trial. JAMA. 2001;285(21):2743–2749. - PubMed