. 2022 May 17;98(20):e1985-e1996.
doi: 10.1212/WNL.0000000000200257. Epub 2022 Mar 9.

Levels of Neurofilament Light at the Preataxic and Ataxic Stages of Spinocerebellar Ataxia Type 1

Affiliations

Levels of Neurofilament Light at the Preataxic and Ataxic Stages of Spinocerebellar Ataxia Type 1

Carlo Wilke et al. Neurology. .

Abstract

Background and objectives: Neurofilament light (NfL) appears to be a promising fluid biomarker in repeat-expansion spinocerebellar ataxias (SCAs), with piloting studies in mixed SCA cohorts suggesting that NfL might be increased at the ataxic stage of SCA type 1 (SCA1). We here hypothesized that NfL is increased not only at the ataxic stage of SCA1, but also at its (likely most treatment-relevant) preataxic stage.

Methods: We assessed serum NfL (sNfL) and CSF NfL (cNfL) levels in both preataxic and ataxic SCA1, leveraging a multicentric cohort recruited at 6 European university centers, and clinical follow-up data, including actually observed (rather than only predicted) conversion to the ataxic stage. Levels of sNfL and cNfL were assessed by single-molecule array and ELISA technique, respectively.

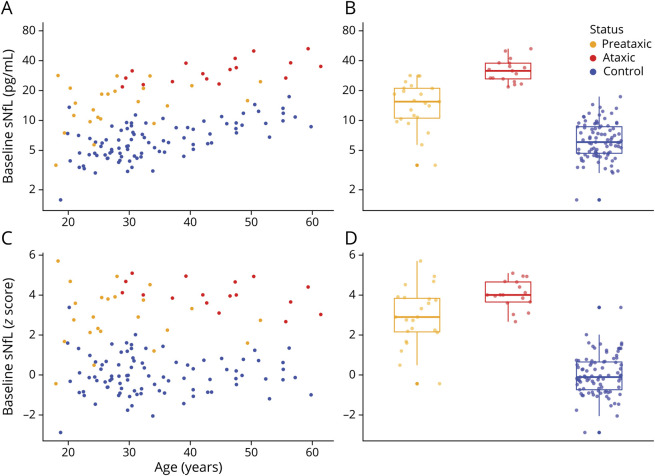
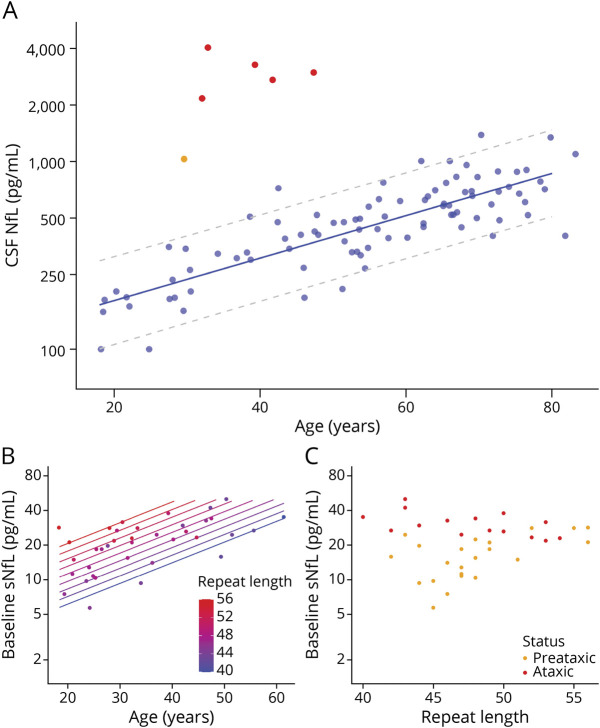
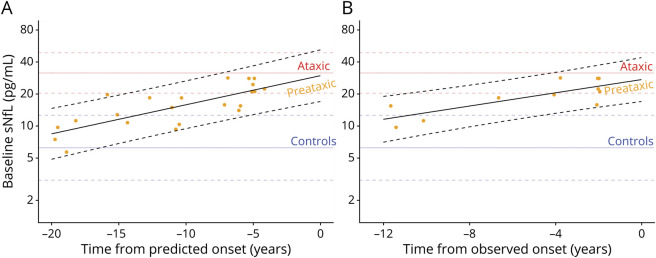
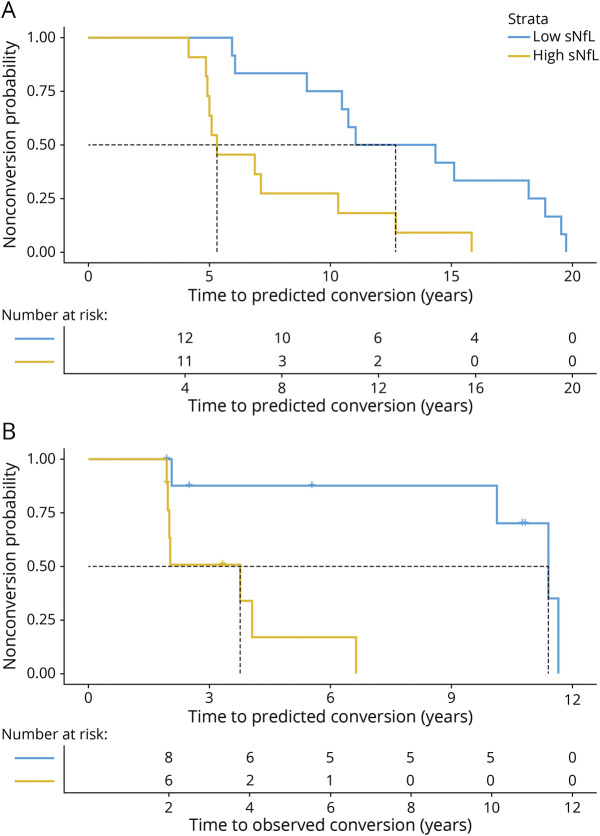
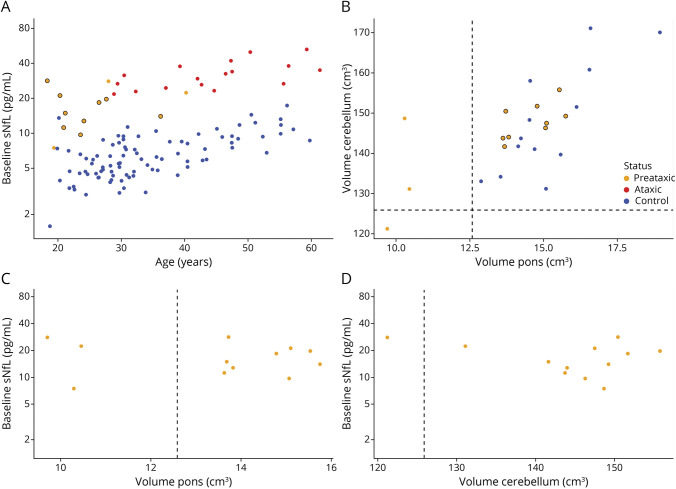
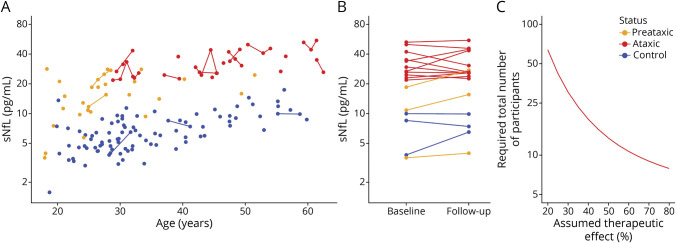
Results: Forty individuals with SCA1 (23 preataxic, 17 ataxic) and 89 controls were enrolled, including 11 preataxic individuals converting to the ataxic stage. sNfL levels were increased at the preataxic (median 15.5 pg/mL [interquartile range 10.5-21.1 pg/mL]) and ataxic stage (31.6 pg/mL [26.2-37.7 pg/mL]) compared to controls (6.0 pg/mL [4.7-8.6 pg/mL]), yielding high age-corrected effect sizes (preataxic: r = 0.62, ataxic: r = 0.63). sNfL increases were paralleled by increases of cNfL at both the preataxic and ataxic stage. In preataxic individuals, sNfL levels increased with proximity to predicted ataxia onset, with significant sNfL elevations already 5 years before onset, and confirmed in preataxic individuals with actually observed ataxia onset. sNfL increases were detected already in preataxic individuals with SCA1 without volumetric atrophy of cerebellum or pons, suggesting that sNfL might be more sensitive to early preataxic neurodegeneration than the currently known most change-sensitive regions in volumetric MRI. Using longitudinal sNfL measurements, we estimated sample sizes for clinical trials with the reduction of sNfL as the endpoint.

Discussion: sNfL levels might provide easily accessible peripheral biomarkers in both preataxic and ataxic SCA1, allowing stratification of preataxic individuals regarding proximity to onset, early detection of neurodegeneration even before volumetric MRI alterations, and potentially capture of treatment response in clinical trials.

Trial registration information: ClinicalTrials.gov Identifier: NCT01037777.

Classification of evidence: This study provides Class III evidence that NfL levels are increased in both ataxic and preataxic SCA1 and are associated with ataxia onset.


Figures

Figure 1
Figure 1. Baseline sNfL Levels at the Preataxic and Ataxic Stages of SCA1
(A) Serum levels of neurofilament light (sNfL) were measured in spinocerebellar ataxia type 1 (SCA1) mutation carriers at the preataxic (orange) and ataxic (red) disease stages and in mutation-negative controls (blue). (B) Boxes visualize median and lower and upper quartiles; whiskers extend to data within 1.5 interquartile range of the median. (C and D) To take into consideration the age-related increase of sNfL levels, the absolute levels were corrected for the age-related increase observed in controls by z transformation.
Figure 2
Figure 2. cNfL Levels at the Preataxic and Ataxic Stages of SCA1 and Association of sNfL Levels With Age and CAG Repeat Count
(A) Neurofilament light (NfL) levels in the CSF (cNfL) were increased in preataxic (orange) and ataxic spinocerebellar ataxia type 1 (SCA1) mutation carriers (red) compared to controls (blue). Dashed lines represent the 90% prediction interval of the cNfL levels in controls, modeled by linear regression of the log-transformed data. (B) We modeled serum levels of NfL (sNfL) (log transformed) across all SCA1 carriers (n = 40) by linear regression with the predictors age and ATXN1 repeat length. Both predictors proved significant and were used to generate the diagram. sNfL levels increased with age and, for a given age, each increase in the repeat length was associated with higher sNfL levels. (C) sNfL levels were higher in ataxic (red) than preataxic (orange) SCA1 carriers, also if stratified by ATXN1 repeat length.
Figure 3
Figure 3. Temporal Dynamics of sNfL Levels in Preataxic SCA1
(A) Serum levels of neurofilament light (sNfL) baseline levels in preataxic individuals with spinocerebellar ataxia type 1 (SCA1) were plotted over the time to the individually predicted onset of ataxia, with negative time values corresponding to the preataxic disease stage. sNfL levels significantly increased with proximity to the predicted onset (F1,20 = 28.67, p < 0.001, adjusted R2 = 0.57), as visualized by the regression line and its 90% prediction band. (B) For the subset of preataxic individuals with SCA1 for whom conversion to the ataxic disease stage was actually clinically observed during follow-up, the sNfL levels at baseline were plotted over the time to the actually observed onset of ataxia. sNfL levels significantly increased with proximity to the observed onset (F1,9 = 15.53, p = 0.003, adjusted R2 = 0.59). To benchmark the levels of the preataxic individuals (orange points), the levels of controls (blue) and ataxic individuals with SCA1 (red) were visualized as horizontal lines (mean and 90% prediction band).
Figure 4
Figure 4. Stratifying the Time to Conversion to the Ataxic Disease Stage by sNfL Levels
(A) For all available preataxic spinocerebellar ataxia type 1 (SCA1) carriers (n = 23), the Kaplan-Meier diagram shows the share of the preataxic carriers remaining preataxic (i.e., the nonconversion probability) plotted over the time to the individually predicted ataxia onset, stratified by baseline serum neurofilament light (sNfL) level. We calculated the predicted age at ataxia onset from each individual’s repeat length and their age at blood sampling. We defined high vs low sNfL levels by median split (threshold 15.5 pg/mL). (B) For the subset of SCA1 carriers for whom longitudinal clinical follow-up information was available (n = 18), the diagram shows the nonconversion probability plotted over the time to the observed ataxia onset, again stratified by baseline sNfL level (median split, threshold 17.1 pg/mL). Vertical dashed lines represent the follow-up duration at which 50% of preataxic individuals (in each stratum) have converted to the ataxic disease stage (i.e., median event-free survival).
Figure 5
Figure 5. sNfL Levels in Preataxic SCA1 in Relation to Pontine and Cerebellar Volumes
(A) Serum neurofilament light (sNfL) levels of preataxic spinocerebellar ataxia type 1 (SCA1) carriers not showing any signs of pontine or cerebellar atrophy (orange point with black circle) are displayed compared to mutation-negative controls (blue), ataxic SCA1 carriers (red), and preataxic SCA1 carriers with pontine or cerebellar atrophy (orange point without black circle). (B) We considered signs of pontine or cerebellar atrophy present if the respective brain volumes were below a threshold defined as the lower boundary of the 90% CI (i.e., the 5% quantile) of the respective volumes measured in healthy age-matched controls, visualized by dashed lines. Preataxic individuals without signs of pontine or cerebellar atrophy are again visualized by orange points with black circles. (C and D) In preataxic SCA1 carriers, pontine and cerebellar volumes were not associated with the sNfL level.
Figure 6
Figure 6. Longitudinal sNfL Levels in SCA1 and Sample Size Estimates for Treatment Trials
(A) Longitudinal measurements of serum neurofilament light (sNfL) levels were available for a subset of preataxic (orange) and ataxic (red) spinocerebellar ataxia type 1 (SCA1) carriers and controls (blue). (B) Intraindividual stability of sNfL levels was assessed from baseline to first follow-up visit (median interval 2.7 years [interquartile range 2.0–3.4 years]). Lines link data of the same individuals. (C) Sample size estimations were performed for future intervention trials with the reduction of sNfL levels used as the outcome measure. The estimated total sample size (i.e., sum of individuals in both study arms) was plotted over the assumed therapeutic effect for lowering the NfL level in ataxic mutation carriers toward the levels observed in healthy controls.

Comment in

References

    1. Robitaille Y, Schut L, Kish SJ. Structural and immunocytochemical features of olivopontocerebellar atrophy caused by the spinocerebellar ataxia type 1 (SCA-1) mutation define a unique phenotype. Acta Neuropathol. 1995;90(6):572-581. - PubMed
    1. Rüb U, Schöls L, Paulson H, et al. Clinical features, neurogenetics and neuropathology of the polyglutamine spinocerebellar ataxias type 1, 2, 3, 6 and 7. Prog Neurobiol. 2013;104:38-66. - PubMed
    1. Paulson HL, Shakkottai VG, Clark HB, Orr HT. Polyglutamine spinocerebellar ataxias: from genes to potential treatments. Nat Rev Neurosci. 2017;18(10):613-626. - PMC - PubMed
    1. Friedrich J, Kordasiewicz HB, O'Callaghan B, et al. Antisense oligonucleotide-mediated ataxin-1 reduction prolongs survival in SCA1 mice and reveals disease-associated transcriptome profiles. JCI Insight. 2018;3(21):e123193. - PMC - PubMed
    1. Kourkouta E, Weij R, González-Barriga A, et al. Suppression of mutant protein expression in SCA3 and SCA1 mice using a CAG repeat-targeting antisense oligonucleotide. Mol Ther Nucleic Acids. 2019;17:601-614. - PMC - PubMed

Publication types

Associated data