. 2022 Apr;32(4):699-709.
doi: 10.1101/gr.276125.121. Epub 2022 Mar 9.

GC content, but not nucleosome positioning, directly contributes to intron splicing efficiency in Paramecium

Affiliations

GC content, but not nucleosome positioning, directly contributes to intron splicing efficiency in Paramecium

Stefano Gnan et al. Genome Res. 2022 Apr.

Abstract

Eukaryotic genes are interrupted by introns that must be accurately spliced from mRNA precursors. With an average length of 25 nt, the more than 90,000 introns of Paramecium tetraurelia stand among the shortest introns reported in eukaryotes. The mechanisms specifying the correct recognition of these tiny introns remain poorly understood. Splicing can occur cotranscriptionally, and it has been proposed that chromatin structure might influence splice site recognition. To investigate the roles of nucleosome positioning in intron recognition, we determined the nucleosome occupancy along the P. tetraurelia genome. We show that P. tetraurelia displays a regular nucleosome array with a nucleosome repeat length of ∼151 bp, among the smallest periodicities reported. Our analysis has revealed that introns are frequently associated with inter-nucleosomal DNA, pointing to an evolutionary constraint favoring introns at the AT-rich nucleosome edge sequences. Using accurate splicing efficiency data from cells depleted for nonsense-mediated decay effectors, we show that introns located at the edge of nucleosomes display higher splicing efficiency than those at the center. However, multiple regression analysis indicates that the low GC content of introns, rather than nucleosome positioning, is associated with high splicing efficiency. Our data reveal a complex link between GC content, nucleosome positioning, and intron evolution in Paramecium.


Figures

Figure 1.
Figure 1.
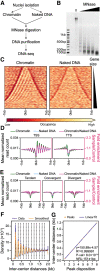
Nucleosome occupancy along the Paramecium MAC genome. (A) Schematic representation of the MNase-seq experiment. (B) MNase digestion of MAC chromatin with increasing MNase enzyme concentration. (C) Heatmap showing nucleosome occupancy ±1 kb around the center of each gene ordered by gene size (small genes on top and large genes at the bottom) for 38,143 genes located on scaffolds that are at least 200 kb long. (Left) Average of two chromatin-treated samples (Chromatin); (right) average of two naked DNA control samples (Naked DNA). (D) Average nucleosome occupancy around transcription start sites (TSSs) identified by 5′ CAP-seq on the left and transcription termination sites (TTSs) identified by poly(A) detection on the right: in green is the average profile of the chromatin-treated sample (Chromatin); in blue, the average profile of the naked DNA sample (Naked DNA); and in magenta, the Chromatin/Naked DNA ratio, enrichment of which is shown on the second axis on the right (red axis). (E) Average nucleosome occupancy ±1 kb around the center of intergenic regions: same color-code as in panel D. Intragenic regions have been divided into three groups based on the relative positions of gene pairs: tandem (left), convergent (middle), or divergent (right). (F) Inter-center distance between well-positioned nucleosomes (Methods) on the same scaffold. In blue are distance distributions from actual data (from 1 bp to 2 kb, binning = 1); in orange, the Gaussian smoothed signal. Black dashed lines indicate the local maxima (peak centers) of the smoothed data (Methods). (G) In orange are the first eight local maxima from panel F ordered by increasing distance; in blue, the linear fitted model. At the bottom right, information about linear fitting and estimated NRL (Mean ± SD) is given. P-value is calculated using a two-sided Z-test.
Figure 2.
Figure 2.
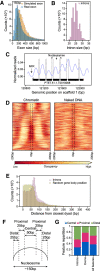
Inter-nucleosomal DNA is frequently associated with intron position. (A) Histogram showing exon size distribution (bin size = 25 bp): in blue are real exons; in orange, simulated exons created assuming uniform exon sizes within each gene. (B) Histogram showing intron size distribution (bin size = 1 bp). (C) Example track reporting nucleosome occupancy over genes with intron locations indicated by vertical dashed lines. We can observe nucleosome-free regions (NFRs) around the gene promoters and introns frequently associated with inter-nucleosomal DNA. (D) Heatmap showing nucleosome occupancy ±200 bp around intron centers. Introns are ordered based on increasing distances from their center to the closest nucleosome center, from top to bottom. The average of the chromatin samples is shown on the left and the average of the naked DNA samples on the right, with the same color-code as in Figure 1C. Vertical black dashed lines delineate the average size of an intron (25 bp). Individual samples are displayed in Supplemental Figure S2C. (E) Histogram reporting the distance of an intron center to the closest nucleosome center (red). For each intron, a random position inside the corresponding gene body was selected, and the distance to its closest nucleosome center is reported (green). Bin size = 5 bp. (F) Schematic representation of the criteria to assign features for each intron (or exon) into one of the three classes, based on the distance (d) between its center and the closest nucleosome center position: central, d ≤ 25 bp; proximal, 25 bp < d < 50 bp; and distal 50 bp ≤ d ≤ 75 bp. (G) Relative distribution of introns, exons, and both features over categories defined in panel F for the introns overlapping with a fixed nucleosome (∼70% of all introns; see Methods) and exons with a size <300 bp overlapping with fixed peaks. See Supplemental Figure S2D, including the features with d > 75 bp.
Figure 3.
Figure 3.
Nucleosome positioning is associated with intron splicing efficiency. (A) Relative distribution of different classes of introns. Introns are grouped based on their length (3n or non-3n) and whether their retention causes a premature termination codon making them sensitive to the nonsense-mediated decay (NMD) mechanism (NMD-sensitive) or not (NMD-insensitive). Within each group, introns are classified based on the distance to the closest nucleosome center as in Figure 2G. P-values are calculated using the χ2 test, and only the significant ones are indicated. (B) Intron repartition according to the categories defined in Figure 2F as a function of their relative position within a gene. Introns are grouped based on their NMD sensitivity. Bin size = 20%. A barplot representation with relative P-values is displayed in Supplemental Figure S3A. (C) The retention rate of introns in WT (dashed lines) and in NMD-depleted (NMDKD; solid lines) cells as a function of their relative position within a gene. Introns are grouped as in panel B. Error bars represent the SEM. P-values calculated using Mann–Whitney U test, and adjusted with a false-discovery rate (5%), are displayed in Supplemental Figure S3B. Bin size = 20%. (D) The retention rate of introns in WT (dashed lines) and in NMDKD (solid lines) cells as a function of gene expression levels. Error bars represent the SEM. Colors and groups are as in panel B. P-values calculated using Mann–Whitney U test, and adjusted with a false-discovery rate (5%), are displayed in Supplemental Figure S3C. (E) Relative characterization of introns, within the same categories as in panel B, based on the strength of splicing acceptor and donor sites. P-values are calculated using the χ2 test and adjusted with a false-discovery rate (5%). Tests were run between introns belonging to the same positional group or between introns belonging to the same NMD group. P-value in all the plots: (*) <0.05, (**) <10−2, (***) <10−3, (****) <10−4, (*****) <10−5, and (******) <10−6.
Figure 4.
Figure 4.
GC content related to nucleosome positioning contributes to intron splicing efficiency. (A) GC content (%) distribution of introns based on the distance to the closest nucleosome center and NMD sensitivity. Mean and standard deviation for each group is reported at the bottom. P-values were calculated using the Mann–Whitney U test and adjusted using the false discovery rate (5%). Tests were run between introns belonging to the same positional group or between introns belonging to the same NMD group. (*) P < 0.05, (**) P < 10−2, (***) P < 10−3, (****) P < 10−4, (*****) P < 10−5, (******) P < 10−6. (B) The retention rate of introns in WT and NMD-depleted (NMDKD) cells as a function of their GC content (excluded GT and AG dinucleotides at both extremities). Introns are classified based on their distance to the closest nucleosome center and on whether they are NMD sensitive or not. Binning = 10%. Error bars represent the SEM. P-values calculated using the Mann–Whitney U test, and adjusted using a false-discovery rate (5%), are displayed in Supplemental Figure S4A. (C) Modeling splicing efficiency (SE) in NMD-depleted cells: The pie chart reports the contribution of each parameter or group of parameters used in the final model. The full list of retained parameters, reporting their contribution and their statistical significance, is displayed in Supplemental Table S1 as well as in Supplemental Figure S4C. (D) The full fitted model in explaining intron splicing efficiency, indicating whether each parameter is positively or negatively correlated with splicing efficiency. The parameter abbreviations are explained in Supplemental Table S1.

References

    1. Alexander RD, Innocente SA, Barrass JD, Beggs JD. 2010. Splicing-dependent RNA polymerase pausing in yeast. Mol Cell 40: 582–593. 10.1016/j.molcel.2010.11.005 - DOI - PMC - PubMed
    1. Allan J, Fraser RM, Owen-Hughes T, Docherty K, Singh V. 2013. A comparison of in vitro nucleosome positioning mapped with chicken, frog and a variety of yeast core histones. J Mol Biol 425: 4206–4222. 10.1016/j.jmb.2013.07.019 - DOI - PMC - PubMed
    1. Amit M, Donyo M, Hollander D, Goren A, Kim E, Gelfman S, Lev-Maor G, Burstein D, Schwartz S, Postolsky B, et al. 2012. Differential GC content between exons and introns establishes distinct strategies of splice-site recognition. Cell Rep 1: 543–556. 10.1016/j.celrep.2012.03.013 - DOI - PubMed
    1. Andersson R, Enroth S, Rada-Iglesias A, Wadelius C, Komorowski J. 2009. Nucleosomes are well positioned in exons and carry characteristic histone modifications. Genome Res 19: 1732–1741. 10.1101/gr.092353.109 - DOI - PMC - PubMed
    1. Arceci RJ, Gross PR. 1980. Sea urchin sperm chromatin structure as probed by pancreatic DNase I: evidence for a novel cutting periodicity. Dev Biol 80: 210–224. 10.1016/0012-1606(80)90509-6 - DOI - PubMed

Publication types