. 2022 Apr 1;208(7):1686-1699.
doi: 10.4049/jimmunol.2100555. Epub 2022 Mar 9.

The Extracellular ATP Receptor P2RX7 Imprints a Promemory Transcriptional Signature in Effector CD8+ T Cells

Affiliations

The Extracellular ATP Receptor P2RX7 Imprints a Promemory Transcriptional Signature in Effector CD8+ T Cells

Trupti Vardam-Kaur et al. J Immunol. .

Abstract

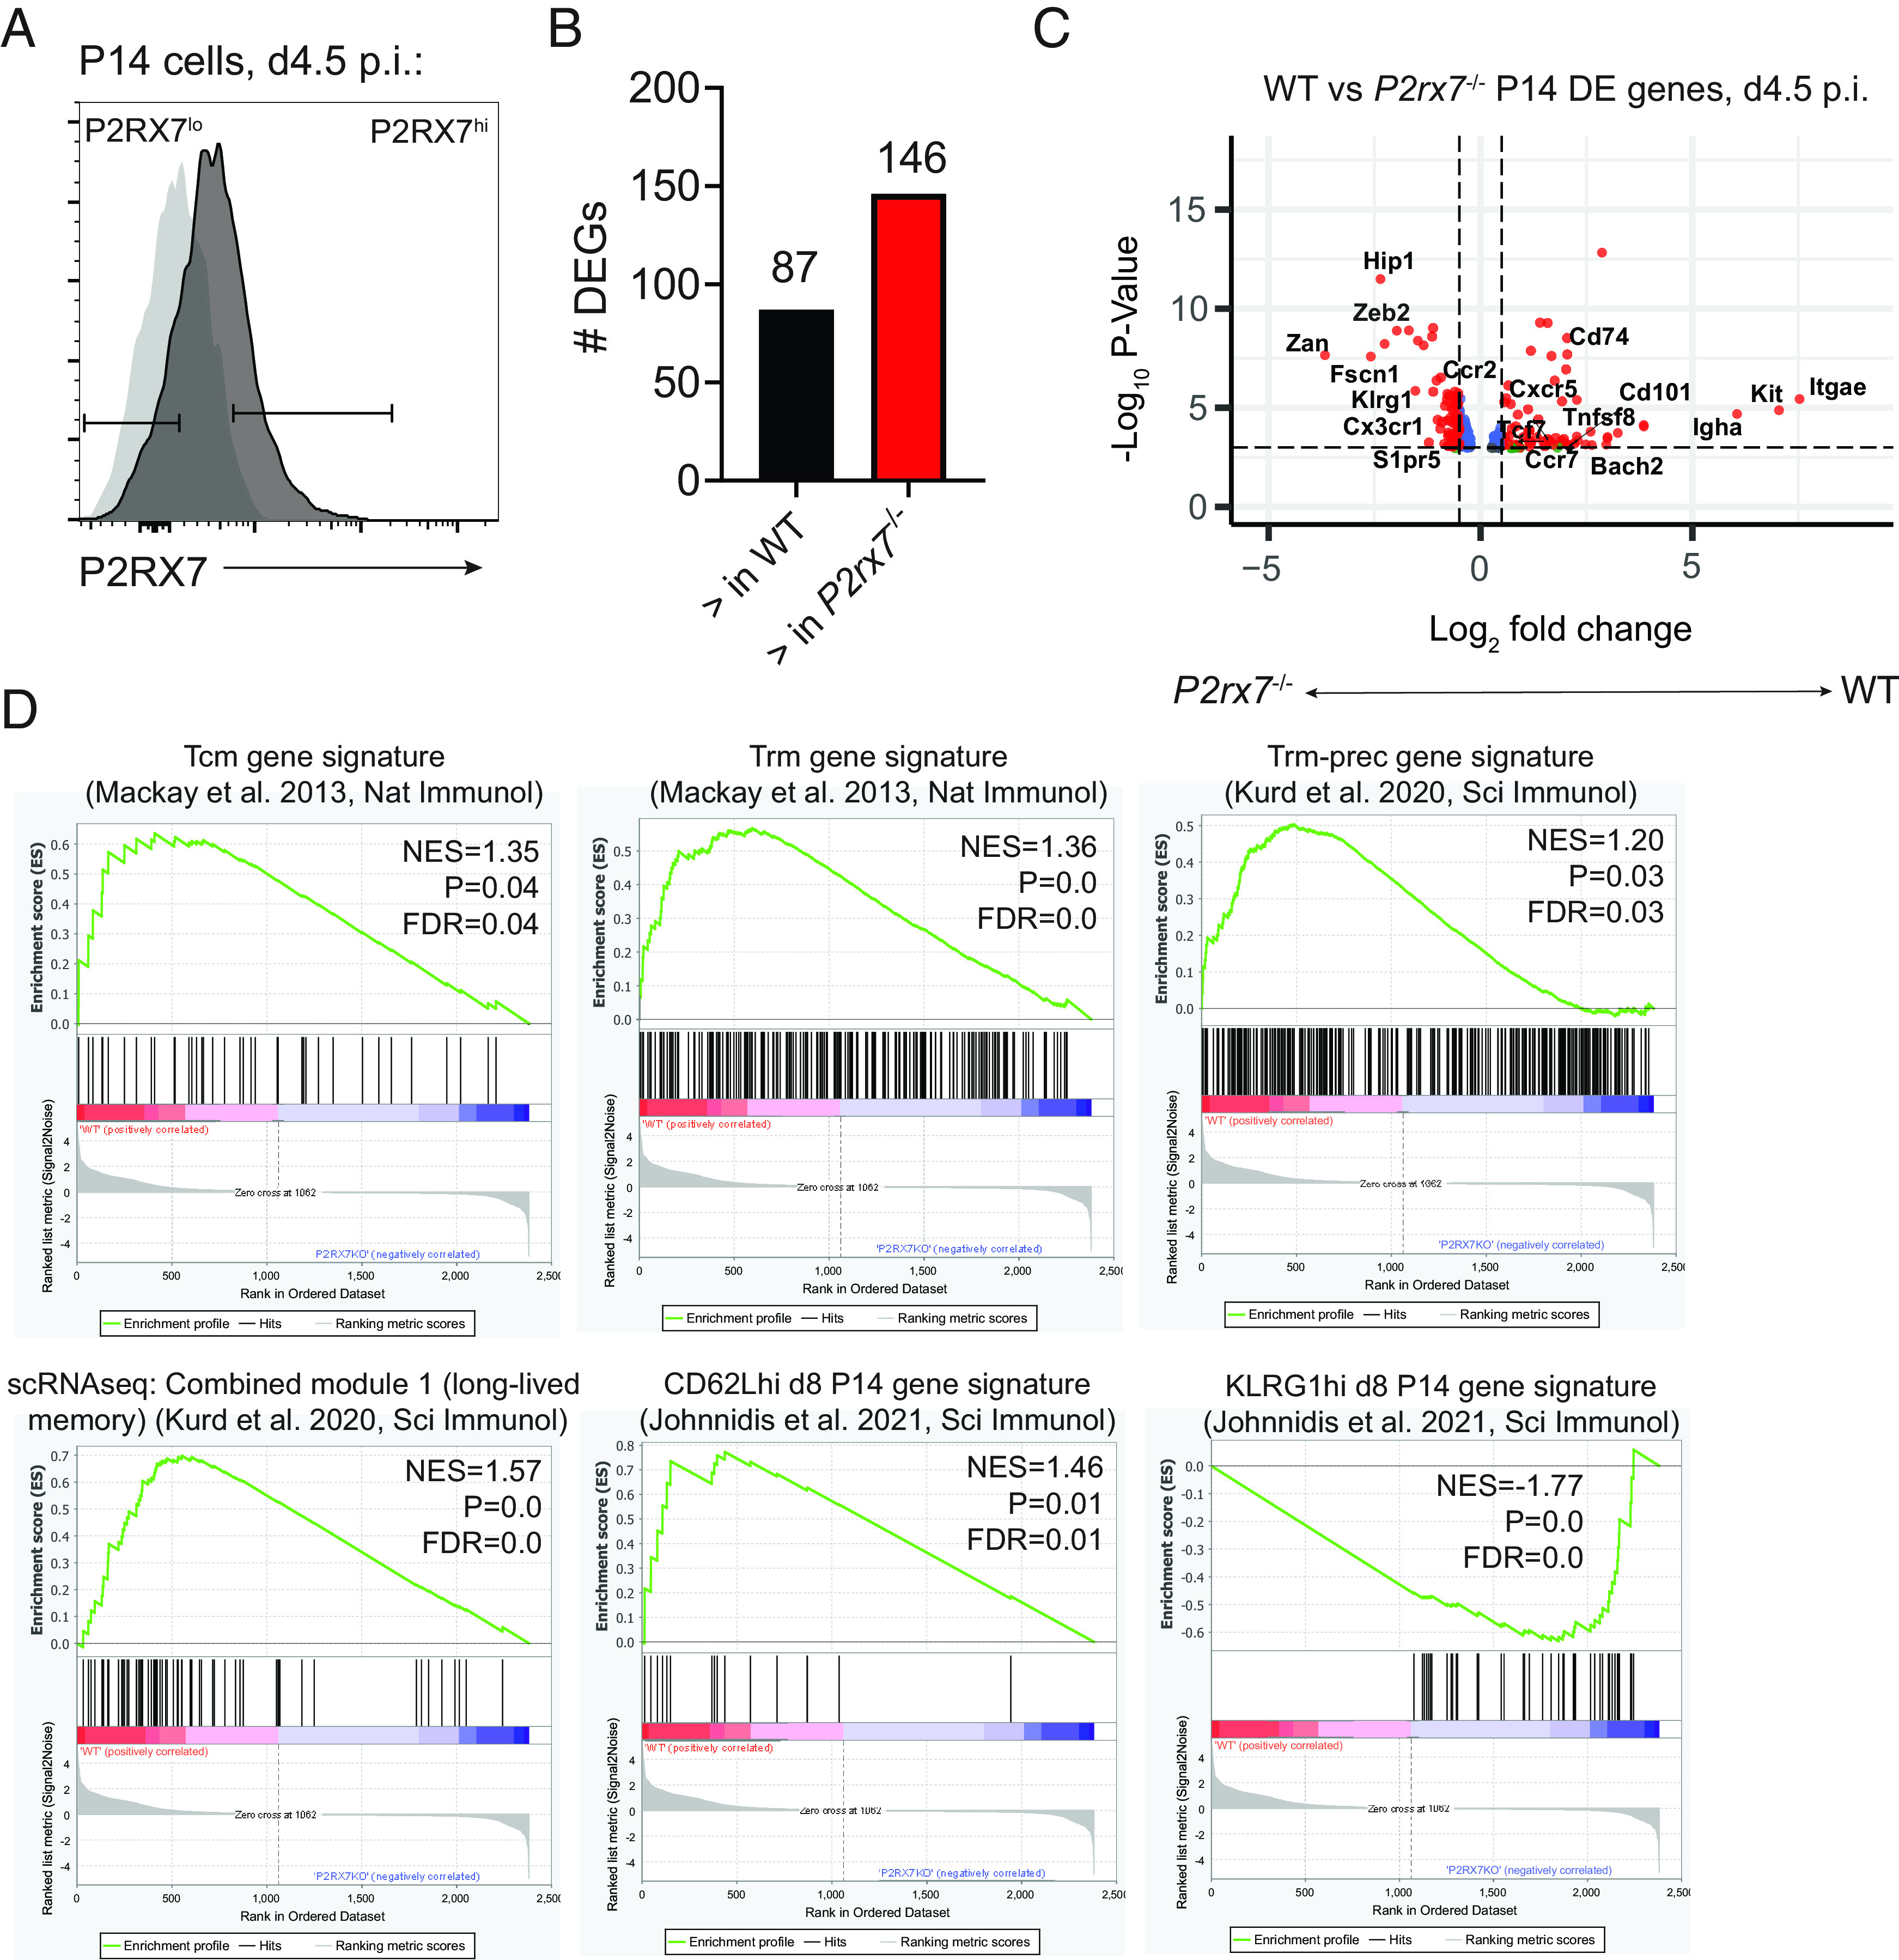
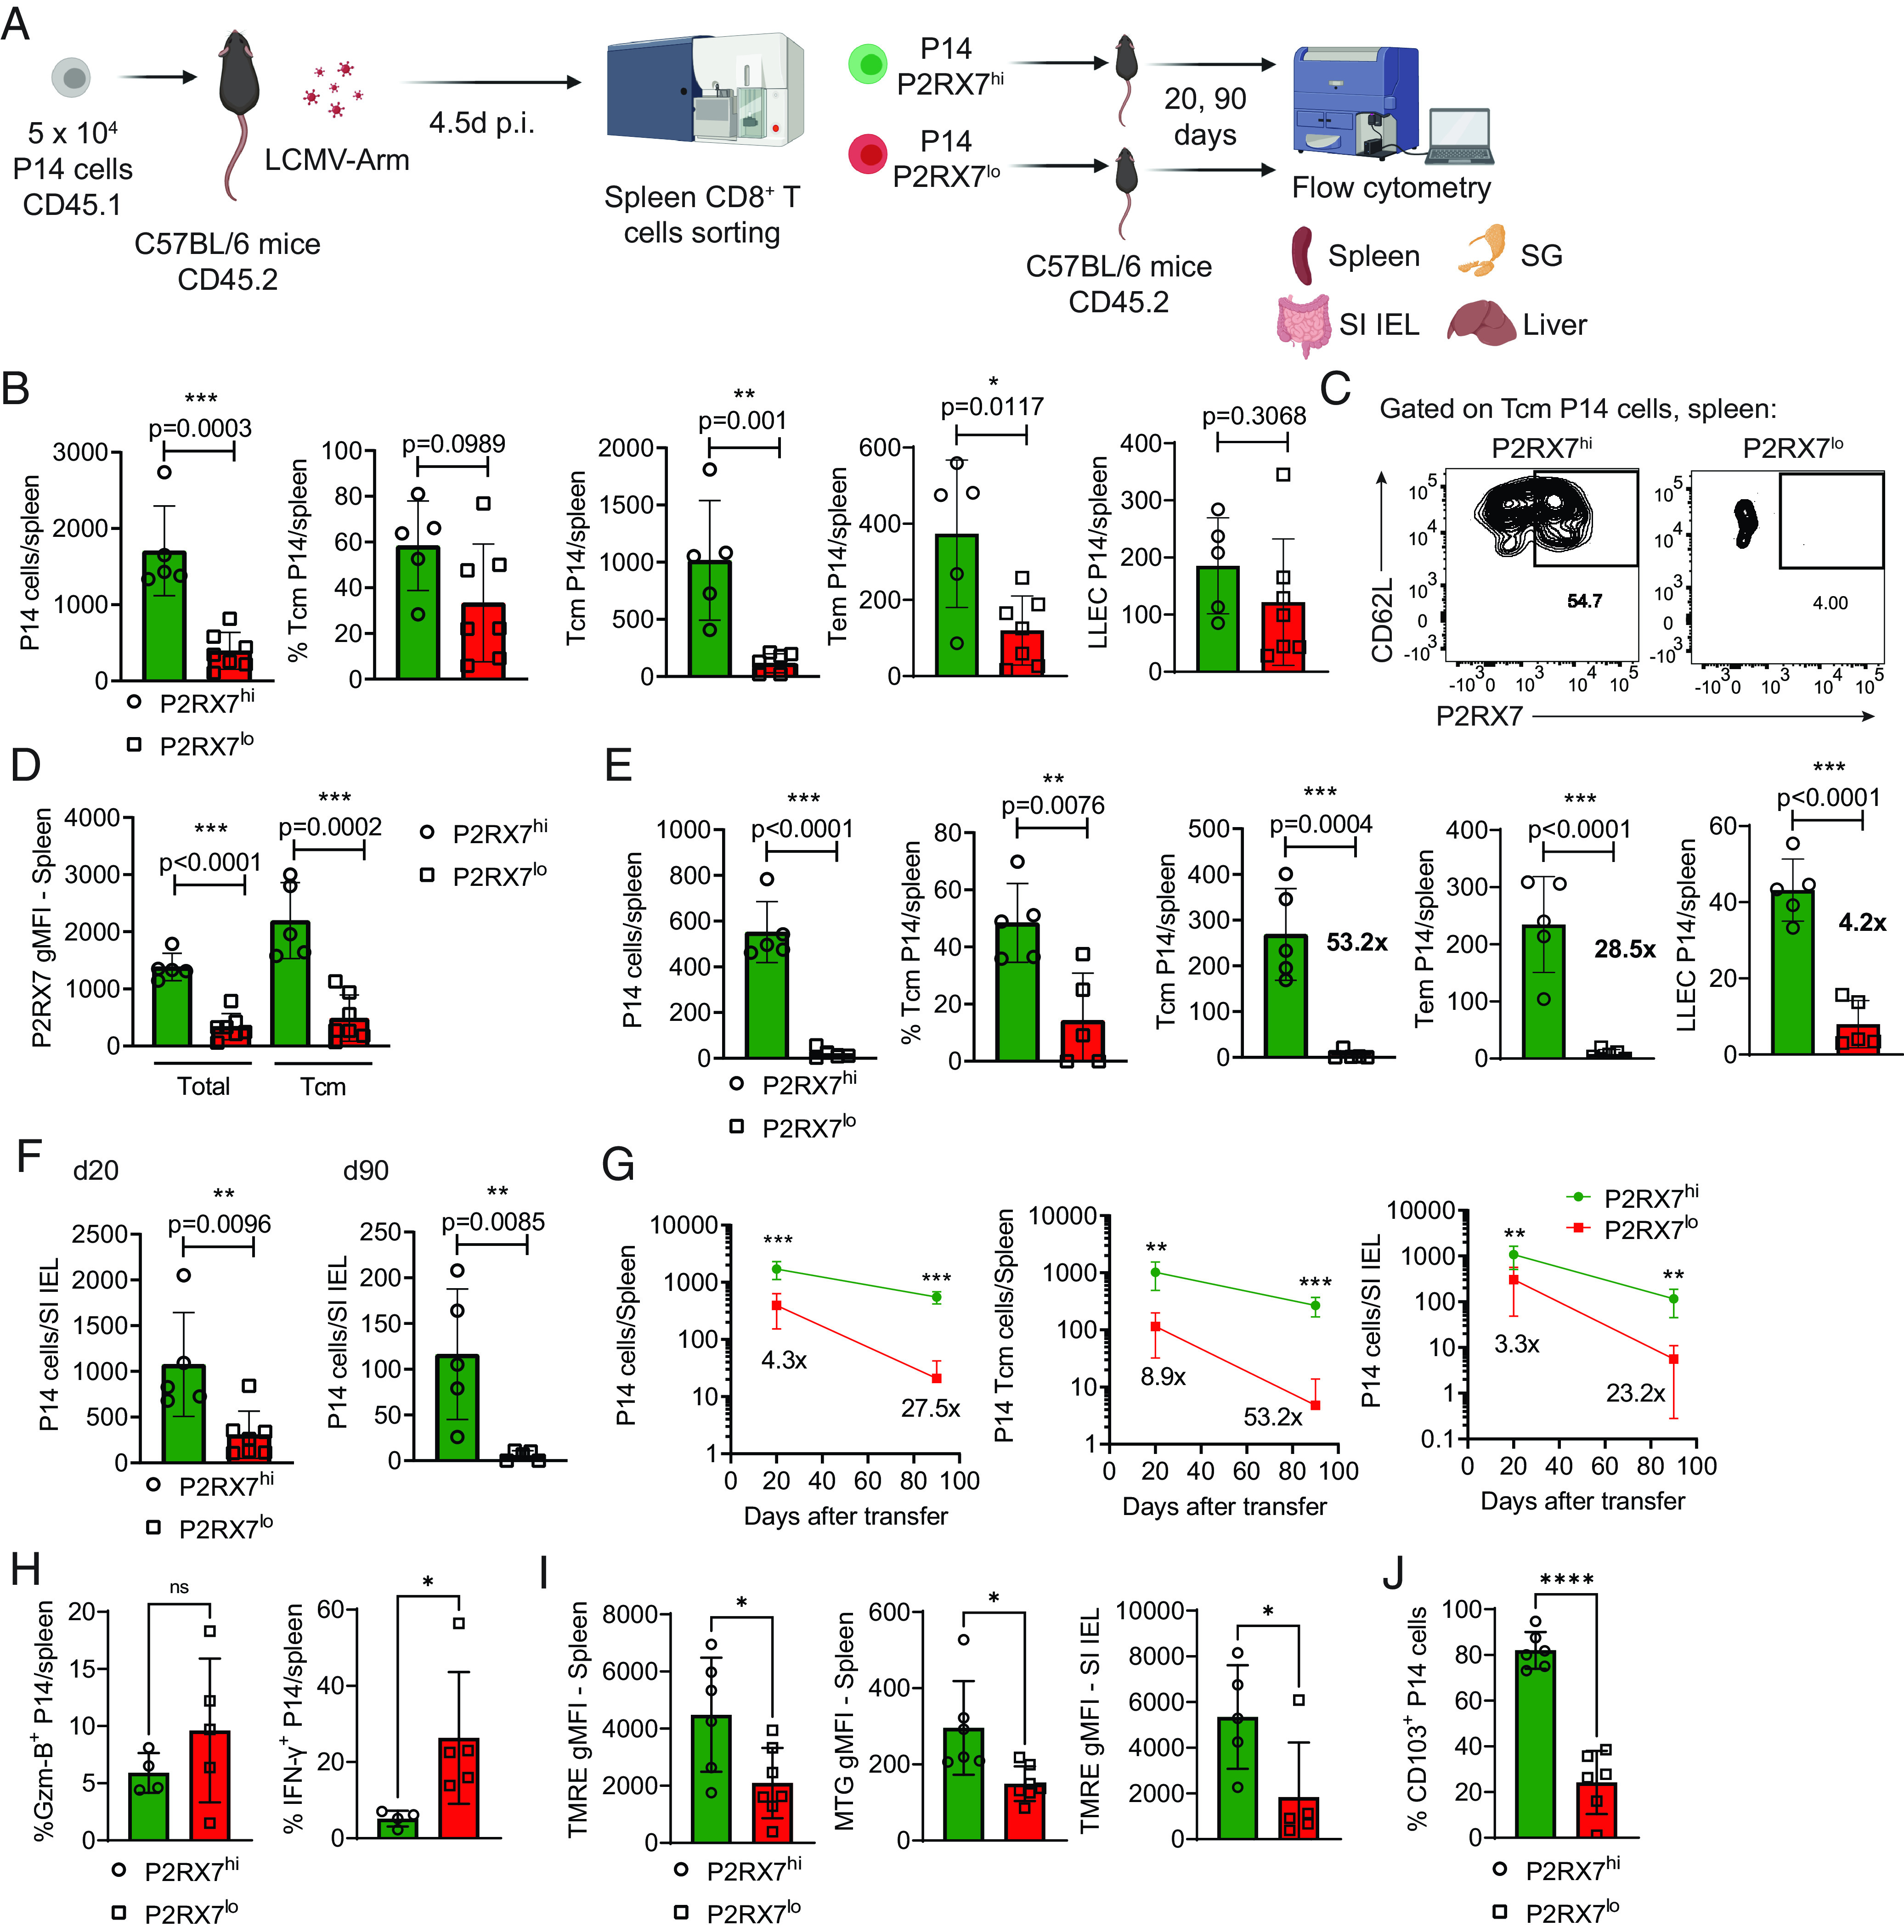
Development of CD8+ central memory T (Tcm) and resident memory T (Trm) cells, which promote immunity in the circulation and in barrier tissues, respectively, is not completely understood. Tcm and Trm cells may arise from common precursors; however, their fate-inducing signals are elusive. We found that virus-specific effector CD8+ T cells display heterogeneous expression of the extracellular ATP sensor P2RX7. P2RX7-high expression is confined, at peak effector phase, to CD62L+ memory precursors, which preferentially form Tcm cells. Among early effector CD8+ T cells, asymmetrical P2RX7 distribution correlated with distinct transcriptional signatures, with P2RX7-high cells enriched for memory and tissue residency sets. P2RX7-high early effectors preferentially form both Tcm and Trm cells. Defective Tcm and Trm cell formation in P2RX7 deficiency is significantly reverted when the transcriptional repressor Zeb2 is ablated. Mechanistically, P2RX7 negatively regulates Zeb2 expression, at least partially through TGF-β sensing in early effector CD8+ T cells. Our study indicates that unequal P2RX7 upregulation in effector CD8+ T cells is a foundational element of the early Tcm/Trm fate.


Conflict of interest statement

The authors have no financial conflicts of interest.

Figures

FIGURE 1.
FIGURE 1.
P2RX7 expression is heterogeneous among MPs and favors Tcm generation. (A) P2rx7 mRNA counts from an RNA-seq comparison between MPs and TEs done by our group in a previous study. (BD) C57BL/6 mice were infected with LCMV-Arm and harvested at 8 d after infection (p.i.). The protein expression of multiple molecules in Ag-specific (gp33-tetramer+) CD8+ MPs is shown. (B) Left: representative histogram showing P2RX7 expression in gp33+ MPs. Center: Representative contour plots showing the expression of CD44 and CD62L in P2RX7hi versus P2RX7lo MPs. Right: Average percentages of CD62L+ cells within P2RX7hi (green, open squares) and P2RX7lo (red, open circles) MPs and TEs. (C) Representative histograms of the expression of CD44, Tim3, CD101, and TCF1 in P2RX7hi (green) and P2RX7lo (red) MPs (solid lines) and TEs (dashed lines). (D) Geometric mean fluorescence intensity (gMFI) average values of CD44, CD101, and TCF-1 and percentages of Tim3+ in P2RX7hi (green, open squares) and P2RX7lo (red, open circles) MPs and TEs. (E and F) In some experiments, P2RX7hi (30% highest) and P2RX7lo (30% lowest) MPs and TEs were cell sorted and reactivated in vitro with PMA and ionomycin. (E) Representative histograms showing production of IFN-γ in P2RX7hi versus P2RX7lo P14 MPs and TEs. (F) Average percentages of GzmB+ (left) and IFN-γ+ P2RX7hi versus P2RX7lo P14 MPs and TEs. (G) P14 cells (CD45.1+) were transferred to C57BL/6 (CD45.2+) mice, which were subsequently infected with LCMV-Arm. After 8 d, P2RX7hi P14 MPs (30% highest) and P2RX7lo P14 MPs (30% lowest) were sorted and adoptively transferred into infection-matched C57BL/6 mice (3 × 10⁵ cells/mouse). After 28 d, the numbers and phenotype of transferred P14 cells were assessed in spleens of recipient mice using flow cytometry. On the bottom, representative plots showing the P14 populations present in recipient mice, including negative (No transfer) and positive (+ Tcm) controls. (H) Numbers of transferred P14 cells/spleen (top left), percentage of CD62L+ P14 cells (bottom left), and P2RX7 gMFI (top right) in recipient mice for positive control (Tcm) cells (white, open diamonds), P2RX7hi MPs (green, open squares), and P2RX7lo MPs (red, open circles). (A, B, D, F, H) One-way ANOVA, *p < 0.05, **p < 0.01, ***p < 0.001, ****p < 0.0001. (B–F) Average values ± SD; data pooled from three independent experiments (n = 4–10).
FIGURE 2.
FIGURE 2.
WT P14 cells are enriched for a promemory gene signature in comparison with P2rx7−/− P14 cells. (A) Representative flow cytometry histogram showing the expression of P2RX7 in P14 cells at day 4.5 after LCMV (dark) and naive (light gray). (BD) Spleen WT and P2rx7−/− P14 cells (previously coadoptively transferred into recipient B6 mice) were sorted from recipient mice at 4.5 d after infection (p.i.). The RNAs extracted from these populations were submitted for RNA-seq analysis. (B) Bar graph showing the numbers of DEGs between WT and P2rx7−/− P14 cells. (C) Volcano plot showing all DEGs upregulated (right) or downregulated (left) in WT P14 cells compared with P2rx7−/− counterparts. Selected representative DEGs are denoted in this figure. (D) GSEA showing selected gene expression datasets (from the previous studies respectively cited) enriched in WT or P2rx7−/− (P2RX7KO) day 4.5 P14 cells. (B–D) Each replicate is a pool of spleen P14 cells from four mice; n = 3 replicates per experimental group. FDR, false discovery rate; NES, normalized enrichment score.
FIGURE 3.
FIGURE 3.
Defining the core genes quantitatively and qualitatively controlled by P2RX7 in early effector CD8+ T cells. (AD) Spleen WT P14 cells (previously transferred into recipient B6 mice) were sorted from recipient mice at 4.5 d after infection based on 20% highest (P2RX7hi) and 20% lowest (P2RX7lo) expression. The RNAs extracted from these populations were submitted for RNA-seq analysis. (A) Principal component (PC) analysis plot showing the relationship (based on PC1 and PC2 values) between P2RX7hi and P2RX7lo RNA-seq samples. (B) Volcano plot showing all DEGs upregulated (right) or downregulated (left) in P2RX7hi P14 cells compared with P2RX7lo counterparts. Selected representative DEGs are denoted in this figure. (C) Heatmap showing the RNA count levels (normalized Z-scores) of all DEGs between P2RX7hi and P2RX7lo WT P14 cells. (D) GSEA showing selected gene expression datasets (from the previous studies respectively cited) enriched in P2RX7hi or P2RX7lo day 4.5 P14 cells. (E) Venn diagrams showing the correlation between DEGs found between WT and P2rx7−/− day 4.5 P14 cells (red) and P2RX7hi versus P2RX7lo day 4.5 P14 cells (blue). The common DEGs found for both these comparisons (purple intersections) are listed. (F) Immgen (https://www.immgen.org/) RNA expression values (day 7 MPs, TEs, or SI-IEL P14) of selected genes enriched (in our analysis) in WT/P2RX7hi day 4.5 P14 cells or P2rx7−/−/P2RX7lo day 4.5 P14 cells. (A–D) Each replicate is a pool of spleen P14 cells from six mice; n = 3 replicates per experimental group. FDR, false discovery rate; NES, normalized enrichment score.
FIGURE 4.
FIGURE 4.
P2RX7 protein expression in early effector CD8+ T cells correlates with memory marker expression. (AD) WT P14 cells were adoptively transferred into recipient B6 mice, which were infected with LCMV-Arm. Infected mice spleens were harvested at day 4.5 (A–C), day 3, or day 8 (D) after infection (p.i.) for P14 cell analysis. (A) Representative t-distributed stochastic neighbor embedding plots depicting the protein expression of CD62L, P2RX7, and KLRG1 among spleen P14 cells. (B) Average values for percentages of CD62L+/CXCR5+/CD25+/CD103hi/Tim3+/KLRG1+ and CD44/CD8α/PD1/CD101/integrin β7 geometric mean fluorescence intensity (gMFI) in P2RX7hi and P2RX7lo spleen P14 cells. (C) Average gMFI values for TMRE and MTG in P2RX7hi and P2RX7lo spleen P14 cells. (D) Average percentages of CD25+ P2RX7hi and P2RX7lo spleen P14 cells at day 3 after LCMV (left) and of CD25+ P2RX7hi and P2RX7lo spleen P14 MPs and TEs at day 8 after LCMV (right). (E) P2rx7 mRNA values from day 3 post-LCMV CD25hi versus CD25lo P14 cells [data taken from Ref. (38)]. (F) GSEA showing the listed gene expression datasets [data taken from Ref. (38)] enriched in day 4.5 WT or P2RX7-KO P14 cells (left and center) and in day 4.5 P2RX7hi versus P2RX7lo P14 cells (right). (B–E) Unpaired t test; *p < 0.05, **p < 0.01, ***p < 0.001, and ****p < 0.0001. (D, right) One-way ANOVA. (B–D) Average values ± SD; data pooled from two or three independent experiments (n = 5–10).
FIGURE 5.
FIGURE 5.
P2RX7 expression in early effectors favors the establishment of long-lived circulating and resident memory CD8+ T cells. (AJ) P14 cells were adoptively transferred into B6 mice (infected with LCMV-Arm), and, at day 4.5 after infection (p.i.), P2RX7hi (20% highest) and P2RX7lo (20% lowest) were sorted and adoptively transferred into infection-matched mice (3 × 10⁵ cells/mouse). At days 20 and 90 after transfer, secondary recipient mice were assessed for transferred P14 cell numbers and phenotype. (A) Experimental plan for the secondary transfer experiments. (B) Total numbers, percentages of Tcm, and numbers of Tcm/Tem/LLEC P14 cells from P2RX7hi or P2RX7lo early effector progenitors at day 20 after transfer. (C) Representative flow cytometry plots showing P2RX7 expression in Tcm P14 cells from P2RX7hi and P2RX7lo early effectors at day 20 after transfer. (D) Average P2RX7 geometric mean fluorescence intensity (gMFI) levels in total and Tcm spleen P14 cells from P2RX7hi and P2RX7lo donors at day 20 after transfer. (E) Total numbers, percentages of Tcm, and numbers of Tcm/Tem/LLEC P14 cells from P2RX7hi or P2RX7lo early effector progenitors at day 90 after transfer. (F) Numbers of SI IEL P14 cells at day 20 (left) and day 90 (right) after transfer. (G) Kinetics of the numbers of total spleen (left), spleen Tcm (center), and SI IEL (right) P14 cells over time after secondary transfer. The fold differences between P2RX7hi and P2RX7lo donor P14 cells are shown. (H) Percentages of GzmB+ and IFN-γ+ P14 cells from P2RX7hi or P2RX7lo early effectors at day 20 after transfer. (I) Average gMFI values for TMRE (left) and MTG (center) in spleen P14 cells and TMRE from SI IEL P14 cells (right) from P2RX7hi or P2RX7lo early effectors at day 20 after transfer. (J) Average percentages of CD103+ P14 cells from P2RX7hi or P2RX7lo early effector donors after 40-h incubation with TGF-β. (B, D–J) Unpaired t test; *p < 0.05, **p < 0.01, ***p < 0.001, ****p < 0.0001. (B–J) Average values ± SD; data pooled from three independent experiments (n = 5–7).
FIGURE 6.
FIGURE 6.
Zeb2 KO partially rescues the ability of P2RX7-deficient CD8+ T cells to form early MPs and Tcm and Trm subsets. (AI) WT (CD4-Cre) and P2RX7-KO (CD4-Cre P2rx7fl/fl) P14 cells were in vitro activated. After 48 h, CRISPR-Cas9 RNP-based knockdown of Zeb2 or Cd4 (control) was performed. Cells were rested in IL-2 for an additional 48 h and subsequently transferred into recipient B6 mice. Recipient mice were infected with LCMV-Arm, and the numbers and phenotype of transferred P14 cells were assessed over time after infection (p.i.). (A) Experimental strategy of the CRISPR-Cas9 knockdown experiments. (B) Representative flow cytometry plots showing expression of KLRG1 in spleen P14 cells at day 4.5 after infection. (C) Percentages of spleen KLRG1+ P14 cells at day 4.5 after infection. (D) Percentages (top) and numbers (bottom) of KLRG1CD127+ MP P14 cells in the spleen at day 7 after infection. (E) Representative flow cytometry plots showing expression of KLRG1 and CD127 in blood P14 cells at day 14 after infection. (F) Total numbers (top) and percentages of Tcm (CD62L+; bottom) spleen P14 cells at day 28 after infection. (G) Representative flow cytometry plots showing the expression of CD69 and CD103 in SI IEL P14 cells at day 7 after infection. (H) Percentages of CD69+CD103hi SI IEL P14 cells at day 7 after infection. (I) Total numbers (top) and percentages of CD69+CD103hi (bottom) SI IEL P14 cells at day 28 after infection. (C, D, F, H, I) Unpaired t test; *p < 0.05, **p < 0.01, and ***p < 0.001. (B–I) Average values ± SD; data pooled from two independent experiments (n = 4–6).
FIGURE 7.
FIGURE 7.
Tgfbr2 overexpression compensates the deficiency in P2RX7 for the suppression of Zeb2 expression in effector CD8+ T cells. (AC) WT (CD4-Cre) and P2RX7-KO (CD4-Cre P2rx7fl/fl) P14 cells were in vitro activated. After 24 h, cells were transduced with control empty retrovirus (RV-EV; expressing Thy1.1) or Tgfbr2-encoding retrovirus (RV-Tgfbr2; expressing mCherry) via spinfection. Cells were rested for 48 h and then sorted on the basis of transduction markers Thy1.1 or mCherry. Sorted, transduced cells were incubated for 40 h with TGF-β. (A) Schematics of the experimental design. (B) Representative flow cytometry plots showing mCherry expression (as a readout for transduction with RV-Tgfbr2) in WT or P2RX7-KO P14 cells before cell sorting (above) and after cell sorting (below). (C) Average Zeb2 mRNA expression values in RV-EV– and RV-Tgfbr2–transduced WT and P2RX7-KO P14 cells after incubation with TGF-β. (C) One-way ANOVA; *p < 0.05, **p < 0.01. (C) Average values ± SD; data pooled from three independent experiments (n = 6). SSC-A, side scatter area.

References

    1. Farber D. L., Netea M. G., Radbruch A., Rajewsky K., Zinkernagel R. M.. 2016. Immunological memory: lessons from the past and a look to the future. Nat. Rev. Immunol. 16: 124–128. - PubMed
    1. Williams M. A., Bevan M. J.. 2007. Effector and memory CTL differentiation. Annu. Rev. Immunol. 25: 171–192. - PubMed
    1. Jameson S. C., Masopust D.. 2018. Understanding subset diversity in T cell memory. Immunity 48: 214–226. - PMC - PubMed
    1. Gerlach C., Moseman E. A., Loughhead S. M., Alvarez D., Zwijnenburg A. J., Waanders L., Garg R., de la Torre J. C., von Andrian U. H.. 2016. The chemokine receptor CX3CR1 defines three antigen-experienced CD8 T cell subsets with distinct roles in immune surveillance and homeostasis. Immunity 45: 1270–1284. - PMC - PubMed
    1. Milner J. J., Nguyen H., Omilusik K., Reina-Campos M., Tsai M., Toma C., Delpoux A., Boland B. S., Hedrick S. M., Chang J. T., Goldrath A. W.. 2020. Delineation of a molecularly distinct terminally differentiated memory CD8 T cell population. Proc. Natl. Acad. Sci. USA 117: 25667–25678. - PMC - PubMed

Substances