. 2022 Apr 1;208(7):1700-1710.
doi: 10.4049/jimmunol.2100491. Epub 2022 Mar 9.

CRISPR/Cas9-Mediated Insertion of HIV Long Terminal Repeat within BACH2 Promotes Expansion of T Regulatory-like Cells

Affiliations

CRISPR/Cas9-Mediated Insertion of HIV Long Terminal Repeat within BACH2 Promotes Expansion of T Regulatory-like Cells

Michelle L Christian et al. J Immunol. .

Abstract

One key barrier to curative therapies for HIV is the limited understanding of HIV persistence. HIV provirus integration sites (ISs) within BACH2 are common, and almost all sites mapped to date are located upstream of the start codon in the same transcriptional orientation as the gene. These unique features suggest the possibility of insertional mutagenesis at this location. Using CRISPR/Cas9-based homology-directed repair in primary human CD4+ T cells, we directly modeled the effects of HIV integration within BACH2 Integration of the HIV long terminal repeat (LTR) and major splice donor increased BACH2 mRNA and protein levels, altered gene expression, and promoted selective outgrowth of an activated, proliferative, and T regulatory-like cell population. In contrast, introduction of the HIV-LTR alone or an HIV-LTR-major splice donor construct into STAT5B, a second common HIV IS, had no functional impact. Thus, HIV LTR-driven BACH2 expression modulates T cell programming and leads to cellular outgrowth and unique phenotypic changes, findings that support a direct role for IS-dependent HIV-1 persistence.


Conflict of interest statement

DECLARATION OF INTERESTS

The authors declare no competing interests.

Figures

Fig. 1.
Fig. 1.. Gene editing using AAV-CRISPR/Cas9 for targeted HIV-LTR insertion at the BACH2 intron 5 locus.
a Schematic of the CRISPR/Cas9-AAV HDR-based editing approach for HIV-LTR insertion within intron 5 of the BACH2 locus. The AAV donor constructs consist of a single HIV-LTR (long terminal repeat) element (Solo-LTR) or an LTR followed by viral sequence leading up to the major splice donor (LTR-MSD), flanked by 600 bp homology arms to BACH2 and the AAV inverted terminal repeats (AAV ITR) required for AAV packaging and viral production. The CRISPR/Cas9 target site for guide 3 (G3) is indicated by a black arrow; relative location of a known HIV-insertion site at BACH2 intron 5 is indicated by red arrow. b Experimental protocol and timeline. c Frequency of indels generated by BACH2 and STAT5B guides as measured by Inference of CRISPR Edits (ICE). For BACH2 G1 n = 6, BACH2 G3 n = 5, and STAT5B G1 n = 4. d Guide-specific HDR-editing efficiency of AAV HIV-LTR constructs as measured by ddPCR in different PBMC donors. For BACH2 G1 n = 3; BACH2 G3 (n = 4) is shown, n =7; and STAT5B G1 n = 4. All data are represented as mean and error bars indicate SD.
Fig. 2.
Fig. 2.. Quantification of integrated HIV-LTR cassettes showing specific expansion of BACH2 LTR-MSD targeted primary CD4+ T cells over time.
a Representative outgrowth of Solo-LTR and LTR-MSD edited populations from a single experiment targeting BACH2 over time, measured by ddPCR. Error bars represent SD between 2 biological replicates in each experiment. b Fold expansion of edited populations targeting BACH2 over time in different PBMC donor cells. Representative, (n = 3) is shown, n = 7. c Proliferation of CD4+ T-cell samples from BACH2 targeting experiments assessed over time. Representative, (n = 3) is shown, n = 14. d Representative outgrowth of Solo-LTR and LTR-MSD edited populations from a single experiment targeting STAT5B over time, measured by ddPCR. Error bars represent SD between 2 biological replicates in each experiment. e Fold expansion of edited populations targeting STAT5B over time in different PBMC donor cells. Representative, (n = 3) is shown, n = 4. f Proliferation of CD4+ T-cell samples from STAT5B targeting experiments assessed over time. Representative, (n = 3) is shown, n = 5. All data are represented as mean and error bars indicate SD.
Fig. 3.
Fig. 3.. BACH2 LTR-MSD editing promotes increased expression of LTR-hybrid mRNA and BACH2 protein.
a,b Schematic of BACH2/STAT5B endogenous and LTR-hybrid mRNA; white and gray boxes indicate non-coding and coding exons (Ex), respectively. The integrated LTR-MSD cassette is shown in black. Arrows represent primer sets for RT-ddPCR capturing hybrid transcripts (hF1/hR1). Bars indicate amplified cDNA products from the endogenous or hybrid primer sets with dashed lines showing spliced regions. c Ratio of hybrid BACH2 or STAT5B to endogenous BACH2 or STAT5B transcripts, respectively, standardized to HPRT transcripts, generated by LTR-MSD targeted samples at early (day 7) and late (day 35) timepoints. n = 6 for BACH2 and n = 4 for STAT5B. d, e Fold change of BACH2 and STAT5B endogenous transcripts standardized to HPRT transcripts relative to the average expression across all sample groups within an experiment. Levels at early and late timepoints measured by ddPCR, n = 6 (c) or 3 (d). f Western blot analysis of BACH2 (upper panel) and STAT5B (lower panel) protein expression from a representative experiment with 2 biological replicates for each HDR-targeted sample. β-actin expression was assessed in parallel as a loading control. The representative western blots were performed twice independently. g Normalized and averaged signal from the Western blots in (f). Significance was determined by one-way ANOVAs with Tukey’s multiple comparison tests (d, e, g), as well as Student’s two-tailed t-tests (c). All data are represented as mean and error bars indicate SD.
Fig 4.
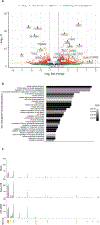
Fig 4.. RNA-seq analysis of edited populations showing unique gene expression profile and hybrid transcripts in BACH2 LTR-MSD targeted T cells.
a) Volcano plot showing the 452 differentially expressed genes between BACH2 LTR-MSD and Solo-LTR edited CD4 T cell populations at 48 days of culture (309 genes upregulated in LTR-MSD and 143 down-regulated in LTR-MSD compared to Solo-LTR, respectively). Each dot represents a gene with: grey not reaching significance and less than an absolute log2 fold change of 1; green not reaching significance but an absolute log2 fold change > 1; blue having an adjusted p-value < 0.05 but less than an absolute log2 fold change of 1; and red having an adjusted p-value < 0.05 and an absolute log2 fold change > 1. Log2 fold change > 0 means higher expression in LTR-MSD, and vice versa. A select number of genes were annotated. b) Shown are the top 30 alphabetically sorted genesets, fold-enrichment scores, and false discovery rate (FDR) determined from a PANTER (Protein ANalysis Through Evolutionary Relationships) overrepresentation test of homo sapien gene-ontology biological processes. c) Coverage map of RNA-seq reads mapped to the hg38 chr6 BACH2 locus. Gene polarity is displayed right to left as on chromosome 6 for mock edited control cells, LTR-solo edited, and LTR-MSD edited cells. Accumulation of reads are shown as histograms scaled to read count (y-axis). Exons 1–9 are shown as orange rectangles with the LTR insertion into intron 5 indicated as a red bar.
Fig 5.
Fig 5.. BACH2 LTR-MSD targeted T cells exhibit a unique proliferative, activated, Treg-like cell phenotype.
a Representative flow plots and gating strategy of edited and control samples for the indicated cell surface and intracellular markers. b Pooled data of markers in (a) with n = 6 (PD-1, CD69, CD25, CD127), n = 5 (LAG-3, TIGIT), and n = 3 (FOXP3, CTLA-4, HELIOS). Data shown as fold change compared to average mean MFI from all sample groups, within an independent experiment. c Combined IL-10 and TGFB transcript levels from BACH2 edited samples standardized to HPRT transcripts at the late timepoint, n = 5. Data shown as fold change compared to average mean expression from all sample groups, within an independent experiment. d Pooled cytokine production from 4 experiments, standardized as in (b). Briefly, cells were stimulated with PMA, Ionomycin, and Golgi-stop before fixing/perming and staining for cytokine production. e Left, representative flow plots tracking CD4 expression post editing. Right, combined data showing fold-change in CD4 expression from experiments using 4 independent donors f Left, representative flow plots of CellTrace (CT) proliferation dye staining after 96h incubation. Briefly, cells were washed and incubated with CT dye for 20 mins, then quenched with fresh media for 5 mins. Cells were then spun down and cultured in full cytokine media for 96h at which point they were flowed for CT dilution. Right, pooled data of CT stain from 3 independent experiments. Data represented as mean and error bars indicate SD.

References

    1. Lewinski MK, Bisgrove D, Shinn P, Chen H, Hoffmann C, Hannenhalli S, Verdin E, Berry CC, Ecker JR, Bushman FD. 2005. Genome-wide analysis of chromosomal features repressing human immunodeficiency virus transcription. J. Virol. 79: 6610–6619. - PMC - PubMed
    1. Schröder ARW, Shinn P, Chen H, Berry C, Ecker JR, Bushman F. 2002. HIV-1 Integration in the Human Genome Favors Active Genes and Local Hotspots. Cell. 110: 521–529. - PubMed
    1. Lucic B, Chen H-C, Kuzman M, Zorita E, Wegner J, Minneker V, Wang W, Fronza R, Laufs S, Schmidt M, Stadhouders R, Roukos V, Vlahovicek K, Filion GJ, Lusic M. 2019. Spatially clustered loci with multiple enhancers are frequent targets of HIV-1 integration. Nat. Commun. 10: 4059. - PMC - PubMed
    1. Wagner TA, McLaughlin S, Garg K, Cheung CYK, Larsen BB, Styrchak S, Huang HC, Edlefsen PT, Mullins JI, Frenkel LM. 2014. Proliferation of cells with HIV integrated into cancer genes contributes to persistent infection. Science. 345: 570–573. - PMC - PubMed
    1. Maldarelli F, Wu X, Su L, Simonetti FR, Shao W, Hill S, Spindler J, Ferris AL, Mellors JW, Kearney MF, Coffin JM, Hughes SH. 2014. Specific HIV integration sites are linked to clonal expansion and persistence of infected cells. Science. 345: 179–183. - PMC - PubMed

Substances