. 2022 Mar 9;13(1):1233.
doi: 10.1038/s41467-022-28895-4.

A large and diverse autosomal haplotype is associated with sex-linked colour polymorphism in the guppy

Affiliations

A large and diverse autosomal haplotype is associated with sex-linked colour polymorphism in the guppy

Josephine R Paris et al. Nat Commun. .

Abstract

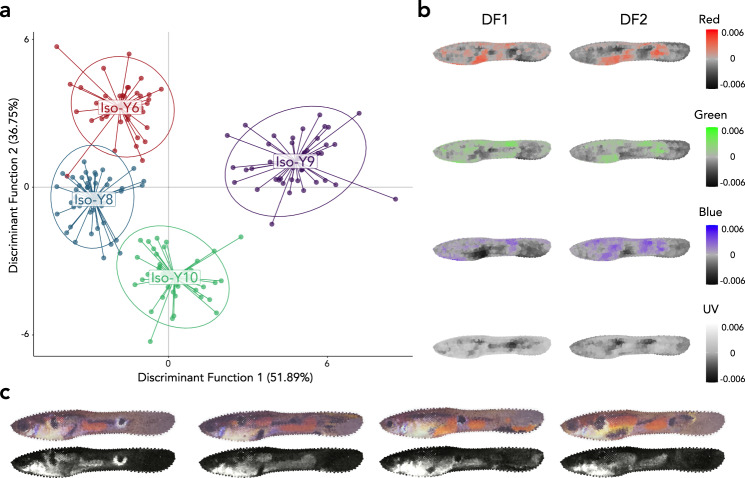
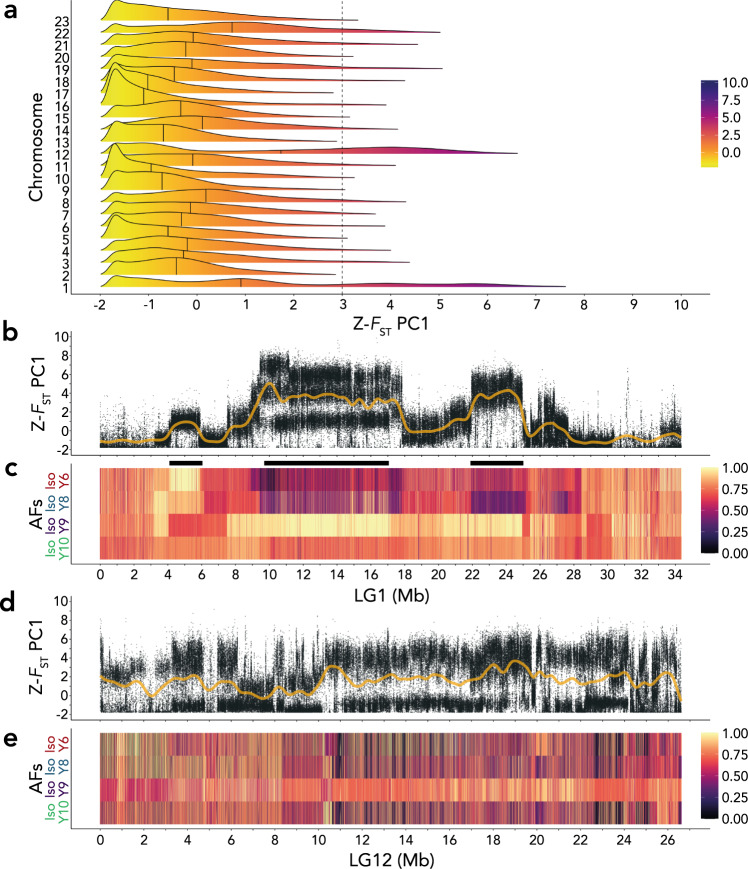
Male colour patterns of the Trinidadian guppy (Poecilia reticulata) are typified by extreme variation governed by both natural and sexual selection. Since guppy colour patterns are often inherited faithfully from fathers to sons, it has been hypothesised that many of the colour trait genes must be physically linked to sex determining loci as a 'supergene' on the sex chromosome. Here, we phenotype and genotype four guppy 'Iso-Y lines', where colour was inherited along the patriline for 40 generations. Using an unbiased phenotyping method, we confirm the breeding design was successful in creating four distinct colour patterns. We find that genetic differentiation among the Iso-Y lines is repeatedly associated with a diverse haplotype on an autosome (LG1), not the sex chromosome (LG12). Moreover, the LG1 haplotype exhibits elevated linkage disequilibrium and evidence of sex-specific diversity in the natural source population. We hypothesise that colour pattern polymorphism is driven by Y-autosome epistasis.


Conflict of interest statement

The authors declare no competing interests.

Figures

Fig. 1
Fig. 1. Discriminant analysis of principal components (DAPC) differentiating colour measurements among Iso-Y lines.
a Scatterplot of the first 2 Discriminant Functions: Discriminant Function 1 (DF1) and Discriminant Function 2 (DF2). Each point represents a male, and colour denotes the Iso-Y line. b Heatmaps for each colour channel depicting the correlation between colour at each sampling location for Discriminant Function 1 (DF1) or Discriminant Function 2 (DF2). c Images of the male closest to each Iso-Y line’s centroid, constructed from the Red Green Blue (RGB; top) and ultraviolet (UV; bottom) colour measurements at each sampling location. UV images are false colour, with lighter grey indicating higher UV reflectance. Source data underlying Fig. 1a are provided as a Source data file.
Fig. 2
Fig. 2. Genetic differentiation between the four Iso-Y lines: Iso-Y6; Iso-Y8; Iso-Y9; Iso-Y10.
a Density plots of the SNP distribution of Z-FST PC1 FST for each chromosome of the guppy genome (23 chromosomes). The colour scale represents the Z-FST scores as depicted in the legend (yellow: low-scoring SNPs; indigo: high-scoring SNPs). Black lines within each density curve mark the median value of each chromosome. Dashed x-axis intersect marks the upper 95% quantile of 3. b Per-SNP Z-FST PC1 scores for LG1; yellow line represents a smoothed spline of the data. c Allele frequency (AF) plots of LG1 for each Iso-Y line (Iso-Y6—red; Iso-Y8—blue; Iso-Y9—purple; Iso-Y10—green). AFs were polarised to the major allele of Iso-Y9. Changes in the AFs are represented by the colours depicted in the legend. On LG1, Change Point Detection (CPD) pinpointed three regions of consistent differentiation, which are indicated at the top by black rectangles: Region 1 (4–5.9 Mb); Region 2 (9.6–17 Mb); Region 3 (21.9–24.9 Mb). d Per-SNP Z-FST PC1 scores for LG12; yellow line represents a smoothed spline of the data. e Allele frequency (AF) plots of LG12 for each Iso-Y line. AFs were polarised to the major allele of Iso-Y9 and changes in the AFs are represented by the colours depicted in the legend. On LG12, Change Point Detection (CPD) did not uncover any consistent regions of differentiation between the Iso-Y lines. X ticks are displayed in Megabases (Mb). Source data underlying all components of Fig. 2 are provided as Source data files.
Fig. 3
Fig. 3. Schematic representation of the multiple bands of allele frequencies present in the Iso-Y Pool-seq data.
a AA represents homozygous, AB represents heterozygous, and BB represents homozygous alternative. b The ancestral A haplotype accumulates SNPs, differentiating it into two versions of the A haplotype: A1 and A2. The ‘Y’ shaped haplotype tree represents the predicted evolutionary relationships between the ‘A haplogroup’ composed of ancestral A, derived A1 and A2 haplotypes, and the ‘B haplotype’. Branch lengths represent evolutionary distance, and thus SNP count. We predict that Iso-Y9 is fixed for one of the derived A haplotypes. For illustration purposes, we have shown fixed allele frequencies (AFs) for the A1 haplotype. The remaining Iso-Y lines are all heterozygous with the AB genotype. There are no BB individuals. Individuals within the Iso-Y6, Iso-Y8 and Iso-Y10 pools have segregating A1 and A2 haplotypes, which when compared to Iso-Y9 A1 show multiple bands of AFs, as shown in the AF calculations in part (c). Due to the nature of Pool-seq, it is unclear what the actual genotypes are. We focus on providing an explanation of the bimodal peaks, but it is noteworthy that in Iso-Y9 there are many fixed sites, but also some ‘nearly fixed’ sites, which suggests some diversity also exists in the Iso-Y A1/A1 haplotype, which likely represents the trimodality of Iso-Y6, (i.e. further complexity in the A1/A1 haplotype that’s captured in comparisons with Iso-Y6). Refer to Supplementary Figs. 16 and 17 for further visualisation of the segregating AFs.
Fig. 4
Fig. 4. Analysis of LG1 and LG12 in the natural source population (nfemales = 16, nmales = 10).
a LG1 heatmap of patterns of linkage disequilibrium (LD) measured as R2. Amount of LD is shown by colour intensity as depicted in the legend (yellow: low LD; indigo: high LD). High LD is observed at coordinates: 11,114,772–15,890,374). b LG1 local PCA in 10 bp windows, depicting three significant multidimensional scales (MDS): MDS1 (yellow, coordinates: 11,216,906–15,375,083 bp); MDS2 (pink, coordinates: 11,430,012– 14,570,259 bp); MDS3 (purple, coordinates: 12,326,328–15,308,055 bp). c Intersex FST calculated in 1 kb windows across LG1. Dashed line marks the 95% quantiles. d Intersex Da calculated in 1 kb windows across LG1. Dashed lines mark the 5% and 95% quantiles. e LG12 heatmap of patterns of linkage disequilibrium (LD) measured as R2. Amount of LD is shown by colour intensity as depicted in the legend (yellow: low LD; indigo: high LD). High LD is observed between ~4.6–6 Mb and at the terminal region between ~23.8–25.3 Mb. f LG12 local PCA in 10 bp windows, depicting two significant multidimensional scales (MDS): MDS1 (yellow, coordinates: 21,913,633–25,664,533 bp); MDS2 (pink, coordinates: 5,608,703–7,063,435 bp). g Intersex FST calculated in 1 kb windows across LG12. Dashed line marks the 95% quantile. h Intersex Da calculated in 1 kb windows across LG12. Dashed lines mark the 5% and 95% quantiles. X ticks are displayed in Megabases (Mb). Source data underlying all components of Fig. 4 are provided as Source data files.
Fig. 5
Fig. 5. LG1 Region 2 haplotype structure.
a Genotype plot for Iso-Y lines and natural data combined showing the genotype of each SNP depicted as homozygous reference (HOM REF: yellow), heterozygous (HET: pink) or homozygous alternative (HOM ALT: purple); each individual is coloured by Iso-Y line, or by sex (females in purple, males in cyan). The bracket shows the heterozygous individuals used in the haplotype analysis in panel (b). b Haplotype plot of phased data for natural-derived heterozygous samples (ntotal = 9, nmales = 3, nfemales = 6) polarised to the Iso-Y9 haplotype (purple) and alternative haplotype (yellow). Symbols next to each of the individuals represent sex (females in purple, males in cyan). Breakpoints (BP) in the haplotype are identified when phases switch between purple and yellow. Dashed lines mark conserved BPs (≥2 individuals): BP1: 11.6 Mb (nfemales = 2); BP2: 11.7 Mb (nfemales = 3); BP3: 12.2 Mb (nfemales = 3, nmales = 1); BP4: 13.1 Mb (nfemales = 2, nmales = 2); BP5: 14.4 Mb (nfemales = 2); BP6: 15.4 Mb (nfemales = 2). Arrows at the bottom highlight the location of gene annotations for the region. Source data underlying all components of Fig. 5 are provided as Source data files.

References

    1. Bachtrog D. Y-chromosome evolution: emerging insights into processes of Y-chromosome degeneration. Nat. Rev. Genet. 2013;14:113–124. - PMC - PubMed
    1. Williams TM, Carroll SB. Genetic and molecular insights into the development and evolution of sexual dimorphism. Nat. Rev. Genet. 2009;10:797–804. - PubMed
    1. Connallon T, Clark AG. Sex linkage, sex-specific selection, and the role of recombination in the evolution of sexually dimorphic gene expression. Evolution. 2010;64:3417–3442. - PMC - PubMed
    1. Mckinnon JS, Pierotti MER. Colour polymorphism and correlated characters: genetic mechanisms and evolution. Mol. Ecol. 2010;19:5101–5125. - PubMed
    1. Svensson EI. Back to basics: using colour polymorphisms to study evolutionary processes. Mol. Ecol. 2017;26:2204–2211. - PubMed

Publication types