. 2022 Mar 9;13(1):1220.
doi: 10.1038/s41467-022-28905-5.

Autoantibodies targeting GPCRs and RAS-related molecules associate with COVID-19 severity

Affiliations

Autoantibodies targeting GPCRs and RAS-related molecules associate with COVID-19 severity

Otavio Cabral-Marques et al. Nat Commun. .

Abstract

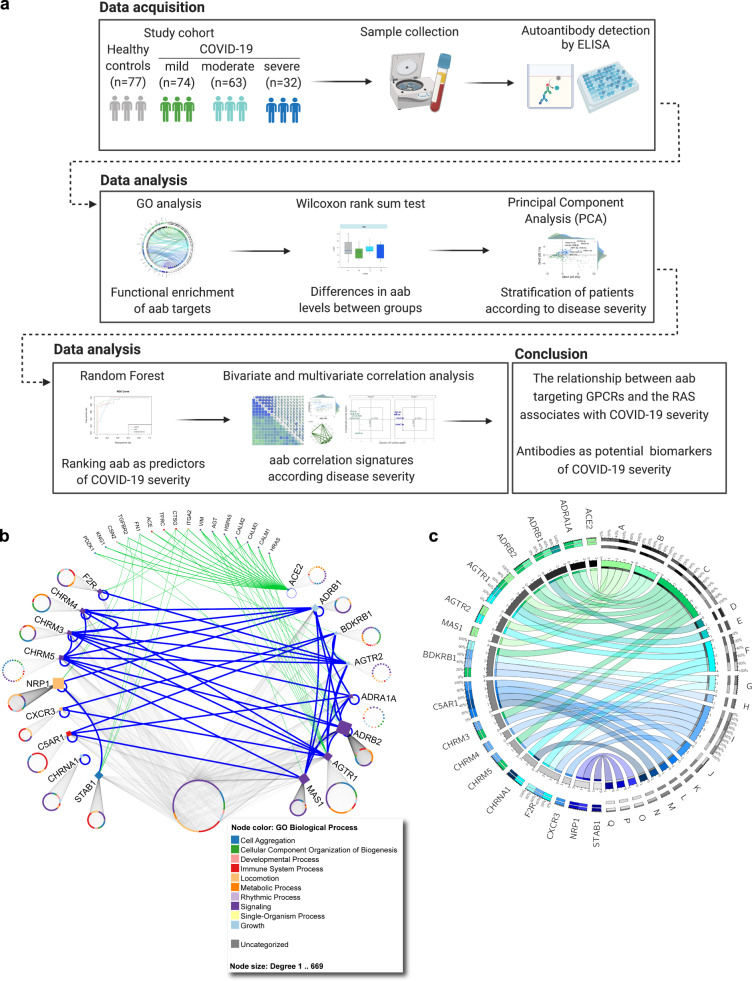
COVID-19 shares the feature of autoantibody production with systemic autoimmune diseases. In order to understand the role of these immune globulins in the pathogenesis of the disease, it is important to explore the autoantibody spectra. Here we show, by a cross-sectional study of 246 individuals, that autoantibodies targeting G protein-coupled receptors (GPCR) and RAS-related molecules associate with the clinical severity of COVID-19. Patients with moderate and severe disease are characterized by higher autoantibody levels than healthy controls and those with mild COVID-19 disease. Among the anti-GPCR autoantibodies, machine learning classification identifies the chemokine receptor CXCR3 and the RAS-related molecule AGTR1 as targets for antibodies with the strongest association to disease severity. Besides antibody levels, autoantibody network signatures are also changing in patients with intermediate or high disease severity. Although our current and previous studies identify anti-GPCR antibodies as natural components of human biology, their production is deregulated in COVID-19 and their level and pattern alterations might predict COVID-19 disease severity.


Conflict of interest statement

The authors declare that H.H. and K.S.F. are CellTrend managing directors and that GR is an advisor of CellTrend and earned an honorarium for her advice between 2011 and 2015. The other authors declare no competing interests.

Figures

Fig. 1
Fig. 1. Study workflow.
a After data acquisition, we carried out different statistical analyses (written on the top) to characterize the signature of autoantibodies against GPCRs and COVID-19-associated molecules (e.g., renin-angiotensin system) in COVID-19 patients when compared with healthy controls. Created with BioRender.com. b Interaction network of autoantibody targets: molecules belonging or influencing the RAS (on the right) as well as additional molecules (other GPCRs, NRP1, and STAB1; on the left). The network highlights interactions among the autoantibody targets (blue edges), ACE-2 interactors connecting to the other targets (green edges), and gene ontology (GO) biological processes (node color). The number of interacting partners for each target is proportional to the node size. The circles associated with each autoantibody target are formed by their interactors, whose names are omitted. c Circos plot illustrating the functional relationships between the antibody targets and biological processes as indicated by GO enriched processes, which are denoted by letters: A renin-angiotensin system, B adrenergic signaling in cardiomyocytes, C calcium signaling, D renin secretion, E GP130/JAK/STAT, F toll-like receptor signaling network, G complement and coagulation cascades, H inflammatory mediator regulation of TRP channels, I regulation of actin cytoskeleton, J inflammation mediated by chemokine and cytokine signaling, K immune system, L innate immune system, M neutrophil degranulation, N actions of nitric oxide in the heart, O human T-cell leukemia virus 1 infection, P VEGF and VEGFR signaling network, Q scavenging by class H receptors. The Circos plot shows only a few GO enriched processes; the complete list of relationships is provided in Supplementary Data 5. The size of the rectangles in the outer circles is proportional to the involvement of autoantibody targets in multiple pathways. The size of rectangles forming the inner circle represents genes and datasets with more connections to each other. Colors, numbers and percentages on the outer circles denote pleiotropy and gene-pathway associations. GO, gene ontology. Source data are provided as a Source Data file.
Fig. 2
Fig. 2. Autoantibodies against GPCRs and COVID-19-associated molecules are dysregulated during SARS-CoV-2 infection.
a and b Box plots of autoantibodies investigated in mild (n = 74), moderate (n = 63), and severe (n = 32) COVID-19 patients compared to healthy controls (n = 77): a autoantibodies against molecules belonging to or influencing the RAS; b autoantibodies targeting GPCRs and other molecules (NRP1-aab, and STAB1-aab). c Heatmap of −log10 p-value obtained from the comparisons of each COVID-19 group in relation to the control group. The bars aside the heatmap represent the sum of −log10 p-value. d Box plots of classical autoantibodies (antinuclear antibodies or ANAs; double-stranded DNA or dsDNA; and rheumatoid factor or RF) associated with autoimmune diseases. Each box plot shows the median with first and third interquartile range (IQR), whiskers representing minimum and maximum values within IQR, and individual data points. Significance was determined using two-sided Wilcoxon rank-sum tests and is indicated by asterisks (*p ≤ 0.05, **p ≤ 0.01, ***p ≤ 0.001, and ****p ≤ 0.0001). Source data are provided as a Source Data file.
Fig. 3
Fig. 3. Autoantibodies stratify COVID-19 patients by disease severity.
a Principal component analysis (PCA) with spectral decomposition based on 17 different anti-GPCR-autoantibodies show the stratification of moderate (n = 63) and severe (n = 32) COVID-19 patients from mild (n = 74) COVID-19 patients and healthy controls (n = 77). Variables with positive correlation point to the same side of the plot, contrasting with negatively correlated variables, which point to opposite sides. Only autoantibodies highly contributing to the stratification of moderate and severe COVID-19 patients from mild patients and healthy controls are shown. Small circles are concentration ellipses around the mean points of each group. Histograms aside the PCA represent the density of the sample (individual) distribution. b Graphs of variables (antibodies) obtained by PCA of COVID-19 mild, moderate and severe groups and healthy controls, indicating the autoantibodies highly associated with moderate and severe COVID-19. The color scale bar indicates the contribution of each autoantibody to the principal component (PC). c Biplot of individuals (dark gray dots: c control, Mo moderate; Mi mild; S severe) and variables (autoantibodies: blue names) of same groups as in (a). Individuals with a similar autoantibody profile are grouped together. Healthy controls n = 77; COVID-19 groups: mild n = 74, moderate n = 63, and severe n = 32. Source data are provided as a Source Data file.
Fig. 4
Fig. 4. Ranking autoantibodies as predictors of disease severity reveals an overlap between their patterns in moderate and severe COVID-19.
a Receiver operating characteristic (ROC) curves of 17 antibodies from mild (n = 74), moderate (n = 63), and severe (n = 32) COVID-19 patients versus healthy controls (n = 77) with an area under the curve (AUC) of 89.8% (for controls), 87.6% (for mild), 88,7% (for moderate), and 75.5% (for severe). b Stable curve showing number of trees and out-of-bag (OOB) error rate of 30.05%. c ROC curve of the same antibodies as in (a) from mild COVID-19 and moderate/severe COVID-19 patients compared to healthy controls with an AUC of 93.1% (for controls), 87.7% (for mild) and 96.2% (for moderate/severe). d Stable curve showing number of trees and OOB error rate of 22,95%. e Ranking of the top 10 autoantibody predictors of disease severity according to the mean minimal depth (black vertical bar with the mean value) calculated based on the number of trees. The blue color gradient reveals the minimum and maximum minimal depths for each variable. f Variable importance score plot based on Gini decrease and number (no.) of nodes for each variable showing which variable (antibody) presents a higher score in predicting COVID-19 severity. Source data are provided as a Source Data file.
Fig. 5
Fig. 5. Autoantibody correlation signatures associate with disease burden.
a Correlation matrices of autoantibodies targeting GPCRs and the RAS (denoted by numbers as per legend) for the control (n = 77) and COVID-19 groups (mild [n = 74], moderate [n = 63], and severe [n = 32]). The color scale bar represents the range of Spearman’s rank correlation coefficient. b Box plots ilustrating the correlation distribution of autoantibodies with significant changes (as defined in Supplementary Fig. 4) in pairwise correlations: those belonging to the RAS are placed in the upper row, and autoantibodies targeting other GPCRs are exhibited in the lower row. Antibodies with the highest or lowest correlations and thus contributing more to changes in the correlation pattern of the severe COVID-19 group are indicated. Each box plot shows the median with first and third interquartile range (IQR), whiskers representing minimum and maximum values within IQR, and individual data points. c Canonical-correlation analysis (CCA) of autoantibodies. Correlation between autoantibodies against molecules belonging to or influencing the RAS (dataset X, in green) versus the other autoantibodies (those targeting other GPCRs, NRP1, and STAB1; dataset Y, in blue). Only autoantibodies with Spearman’s rank correlation coefficient ≥ 0.6 are shown while those with a correlation coefficient < 0.6 (gray points) have their names omitted. Autoantibody correlations are plotted based on their relation to the first 2 canonical variates (x-CV1 and x-CV2; y-CV1 and y-CV2: ranging from −1 to 1). Autoantibodies located close in the same CCA quadrant region are those with the highest Spearman’s rank correlation coefficient. Source data are provided as a Source Data file.

References

    1. Khamsi R. Rogue antibodies could be driving severe COVID-19. Nature. 2021;590:29–31. - PubMed
    1. Ehrenfeld M, et al. Covid-19 and autoimmunity. Autoimmun. Rev. 2020;19:102597. - PMC - PubMed
    1. Lichtman AH. Anti-body antibodies in COVID-19. Sci. Immunol. 2021;6:eabj7173. - PubMed
    1. Dotan A, et al. The SARS-CoV-2 as an instrumental trigger of autoimmunity. Autoimmun. Rev. 2021;20:102792. - PMC - PubMed
    1. Halpert G, Shoenfeld Y. SARS-CoV-2, the autoimmune virus. Autoimmun. Rev. 2020;19:102695. - PMC - PubMed

Publication types