. 2022 Mar 9;13(1):1222.
doi: 10.1038/s41467-022-28729-3.

Elucidating mechanisms of genetic cross-disease associations at the PROCR vascular disease locus

Collaborators, Affiliations

Elucidating mechanisms of genetic cross-disease associations at the PROCR vascular disease locus

David Stacey et al. Nat Commun. .

Erratum in

  • Publisher Correction: Elucidating mechanisms of genetic cross-disease associations at the PROCR vascular disease locus.
    Stacey D, Chen L, Stanczyk PJ, Howson JMM, Mason AM, Burgess S, MacDonald S, Langdown J, McKinney H, Downes K, Farahi N, Peters JE, Basu S, Pankow JS, Tang W, Pankratz N, Sabater-Lleal M, de Vries PS, Smith NL; CHARGE Hemostasis Working Group; Gelinas AD, Schneider DJ, Janjic N, Samani NJ, Ye S, Summers C, Chilvers ER, Danesh J, Paul DS. Stacey D, et al. Nat Commun. 2022 Apr 6;13(1):1962. doi: 10.1038/s41467-022-29641-6. Nat Commun. 2022. PMID: 35388009 Free PMC article. No abstract available.

Abstract

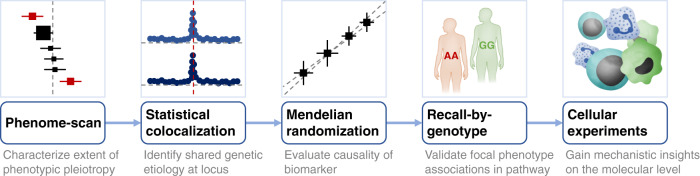
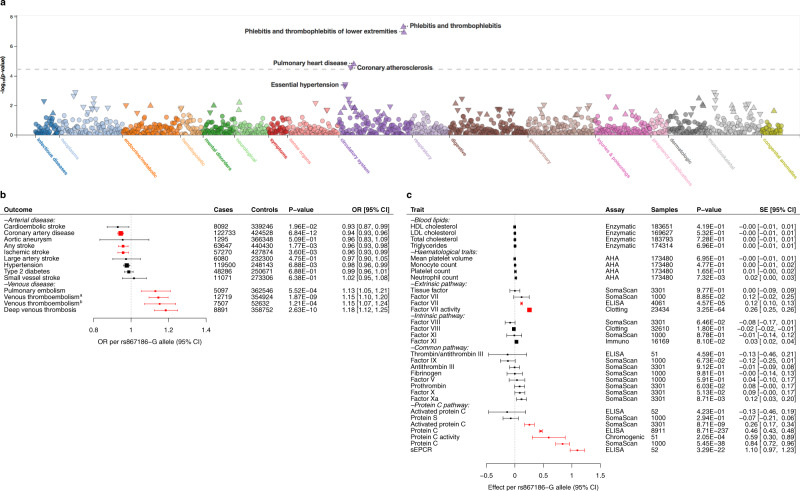
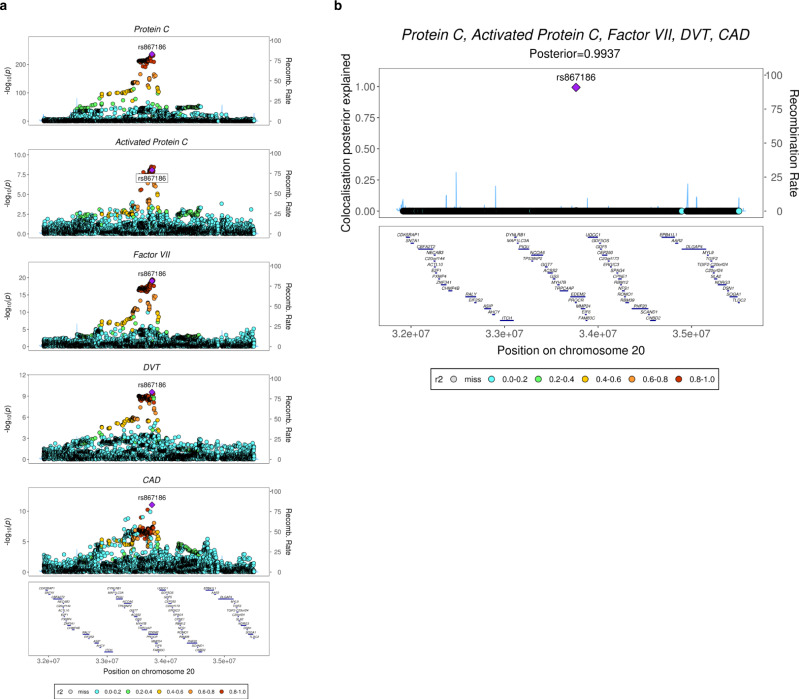
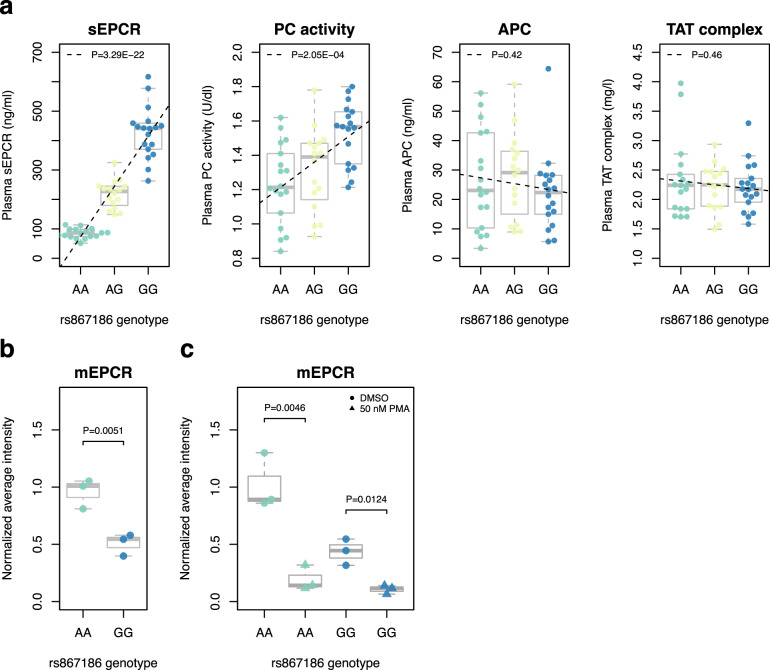
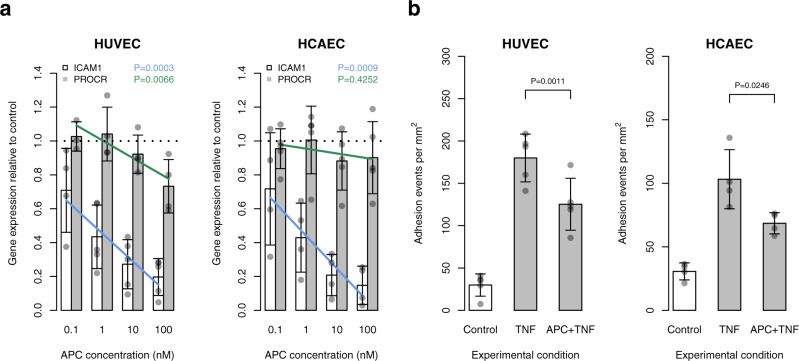
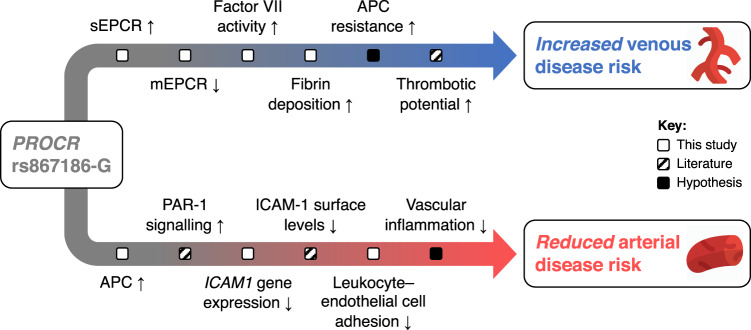
Many individual genetic risk loci have been associated with multiple common human diseases. However, the molecular basis of this pleiotropy often remains unclear. We present an integrative approach to reveal the molecular mechanism underlying the PROCR locus, associated with lower coronary artery disease (CAD) risk but higher venous thromboembolism (VTE) risk. We identify PROCR-p.Ser219Gly as the likely causal variant at the locus and protein C as a causal factor. Using genetic analyses, human recall-by-genotype and in vitro experimentation, we demonstrate that PROCR-219Gly increases plasma levels of (activated) protein C through endothelial protein C receptor (EPCR) ectodomain shedding in endothelial cells, attenuating leukocyte-endothelial cell adhesion and vascular inflammation. We also associate PROCR-219Gly with an increased pro-thrombotic state via coagulation factor VII, a ligand of EPCR. Our study, which links PROCR-219Gly to CAD through anti-inflammatory mechanisms and to VTE through pro-thrombotic mechanisms, provides a framework to reveal the mechanisms underlying similar cross-phenotype associations.


Conflict of interest statement

During the drafting of the manuscript, L.C. and J.M.M.H. became full-time employees of Novo Nordisk and D.S.P. became a full-time employee of AstraZeneca. J.E.P. has received travel and accommodation expenses and hospitality from Olink to speak at Olink-sponsored academic meetings. A.D.G., D.J.S. and N.J. are employees and stakeholders of SomaLogic. J.D. reports grants, personal fees and non-financial support from Merck Sharp & Dohme (MSD); grants, personal fees and non-financial support from Novartis; grants from Pfizer; and grants from AstraZeneca outside the submitted work. J.D. sits on the International Cardiovascular and Metabolic Advisory Board for Novartis (since 2010); the Steering Committee of UK Biobank (since 2011); the MRC International Advisory Group (ING) member, London (since 2013); the MRC High Throughput Science ‘Omics Panel Member, London (since 2013); the Scientific Advisory Committee for Sanofi (since 2013); the International Cardiovascular and Metabolism Research and Development Portfolio Committee for Novartis; and the AstraZeneca Genomics Advisory Board (2018). The remaining authors declare no competing interests.

Figures

Fig. 1
Fig. 1. Schematic overview of the study design to elucidate molecular underpinnings of cross-disease associations.
Credits: The immune response, Big Picture (https://www.stem.org.uk/rx34vg).
Fig. 2
Fig. 2. Association of PROCR-219Gly with a range of health outcomes and circulating cardiovascular biomarkers.
a Phenome-wide association scan of PROCR-p.S219G (rs867186) across 1402 broad electronic health record-derived ICD-codes from the UK Biobank. Unadjusted P values were obtained from the PheWeb portal. b Forest plot showing the associations of the minor (G) allele of rs867186 genotype with different cardiovascular conditions. Association statistics for VTE outcomes were obtained from the INVENT consortium (a) or UK Biobank (b). Data are presented as odds ratios with 95% confidence intervals (horizontal lines). Box sizes are proportional to inverse-variance weights. For each phenotypic subgroup, associations are ordered by their effect size. P values were obtained from the published GWAS. Associations that passed correction for multiple testing in this analysis (P = 0.05/13 traits = 3.85 × 10−3) are highlighted in red. The number of cases and controls for each association is shown in the forest plot. Supplementary Data 1 provides the association statistics for all traits, as well as data sources and references. c Forest plot showing the associations of rs867186-G with clinical biomarkers (blood lipids, hematological traits) and plasma proteins of the coagulation cascade (extrinsic, intrinsic and common pathways) and protein C pathways. Data are presented as per-allele changes in the traits expressed as standard deviations with 95% confidence intervals (horizontal lines). Box sizes are proportional to inverse-variance weights. For each phenotypic subgroup, associations are ordered by their effect size. P values were obtained from the published GWAS. Associations that passed correction for multiple testing in this analysis (P = 0.05/31 traits = 1.61 × 10−3) are highlighted in red. The number of participants for each association is shown in the forest plot. Supplementary Data 1 provides the association statistics for all traits, as well as data sources and references. Abbreviations: AHA automated hematology analyzer, ELISA enzyme-linked immunosorbent assay.
Fig. 3
Fig. 3. Statistical colocalization of cardiovascular outcomes and traits at the PROCR locus.
a Regional association plots at the PROCR gene locus, showing the genetic association with coagulation factor VII, protein C, activated protein C, DVT and CAD. Unadjusted P values were obtained from the published GWAS. Details about the statistical analysis and source of the data are given in the Methods section. Color key indicates r2 with the respective lead variants in the GWAS. b Plot showing the colocalization posterior probabilities explained by each of the genetic variants at the chr20q11.22 locus tested in the colocalization analysis.
Fig. 4
Fig. 4. Effect of rs867186 genotype on plasma biomarkers and EPCR expression on HUVECs.
a Boxplots showing the distribution of plasma biomarker levels as a function of rs867186 genotype in up to 52 individuals. We measured plasma levels of sEPCR (n = 52 individuals across the three genotypic groups), APC (n = 52) and TAT complex (n = 51) using immunoassays, and PC levels (n = 51) using a chromogenic assay. All measurements were done with three technical replicates. The boxplots show the interquartile range in the box with the median as a horizontal line. Whiskers extend to ±1.5 times the interquartile range. Dashed lines indicate the fitted linear regression model for biomarker~genotype. P values for the additive regression model are indicated. b Boxplots showing the distribution of EPCR levels on HUVECs homozygous for the rs867186-G-allele or A-allele (n = 3 cell lines per genotypic group). Data show mean fluorescence intensity values of EPCR on untreated HUVECs, normalized to mean fluorescence intensity values of homozygotes of the rs867186-A-allele. The boxplot shows the interquartile range in the box with the median as a horizontal line. Whiskers extend to ±1.5 times the interquartile range. P values were calculated using a one-tailed t-test. c Boxplots showing the distribution of EPCR levels on HUVECs homozygous for the rs867186-G-allele or A-allele (n = 3 cell lines per genotypic group). Data show mean fluorescence intensity values of EPCR on HUVECs simulated with DMSO (vehicle control) or 50 nM phorbol 12-myristate 13-acetate (PMA), normalized to mean fluorescence intensity values of homozygotes of the rs867186-A-allele. The boxplots show the interquartile range in the box with the median as a horizontal line. Whiskers extend to ±1.5 times the interquartile range. P values were calculated using a paired one-tailed t-test. All experiments were performed with three technical replicates per cell line. Membrane EPCR levels were quantified using flow cytometric analysis (Methods). Bold lines and boxes represent the median and interquartile range of the data, respectively.
Fig. 5
Fig. 5. Effect of APC on cell adhesion molecule expression and leukocyte–endothelial cell adhesion.
a Barplots showing gene expression levels of ICAM1 and PROCR in human umbilical vein endothelial cells (HUVECs) and human coronary artery endothelial cells (HCAECs) relative to the control condition (i.e., 0 nM APC; indicated with a dashed line). Cells were co-incubated with 1 ng/ml TNF-α and varying concentrations of APC (0, 0.1, 1, 10, 100 nM) for 24 h. Data are shown for n = 5 (ICAM1) and n = 4 (PROCR) biological replicates in HUVECs and n = 4 (ICAM1) and n = 5 (PROCR) biological replicates in HCAECs. Error bars show standard deviations of the means. The blue and green lines indicate the fitted linear regression model for gene expression level~log(APC concentration). P values for the F-test of the linear regression model are shown. For each biological replicate, three technical replicates were averaged. b Barplots showing mean cell adhesion events using static adhesion assays with PMA-stimulated monocytic cells (U937) and TNF-α-activated HUVECs or HCAECs. Cells were co-incubated with 1 ng/ml TNF-α and 100 nM APC for 24 h (Methods). Data are shown for n = 5 and n = 4 biological replicates in HUVECs and HCAECs, respectively. Error bars show standard deviations of the means. P values were calculated using paired one-tailed t-tests. For each biological replicate, 2–4 technical replicates were averaged.
Fig. 6
Fig. 6. Proposed molecular mechanism underlying the PROCR-p.S219G variant.
Credits: Icons were made by Pixel perfect from https://www.flaticon.com/.

Similar articles

Cited by

References

    1. Cortes A, Albers PK, Dendrou CA, Fugger L, McVean G. Identifying cross-disease components of genetic risk across hospital data in the UK Biobank. Nat. Genet. 2020;52:126–134. - PMC - PubMed
    1. Gupta RM, et al. A genetic variant associated with five vascular diseases is a distal regulator of endothelin-1 gene expression. Cell. 2017;170:522–533. - PMC - PubMed
    1. Howson JMM, et al. Fifteen new risk loci for coronary artery disease highlight arterial-wall-specific mechanisms. Nat. Genet. 2017;49:1113–1119. - PMC - PubMed
    1. van der Harst P, Verweij N. Identification of 64 novel genetic loci provides an expanded view on the genetic architecture of coronary artery disease. Circ. Res. 2018;122:433–443. - PMC - PubMed
    1. Medina P, et al. Endothelial protein C receptor polymorphisms and risk of myocardial infarction. Haematologica. 2008;93:1358–1363. - PubMed

MeSH terms

Grants and funding