. 2022 Mar 9;13(1):1225.
doi: 10.1038/s41467-022-28844-1.

Restoring nuclear entry of Sirtuin 2 in oligodendrocyte progenitor cells promotes remyelination during ageing

Affiliations

Restoring nuclear entry of Sirtuin 2 in oligodendrocyte progenitor cells promotes remyelination during ageing

Xiao-Ru Ma et al. Nat Commun. .

Abstract

The age-dependent decline in remyelination potential of the central nervous system during ageing is associated with a declined differentiation capacity of oligodendrocyte progenitor cells (OPCs). The molecular players that can enhance OPC differentiation or rejuvenate OPCs are unclear. Here we show that, in mouse OPCs, nuclear entry of SIRT2 is impaired and NAD+ levels are reduced during ageing. When we supplement β-nicotinamide mononucleotide (β-NMN), an NAD+ precursor, nuclear entry of SIRT2 in OPCs, OPC differentiation, and remyelination were rescued in aged animals. We show that the effects on myelination are mediated via the NAD+-SIRT2-H3K18Ac-ID4 axis, and SIRT2 is required for rejuvenating OPCs. Our results show that SIRT2 and NAD+ levels rescue the aged OPC differentiation potential to levels comparable to young age, providing potential targets to enhance remyelination during ageing.


Conflict of interest statement

The authors declare no competing interests.

Figures
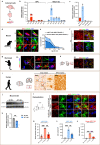
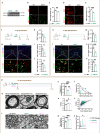
Fig. 1
Fig. 1. Nuclear entry of SIRT2 in OPCs during remyelination is impaired in the aged mice in vivo.
a Primary culture of various types of cells from P0 rat cortex. b qRT-PCR of seven members of sirtuins in primary cultured OPCs and mature oligodendrocytes from the cortex of P0 rat (n = 3). c qRT-PCR of sirt2 in primary cultured various types of cells from the cortex of P0 rat (n = 3). df Immunofluorescence and quantification of SIRT2+ cells in the cortex of mice at different ages (n = 3). Scale bar, 10 μm (d), 50 μm (upper panel images of f), 5 μm (lower panel images of f). gh Immunofluorescence of SIRT2 in the cortex of marmosets at postnatal day 3 (P3, g) or age of 8 years (h). Scale bar, 50 μm. i Immunohistochemistry of SIRT2 in the cortex of human at age of 53 years. Scale bar, 20 μm. j, k Relative SIRT2 protein level in brains of WT young (6 M) and old (18 M) mice (n = 3). lo Immunofluorescence and quantification of SIRT2+ OPCs and nuclear SIRT2+ OPCs in corpus callosum of WT young and old mice (n = 3). NL, non-lesion, L, demyelination lesion induced by LPC at 5 dpl. Scale bar, 10 μm. All data are presented as mean ± SEM. *p < 0.05, **p < 0.01, ***p < 0.001 by two-tailed t-test (k) or one-way ANOVA followed by Tukey’s post hoc test (mo). In all instances ***p  <  0.001. n.s. no significance. In (k), **p = 0.004; in (m), **p = 0.002 (L-Young vs. L-Old); in (n), **p = 0.007 (L-Young vs. L-Old).
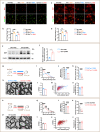
Fig. 2
Fig. 2. SIRT2 is critical for remyelination of the mice in vivo.
a SIRT2 protein level in brains of SIRT2−/− and WT mice (n = 3). be Images and quantification of proliferating OPCs (b, c, Olig2+Ki67+, n = 3) cultured for 36 h and differentiated oligodendrocytes (d, e, Olig2+MBP+, n = 3) cultured for 48 h. Scale bars, 50 μm. f Schematic diagram of the experiment for testing OPC proliferation in vivo at 5 dpl. gj Images and quantification of oligodendrocyte lineage cells (Olig2+) and proliferating OPCs (arrows, Ki67+Olig2+) within the demyelination lesions (dotted line) at 5 dpl (n = 5 for WT group, n = 4 for the SIRT2−/− group). Scale bar, 50 μm. k Schematic diagram of the experiment for testing OPC differentiation in vivo at 10 dpl. lo Images and quantification of oligodendrocyte lineage cells (Olig2+) and differentiated oligodendrocytes (arrows, CC1+Olig2+) within the demyelination lesions (dotted line) at 10 dpl (n = 4 for WT group, n = 5 for the SIRT2−/− group). Scale bar, 50 μm. p Experiment design for testing remyelination efficiency in vivo at 21 dpl. q TEM micrographs of normal myelinated, demyelinated and remyelinated axons. Scale bar, 200 nm. r TEM micrographs within the lesions at 21 dpl. Scale bar, 1 μm. sx Quantification of the proportion of remyelinated axons (s), myelin pathology level (t), G-Ratio average (u), individual G-Ratio distribution (v, linear regression) and distance between DL (w and x) within the lesions at 21 dpl (n = 6 for the WT young group, n = 5 for the SIRT2−/− group, n = 7 for the WT old group). All data are presented as mean ± SEM. The center, upper and lower line represent the median, upper and lower quartiles, respectively (x). *p < 0.05, **p < 0.01, ***p < 0.001 by two-tailed t-test (c, e, hj, mo) or one-way ANOVA followed by Tukey’s post hoc test (s, u, w, x) or two-way repeated ANOVA followed by Sidak’s post hoc test (t). In all instances ***p  <  0.001. n.s. no significance. In (c), **p = 0.006; in (i), *p = 0.03; in (j), *p = 0.01; in (o), **p = 0.005; in (s), **p = 0.001 (SIRT2−/− vs. WT Old); in (u), **p = 0.004 (WT Young vs. SIRT2−/−), *p = 0.02 (SIRT2−/− vs. WT Old); in (x), **p = 0.03 (WT Young vs. WT Old).
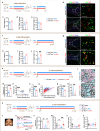
Fig. 3
Fig. 3. Elevating NAD+ by β-NMN enhances SIRT2 nuclear entry in OPCs of the aged mice within demyelination lesion in vivo.
a Schematic of OPC immunopanning protocol. b Heatmap of top 29 metabolites significantly different between the OPCs of WT and G3 Terc−/− mice (n = 3). c NAD+ levels in brain of WT and G3 Terc−/− mice (n = 4). d, e Volcano plot of 2585 proteins that are differentially expressed between rat OPCs treated with β-NMN or DMSO for 48 h (n = 3). β-NMN, 1 mM. f KEGG enrichment analysis of proteins upregulated by β-NMN in OPCs. g Relative mRNA levels of sirtuins in OPCs treated with β-NMN or DMSO for 48 h (n = 3). h β-NMN was once daily i.p. injected to G3 Terc−/− mice for 3 months. i NAD+ levels in brain of G3 Terc−/− mice (n = 4). j, k Relative SIRT2 protein level in brains of G3 Terc−/− mice (n = 5). ln Immunofluorescence and quantification of SIRT2+ OPCs in corpus callosum of G3 Terc−/− mice with or without demyelination (n = 5). NL, non-lesion, L, demyelination lesion induced by LPC at 5 dpl. Scale bar, 10 μm. All data are presented as mean ± SEM. *p < 0.05, **p < 0.01, ***p < 0.001 by two-tailed t-test (g, i, k), one-way ANOVA followed by Tukey’s post hoc test (c) or two-way repeated ANOVA followed by Sidak’s post hoc test (n). In all instances ***p  <  0.001. n.s. no significance. In (c), **p = 0.008 (WT 6 M vs. WT 15 M), **p = 0.001 (WT 6 M vs. G3 Terc−/−); in (g), *p = 0.03; in (i), **p = 0.0037; in (k), **p = 0.002; in (n), *p = 0.04 (NL).
Fig. 4
Fig. 4. Elevating NAD+ by β-NMN delays myelin ageing in the aged mice in vivo.
ad Images and quantification of proliferating OPCs (Olig2+Ki67+, n = 3) cultured for 36 h and differentiated oligodendrocytes (Olig2+MBP+, n = 3) cultured for 48 h. β-NMN, 1 mM. Scale bar, 50 μm. e, f Western blots of MBP in primary cultured rat OPCs treated with PBS or β-NMN for 48 h (n = 3). g β-NMN was once daily i.p. injected to G3 Terc−/− mice for 3 months. h TEM micrographs of myelin in corpus callosum of the brains of G3 Terc−/− mice. Scale bar: 500 nm. in Quantification of myelin pathology level (i), distance between DL (j, k), G-Ratio average (l), individual G-Ratio distribution (m, linear regression) and myelinated axons (n) in the corpus callosum of G3 Terc−/− mice brain (n = 5). o β-NMN was once daily i.p. injected to WT old mice for 3 months. p TEM micrographs of myelin in corpus callosum of the brains of WT old mice. Scale bar, 500 nm. qv Quantification of myelin pathology level (q), distance between DL (r, s), G-Ratio average (t), individual G-Ratio distribution (u, linear regression) and myelinated axons (v), in the corpus callosum of WT old mice brain (n = 5). All data are presented as mean ± SEM. The center, upper and lower line represent the median, upper and lower quartiles, respectively (k, s). *p < 0.05, **p < 0.01, ***p < 0.001 by two-tailed t-test (f, jl, n, rt, v) or two-way repeated ANOVA followed by Sidak’s post hoc test (i, q). In all instances ***p  <  0.001. n.s. no significance. In (b), **p = 0.009 (G3 Terc−/−+PBS vs. G3 Terc−/−+β-NMN); In (d), *p = 0.03 (WT + PBS vs. WT + β-NMN), **p = 0.004 (WT + PBS vs. G3 Terc−/−+PBS); In (f), *p = 0.01; In (q), **p = 0.005 (grade 1), *p = 0.02 (grade 2).
Fig. 5
Fig. 5. Elevating NAD+ by β-NMN enhances remyelination in the aged mice in vivo.
ae Images and quantification of oligodendrocyte lineage cells and proliferating OPCs within the demyelination lesions at 5 dpl (n = 5 for the G3 Terc−/−+PBS group, n = 4 for the G3 Terc−/−+β-NMN group). Scale bar, 50 μm. fj Images and quantification of oligodendrocyte lineage cells and differentiated oligodendrocytes within the demyelination lesions at 10 dpl (n = 4 for the G3 Terc−/−+PBS group, n = 5 for the G3 Terc−/−+β-NMN group). Scale bar, 50 μm. k, l TEM micrographs within the lesions at 21 dpl. Axons are coloured in pink for demyelinated ones whereas in blue for remyelinated ones. Scale bar, 1 μm. mr Quantification of the frequency of remyelinated axons (m), myelin pathology level (n), G-Ratio average (o), individual G-Ratio distribution (p, linear regression) and distance between DL (q, r) (n = 8). s Experiment design for functional remyelination efficiency. t 250 μm thick coronal brain slices contain the focal demyelination in corpus callosum. Estim., tungsten bipolar stimulation electrode; Prec., glass recording micropipette (electrode). u Representative CAPs recorded in corpus callosum. Fast velocity = δDistance/δT1; Slow velocity = δDistance/δT2; Amp 1, the fast phase amplitude; Amp 2, the slow phase amplitude. vy Quantification of the proportion of effective conduction (v), the ratio of Amp 1/Amp 2 (w, ratio of myelinated axons to unmyelinated axons), fast velocity (x, conduction velocity of myelinated axons) and slow velocity (y, conduction velocity of unmyelinated axons) of WT young (n = 5), WT old (n = 4), G3 Terc−/−+PBS (n = 5) and G3 Terc−/−+β-NMN (n = 6) mice. All data are presented as mean ± SEM. The center, upper and lower line represent the median, upper and lower quartiles, respectively (r). *p < 0.05, **p < 0.01, ***p < 0.001 by two-tailed t-test (ce, hj, m, o, q, r), one-way ANOVA followed by Tukey’s post hoc test (vy) or two-way repeated ANOVA followed by Sidak’s post hoc test (n). In all instances ***p < 0.001. n.s. no significance. In (j), **p = 0.0074; In (r), **p = 0.001; In (v), *p = 0.02 (WT Young vs. G3 Terc−/−+PBS), *p = 0.04 (G3 Terc−/−+β-NMN vs. G3 Terc−/−+PBS); In (w), *p = 0.03 (WT Young vs. G3 Terc−/−+PBS), **p = 0.002 (G3 Terc−/−+β-NMN vs. G3 Terc−/−+PBS).
Fig. 6
Fig. 6. The enhancing effect of β-NMN on remyelination of the mice requires SIRT2.
a Quantification of differentiated oligodendrocytes from P0 WT mice cultured for 48 h (n = 3). TM, Thiomyristoyl. be Images and quantification of proliferating OPCs (b, c) cultured for 36 h and differentiated oligodendrocytes (d, e) cultured for 48 h from P0 SIRT2−/− mice (n = 3). Scale bars, 50 μm. f Experiment design for testing the impact of β-NMN on OPC proliferation in vivo. gj Images and quantification of oligodendrocyte lineage cells and proliferating OPCs within the demyelination lesions at 5 dpl (n = 5). Scale bar, 50 μm. k Experiment design for testing the impact of β-NMN on OPC differentiation in vivo. lo Images and quantification of oligodendrocyte lineage cells and differentiated oligodendrocytes within the demyelination lesions at 10 dpl (n = 5). Scale bar, 50 μm. p Experiment design for testing the impact of β-NMN on remyelination efficiency in vivo at 21 dpl. q TEM micrographs within the lesions at 21 dpl. Scale bar, 1 μm. rw Quantification of the proportion of myelin pathology level (r), remyelinated axons (s), G-Ratio average (t), individual G-Ratio distribution (u, linear regression) and distance between DL (v, w) within the lesions at 21 dpl (n = 5). All data are presented as mean ± SEM. The center, upper and lower line represent the median, upper and lower quartiles, respectively (w). *p < 0.05, **p < 0.01, ***p < 0.001 by two-tailed t-test (c, e) or one-way ANOVA followed by Tukey’s post hoc test (a, hj, mo, s, t, v, w) or two-way repeated ANOVA followed by Sidak’s post hoc test (r). In all instances ***p  <  0.001. n.s. no significance. In (a), **p = 0.004 (DMSO vs. DMSO + β-NMN), **p = 0.002 (DMSO + β-NMN vs. β-NMN + 5 μM TM); In (n), *p = 0.02 (WT + PBS vs. WT + β-NMN); In (o), *p = 0.05 (WT + PBS vs. WT + β-NMN); In (r), *p = 0.02 (grade 2, WT + PBS vs. WT + β-NMN).
Fig. 7
Fig. 7. β-NMN induces the nuclear entry of SIRT2 and suppresses transcription of ID4, thus promoting OPC differentiation in vitro.
a Images of SIRT2 entry into the nucleus in primary cultured mouse OPCs. SIRT2 (red), DAPI (green). Scale bar, 20 μm for the upper panel, 10 μm for the lower panel. b Quantification of the proportion of SIRT2 entry into the nuclei (n = 3 for the DMSO group, n = 4 for the β-NMN group). c Quantification of the nucleus/total ratio of SIRT2 signal (n = 37 cells for the DMSO group, n = 36 cells for the β-NMN group). d Western blot of SIRT2 using nuclear and cytoplasmic fractionation of OLN93 cells treated with β-NMN or PBS. e Immunoblotting of SIRT2 and its possible downstream molecular targets (H3K18Ac, Ac-TubulinLys40 and H3K56Ac, H3 and Tubulin serve as internal reference) regulated by overexpression or knockdown of SIRT2 in OLN93 cell line. ctrl-flag: pCDH-EF1α-MCS-flag-P2A-copGFP, SIRT2-flag: pCDH-EF1α-SIRT2-flag-P2A-copGFP, shSIRT2: pGreenPuro-shSIRT2. f Relative mRNA level of ID4 in primary cultured OPCs of WT and G3 Terc−/− mice (n = 3). g, h Western blots of ID4 in primary cultures rat OPCs treated with DMSO or β-NMN for 48 h (n = 3). i Relative mRNA level of ID4 in primary cultured OPCs of WT and SIRT2−/− mice (n = 3). j Relative mRNA level of ID4 in the brains of WT and SIRT2−/− mice (n = 3). k Schematic of the protocol for ChIP-qPCR. l ChIP-qPCR assessment of the enrichment of SIRT2 at the promoter region of ID4 in OLN93 cell line knocking down or overexpressing SIRT2 (n = 3). m ChIP-qPCR assessment of the enrichment of H3K18Ac at the promoter region of ID4 in WT OLN93 cell line (n = 3). All data are presented as mean ± SEM. The center, upper and lower line represent the median, upper and lower quartiles, respectively (c). *p < 0.05, **p < 0.01, ***p < 0.001 by two-tailed t-test (b, hj), one-way ANOVA followed by Tukey’s post hoc test (f) or two-way repeated ANOVA followed by Sidak’s post hoc test (lm). In all instances ***p  <  0.001. n.s. no significance. In (b), *p = 0.0219, In (f), *p = 0.04 (WT vs. G3 Terc−/−), *p = 0.03 (G3 Terc−/− vs. G3 Terc−/−+β-NMN); In (h), **p = 0.03 (); In (i), **p = 0.007, In (j), **p = 0.0025.
Fig. 8
Fig. 8. A working model for NAD+ on rejuvenating the aged OPC.
NAD+ targets OPCs and restores SIRT2 nuclear localisation in aged OPCs and delays myelin ageing and enhances myelin repair following demyelination in the aged CNS.

References

    1. Tasaki I. The electro-saltatory transmission of the nerve impulse and the effect of narcosis upon the nerve fiber. Am. J. Physiol. 1939;127:211–227.
    1. Huxley AF, Stampfli R. Evidence for saltatory conduction in peripheral myelinated nerve fibres. J. Physiol. 1949;108:315–339. - PubMed
    1. Brown AM, Evans RD, Black J, Ransom BR. Schwann cell glycogen selectively supports myelinated axon function. Ann. Neurol. 2012;72:406–418. - PMC - PubMed
    1. Funfschilling U, et al. Glycolytic oligodendrocytes maintain myelin and long-term axonal integrity. Nature. 2012;485:517–521. - PMC - PubMed
    1. McKenzie IA, et al. Motor skill learning requires active central myelination. Science. 2014;346:318–322. - PMC - PubMed

Publication types