. 2022 Mar 9;13(1):1232.
doi: 10.1038/s41467-022-28861-0.

An enhancer variant at 16q22.1 predisposes to hepatocellular carcinoma via regulating PRMT7 expression

Affiliations

An enhancer variant at 16q22.1 predisposes to hepatocellular carcinoma via regulating PRMT7 expression

Ting Shen et al. Nat Commun. .

Abstract

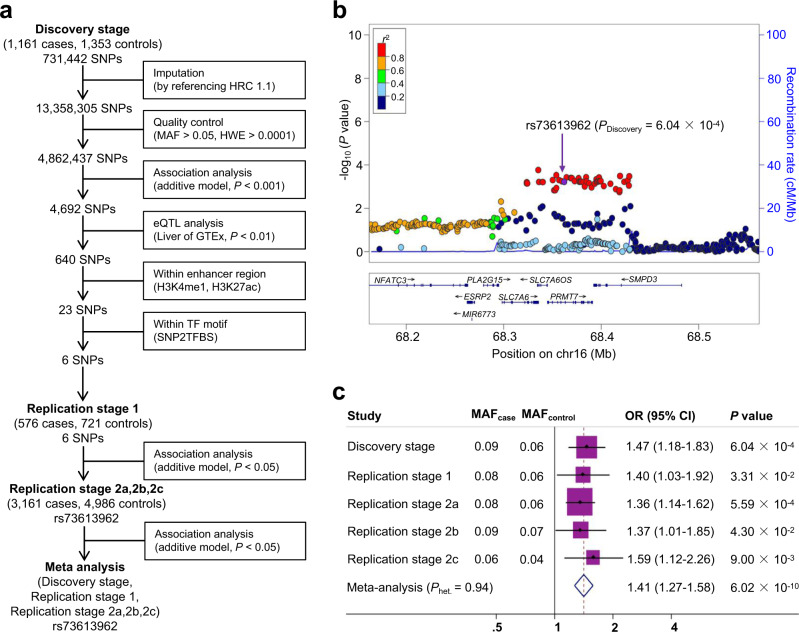
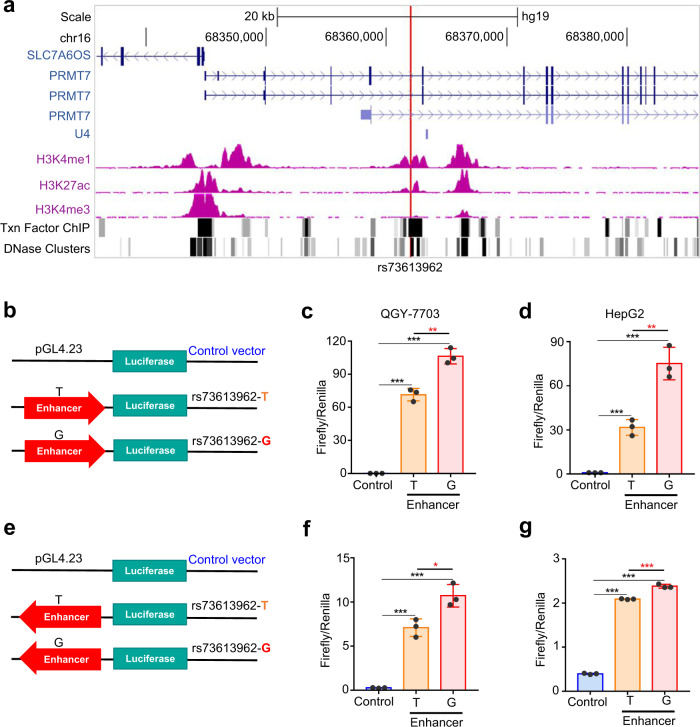
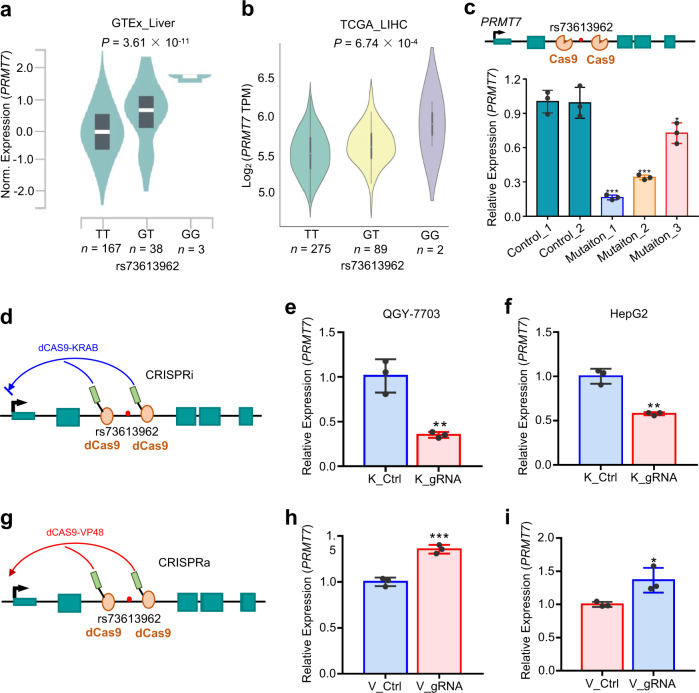
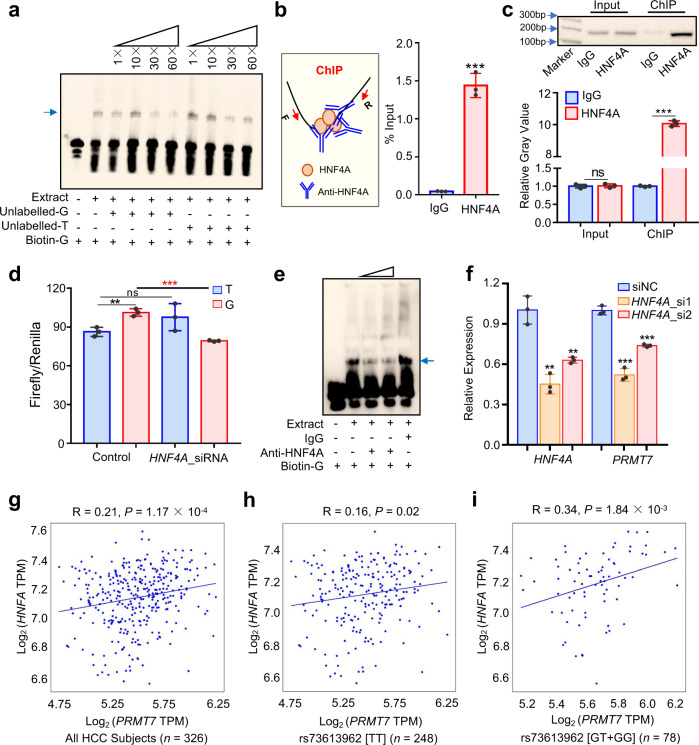
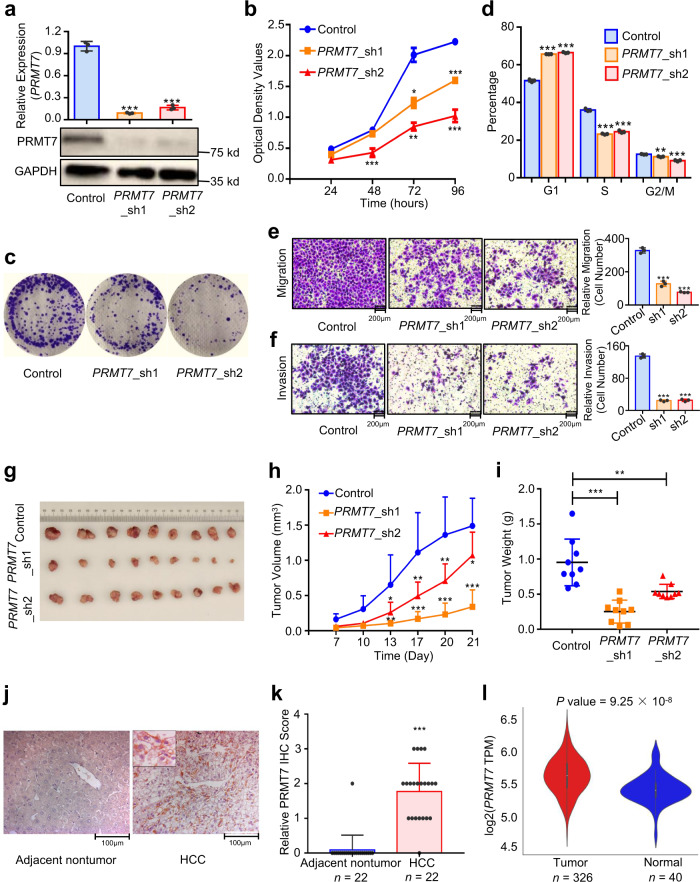
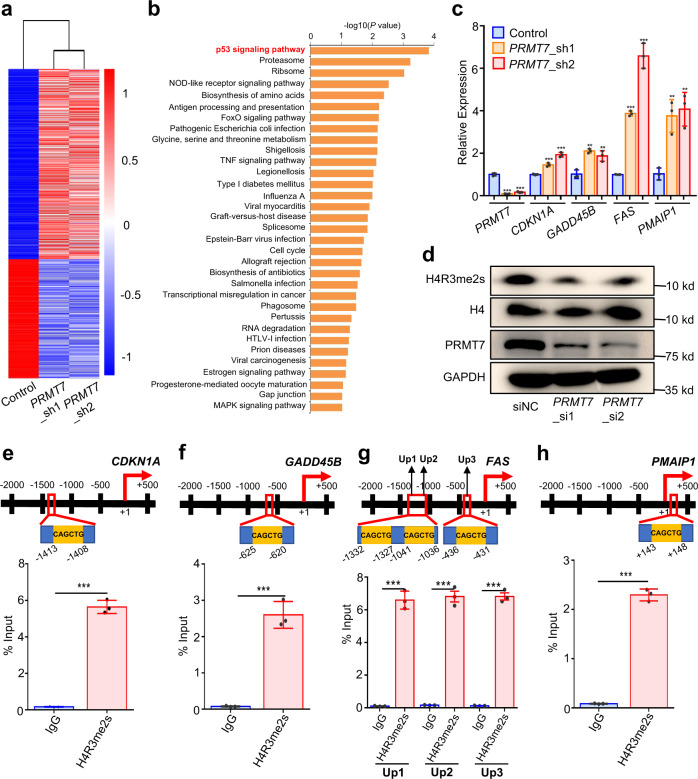
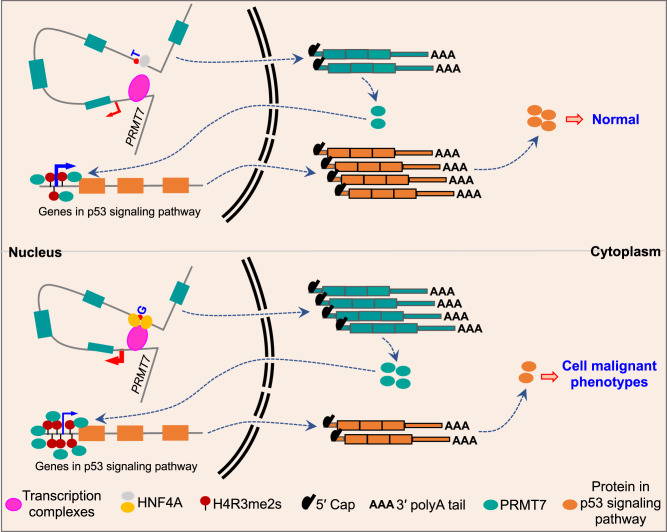
Most cancer causal variants are found in gene regulatory elements, e.g., enhancers. However, enhancer variants predisposing to hepatocellular carcinoma (HCC) remain unreported. Here we conduct a genome-wide survey of HCC-susceptible enhancer variants through a three-stage association study in 11,958 individuals and identify rs73613962 (T > G) within the intronic region of PRMT7 at 16q22.1 as a susceptibility locus of HCC (OR = 1.41, P = 6.02 × 10⁻¹⁰). An enhancer dual-luciferase assay indicates that the rs73613962-harboring region has allele-specific enhancer activity. CRISPR-Cas9/dCas9 experiments further support the enhancer activity of this region to regulate PRMT7 expression. Mechanistically, transcription factor HNF4A binds to this enhancer region, with preference to the risk allele G, to promote PRMT7 expression. PRMT7 upregulation contributes to in vitro, in vivo, and clinical HCC-associated phenotypes, possibly by affecting the p53 signaling pathway. This concept of HCC pathogenesis may open a promising window for HCC prevention/treatment.


Conflict of interest statement

The authors declare no competing interests.

Figures

Fig. 1
Fig. 1. A candidate enhancer variant rs73613962 is screened and validated to be significantly associated with HCC risk.
a Flowchart shows the candidate single-nucleotide polymorphisms (SNPs) in enhancers selected from the discovery stage and validated in two stages of replication. HRC Haplotype Reference Consortium, MAF minor allele frequency, HWE Hardy-Weinberg equilibrium, eQTL expression quantitative trait loci, TF transcription factor. b Regional association plot shows the association results (−log10 P) of all the SNPs in the region 100 kb upstream and 100 kb downstream of PRMT7 rs73613962 in Discovery stage (n = 1161 cases, n = 1353 controls). The association of each SNP with HCC risk was evaluated through logistic regression under an additive model adjusting for gender and age. As the index SNP, rs73613962 is shown in purple, and the r2 values of the remaining SNPs are indicated by color. The genes within the region are annotated and shown as arrows. c The meta forest plot shows the association results of rs73613962 in the five independent populations of the discovery stage, replication stage 1, and replication stages 2a, 2b, and 2c. The association of rs73613962 with HCC risk in each population was calculated through logistic regression under an additive model adjusting for gender and age. The MAFs in cases and controls are shown for each population. The ORs and 95% CIs were calculated by considering the major allele as a reference. The center of each square and the horizontal line show the OR and the corresponding 95% CI, respectively. The pooled OR was obtained using the fixed-effects model and is represented by a hollow diamond, where its center indicates the OR and its ends correspond to the 95% CI.
Fig. 2
Fig. 2. The rs73613962-containing region has an enhancer signal and allele-specific enhancer activity.
a Overview of the H3K4me1, H3K27ac, and H3K4me3 chromatin modifications, the binding sites of transcription factors (Txn Factor ChIP), and DNase cluster distribution in the regions surrounding rs73613962 of the HepG2 cell line supported from the UCSC genome browser. rs73613962 is indicated by the red vertical line. bg The dual-luciferase assays of enhancer activity for the empty vector (Control), and the plasmids with the insertion of the rs73613962-centered region (Enhancer-T and Enhancer-G). Luciferase activity is individually examined when the rs73613962-centered region is inserted in the luciferase vector in the forward (bd) or reverse orientation (eg). The assays are performed in two HCC cell lines, QGY-7703 (c, P < 0.0001 in Enhancer-T or Enhancer-G compared to Control, and P = 0.0026 in Enhancer-G compared to Enhancer-T; f, P = 0.0003 and P = 0.0001 in Enhancer-T or Enhancer-G compared to Control, and P = 0.0181 in Enhancer-G compared to Enhancer-T) and HepG2 (d, P = 0.0006 and P = 0.0003 in Enhancer-T or Enhancer-G compared to Control, and P = 0.0036 in Enhancer-G compared to Enhancer-T; g, P < 0.0001 in Enhancer-T or Enhancer-G compared to Control, and P = 0.0003 in Enhancer-G compared to Enhancer-T). Values are expressed as the mean ± SD, n = 3 in c, d, f, and g. ** and *** mean P-values less than 0.01 and 0.001, respectively (two-sided student’ t-test).
Fig. 3
Fig. 3. The enhancer variant rs73613962 modulates PRMT7 expression by regulating enhancer activity.
a, b The association between the genotypes of rs73613962 and PRMT7 expression through linear regression analysis in GTEx liver tissues (a, the center white line and the black box in the plot indicate the median and the first to third quartile, respectively) and TCGA LIHC (b, the center white dot, the black limit, and the whisker represent the median, the first to third quartile, and the 95% confidence interval, respectively). c Gene editing of the region surrounding rs73613962 by CRISPR-Cas9. The above panel shows the basic principle of the Cas9 assay. The Cas9 protein binds to the neighboring sequence of the rs73613962 site guided by small guide RNAs (sgRNAs) targeting the upstream and downstream of this locus to induce the double-stranded breaks of these regions in the PRMT7 gene. qPCR detection of relative PRMT7 expression upon the controls without any mutation in these regions (Control_1, 2), and the mutations being edited in these regions (Mutation_1, 2, 3) are shown in the bottom panel (P = 0.0001, P = 0.0003, and P = 0.0231 in Mutation_1, 2, or 3 compared to Control_1, respectively). d, g Illustration of the dCas9 assay. The above diagram shows the CRISPR-interference (CRISPRi) assay. DCas9-KRAB binds to the upstream and downstream of rs73613962 guided by sgRNAs to inhibit PRMT7 expression (d). The bottom diagram shows the CRISPR-activation (CRISPRa) assay to activate the expression of PRMT7 guided by sgRNAs (g). e, f RNA level of PRMT7 detected by qPCR in the CRISPRi assay in the QGY-7703 (e, P = 0.0038 in dCas9-KRAB_gRNA (K_gRNA) compared to dCas9-KRAB_Control (K_Ctrl)) and HepG2 (f, P = 0.0011 in K_gRNA compared to K_Ctrl) cell lines. h, i RNA level of PRMT7 detected by qPCR in the CRISPRa assay in the QGY-7703 (h, P = 0.0007 in dCAS9-VP48_gRNA (V_gRNA) compared to dCAS9-VP48_Control (V_Ctrl)) and HepG2 (i, P = 0.0300 in V_gRNA compared to V_Ctrl) cell lines. Values are expressed as the mean ± SD, n = 3 in c, e, f, h, and i. *, **, and *** mean P-values less than 0.05, 0.01, and 0.001, respectively (two-sided student’ t-test).
Fig. 4
Fig. 4. The risk allele G of rs73613962 enhances the binding ability of transcription factor HNF4A to promote PRMT7 expression.
a The result of the competitive EMSA. The binding affinity of protein to DNA oligos is demonstrated by adding unlabeled-G or unlabeled-T to the reaction. The light blue arrow indicates the protein-biotin-G-oligo complexes. This experiment is replicated two times at least and similar results are observed. b The enrichment of HNF4A on the rs73613962-containing region examined by ChIP. The left panel shows the diagram for HNF4A-ChIP. The antibody of HNF4A recognizes and binds to HNF4A; thus, the DNA sequence bound by HNF4A is pulled down from the fragmented chromatin. Then, the enriched DNA sequence is detected by the following qPCR as shown in the right panel. P = 0.0001 in HNF4A compared to IgG. c ChIP-PCR results. The agarose gel electrophoresis of PCR products for Input and ChIP, respectively, in the above panel. Light blue arrows indicate the marker bands. Source data are provided as a Source Data file. The relative gray value of each PCR band is analyzed using ImageJ in the bottom panel. P = 0.7769 and P < 0.0001 in HNF4A compared to IgG in Input and ChIP, respectively. d The dual-luciferase assay of enhancer activity for the enhancer-T and enhancer-G before and after the downregulation of HNF4A. P = 0.0046 in Enhancer-G compared to Enhancer-T without HNF4A knockdown, and P = 0.1493 and P = 0.0002 in Enhancer-T or Enhancer-G with HNF4A knockdown to Enhancer-T or Enhancer-G without HNF4A knockdown, respectively. e The result of the blocking EMSA of HNF4A. The amount of anti-HNF4A antibody in lane 3 and lane 4 is 1 μg and 2 μg, respectively. The IgG amount in lane 5 is 2 μg. The light blue arrow indicates the HNF4A-biotin-G-oligo complexes. We repeat this experiment two times at least and always observe the similar results. f qPCR detection of HNF4A and PRMT7 expressions after the downregulation of HNF4A in cells through two siRNAs. For detection of HNF4A expression level, P = 0.0017 and 0.0037 in HNF4A_small interfering RNA (HNF4A_si)1 or HNF4A_si2 compared to small interfering RNA negative control (siNC), respectively. For detection of PRMT7 expression level, P = 0.0001 and P = 0.0002 in HNF4A_si1 or HNF4A_si2 compared to siNC, respectively. All the above experiments were conducted in the QGY-7703 cell line (af). gi The correlation of PRMT7 and HNF4A expressions showed in all HCC subjects (g), and subjects with the rs73613962 TT homozygote (h), or rs73613962 G allele carriers (i) in TCGA LIHC. TPM, transcripts per million. Values are expressed as the mean ± SD, n = 3 in bd, and f. ‘ns’ means not significant; ** and *** mean P values less than 0.01, and 0.001, respectively (two-sided student’ t-test).
Fig. 5
Fig. 5. PRMT7 downregulation reduces cancer-related phenotypes, and PRMT7 is upregulated in HCC tumors.
a qPCR and western blot detection of RNA and protein abundance of PRMT7 after PRMT7 knockdown in cells by two shRNAs, respectively. P < 0.0001 in PRMT7_sh1 or PRMT7_sh2 compared to Control. Source data are provided as a Source Data file. b CCK-8 assay for PRMT7-depleted cells and the control. P < 0.0001 in PRMT7_sh1 or PRMT7_sh2 compared to Control at 96 h post-seeding. c Cell colony formation assay for cells with PRMT7 knockdown and the control. d Cell cycle analysis of the control and PRMT7-downregulated cells. P < 0.0001 in PRMT7_sh1 or PRMT7_sh2 compared to Control in G1 and S phase. P = 0.0019 and P = 0.0002 in PRMT7_sh1 or PRMT7_sh2 compared to Control in G2/M phase, respectively. e, f The detection of cell migration (e, P = 0.0001 and P < 0.0001 in PRMT7_sh1 or PRMT7_sh2 compared to Control) and invasion (f, P < 0.0001 in PRMT7_sh1 or PRMT7_sh2 compared to Control) abilities of cells with PRMT7 knockdown and the control. All the above experiments were conducted in the QGY-7703 cell line (af). gi Xenograft experiment for PRMT7 downregulation. The image (g), growth rate (h, P <0.0001 and P = 0.0263 in PRMT7_sh1 or PRMT7_sh2 compared to Control at 21 days after the injection of cells), and weight (i, P < 0.0001 and P = 0.0026 in PRMT7_sh1 or PRMT7_sh2 compared to Control) of the xenograft tumor are shown. j The IHC staining results of PRMT7 in adjacent non-tumor and HCC tissues. This staining is performed in 22 HCC patients with paired HCC tissues and non-tumor tissues. k The relative PRMT7 IHC score compared HCC tissues with adjacent non-tumor tissues. P < 0.0001 in HCC compared to adjacent non-tumor. l The expression of PRMT7 in tumor specimens and normal tissues of TCGA LIHC. Values are expressed as the mean ± SD, n = 3 in a, b, and df. Values are expressed as the mean + SD, n = 9 in h, n = 22 in k. Values are expressed as the median with interquartile range in i, n = 9. *, **, and *** mean P-values less than 0.05, 0.01, and 0.001, respectively (two-sided student’ t-test).
Fig. 6
Fig. 6. The p53 signaling pathway is regulated by PRMT7 in HCC cells.
a HeatMap of the differentially expressed genes was analyzed using RNA-seq data after PRMT7 knockdown in QGY-7703 cells. b Functional enrichment of the differentially expressed genes for KEGG was analyzed using DAVID bioinformatics resources. The p53 signaling pathway is highlighted in red. c qPCR detection of RNA level of four genes enriched in the p53 signaling pathway before and after PRMT7 knockdown in QGY-7703 cells, respectively. PRMT7, P < 0.0001; CDKN1A, P = 0.0009 and P = 0.0001; GADD45B, P = 0.0011 and P = 0.0093; FAS, P < 0.0001; PMAIP, P = 0.0046 and P = 0.0033, in PRMT7_sh1 or PRMT7_sh2 compared to Control. d Western blot detection of H4R3me2s signal in the control and PRMT7-downregulated samples in QGY-7703 cell line. Source data are provided as a Source Data file. This experiment is replicated two times at least and similar results are observed. eh The enrichment of H4R3me2s modification on the promoter region of four genes, CDKN1A (e), GADD45B (f), FAS (g), and PMAIP1 (h), in the p53 signaling pathway was detected by ChIP-qPCR. Up1, Up2, and Up3 are the three sequences with CAGCTG motif in the promoter region of FAS. P < 0.0001 in HNF4A compared to IgG in eh. Values are expressed as the mean ± SD, n = 3 in c and eh. *, **, and *** mean P-values less than 0.05, 0.01, and 0.001, respectively (two-sided student’ t-test).
Fig. 7
Fig. 7. Model for the functional mechanism of the HCC risk-associated enhancer variant rs73613962 in the intronic region of PRMT7.
The region containing the HCC susceptibility locus rs73613962 inside the intronic region of PRMT7 is identified as an enhancer that can regulate PRMT7 expression through the interaction with its promoter. Transcription factor HNF4A prefers to bind to the risk allele G over the non-risk allele T, which leads to the upregulated expression of PRMT7. Under this condition, the H4R3me2s modification on the promoter region of the genes in the p53 signaling pathway is elevated; thereby, the RNA and protein level is reduced. As a result, cells are induced to have enhanced malignant phenotypes, with higher proliferation rate and migration and invasion abilities.

Similar articles

Cited by

References

    1. Bray F, et al. Global cancer statistics 2018: GLOBOCAN estimates of incidence and mortality worldwide for 36 cancers in 185 countries. CA Cancer J. Clin. 2018;68:394–424. - PubMed
    1. Montalto G, et al. Epidemiology, risk factors, and natural history of hepatocellular carcinoma. Ann. N. Y Acad. Sci. 2002;963:13–20. - PubMed
    1. Zhang H, et al. Genome-wide association study identifies 1p36.22 as a new susceptibility locus for hepatocellular carcinoma in chronic hepatitis B virus carriers. Nat. Genet. 2010;42:755–758. - PubMed
    1. Li S, et al. GWAS identifies novel susceptibility loci on 6p21.32 and 21q21.3 for hepatocellular carcinoma in chronic hepatitis B virus carriers. PLoS Genet. 2012;8:e1002791. - PMC - PubMed
    1. Jiang DK, et al. Genetic variants in STAT4 and HLA-DQ genes confer risk of hepatitis B virus-related hepatocellular carcinoma. Nat. Genet. 2013;45:72–75. - PMC - PubMed

Publication types

MeSH terms

Substances