. 2022 Mar 9;13(1):1231.
doi: 10.1038/s41467-022-28188-w.

Rapid expansion and extinction of antibiotic resistance mutations during treatment of acute bacterial respiratory infections

Affiliations

Rapid expansion and extinction of antibiotic resistance mutations during treatment of acute bacterial respiratory infections

Hattie Chung et al. Nat Commun. .

Abstract

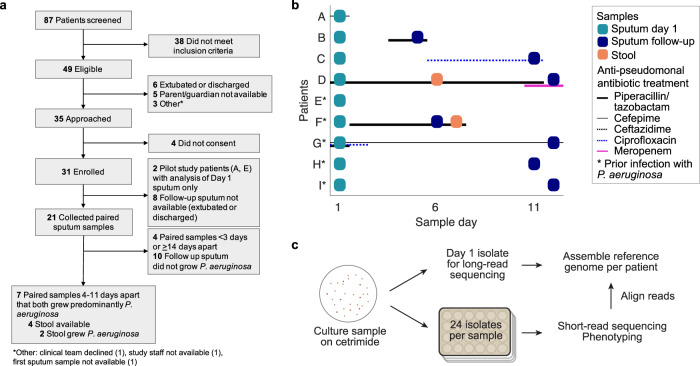
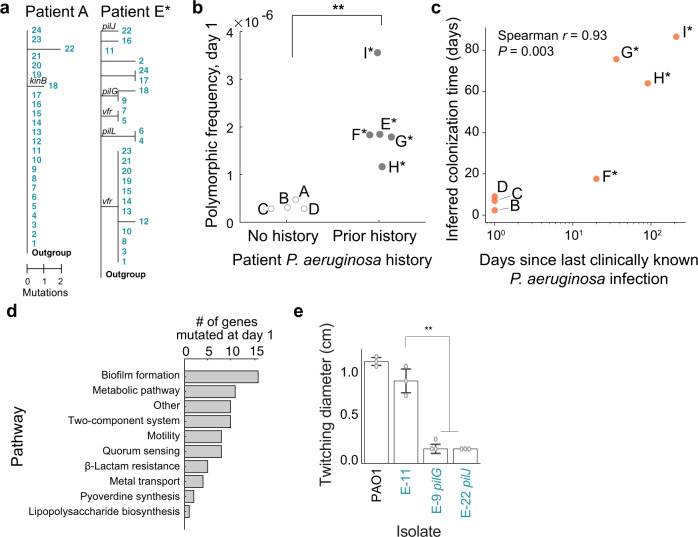
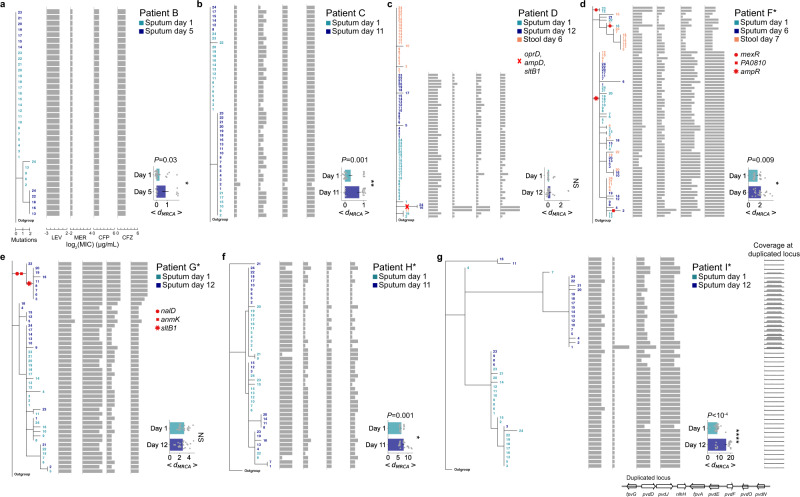
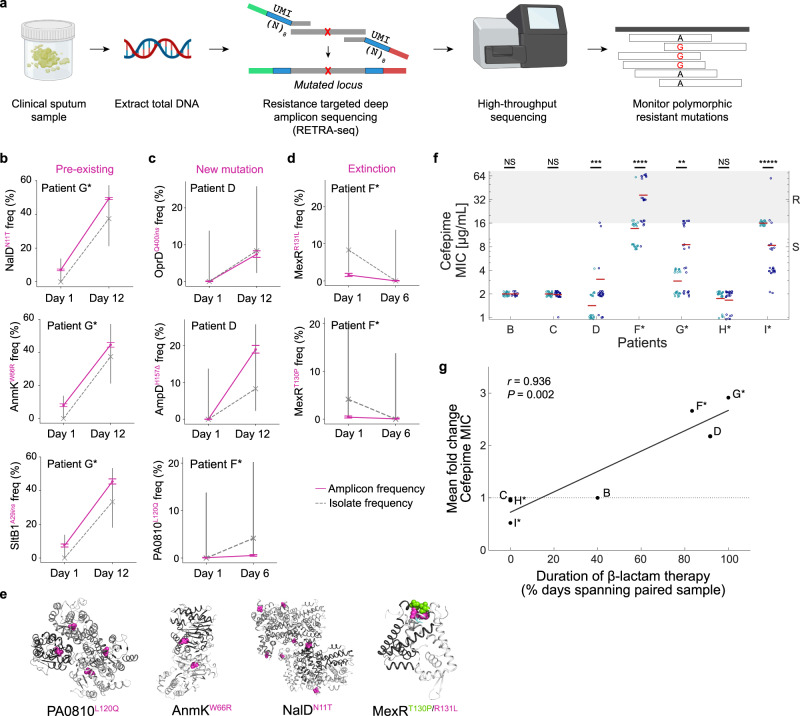
Acute bacterial infections are often treated empirically, with the choice of antibiotic therapy updated during treatment. The effects of such rapid antibiotic switching on the evolution of antibiotic resistance in individual patients are poorly understood. Here we find that low-frequency antibiotic resistance mutations emerge, contract, and even go to extinction within days of changes in therapy. We analyzed Pseudomonas aeruginosa populations in sputum samples collected serially from 7 mechanically ventilated patients at the onset of respiratory infection. Combining short- and long-read sequencing and resistance phenotyping of 420 isolates revealed that while new infections are near-clonal, reflecting a recent colonization bottleneck, resistance mutations could emerge at low frequencies within days of therapy. We then measured the in vivo frequencies of select resistance mutations in intact sputum samples with resistance-targeted deep amplicon sequencing (RETRA-Seq), which revealed that rare resistance mutations not detected by clinically used culture-based methods can increase by nearly 40-fold over 5-12 days in response to antibiotic changes. Conversely, mutations conferring resistance to antibiotics not administered diminish and even go to extinction. Our results underscore how therapy choice shapes the dynamics of low-frequency resistance mutations at short time scales, and the findings provide a possibility for driving resistance mutations to extinction during early stages of infection by designing patient-specific antibiotic cycling strategies informed by deep genomic surveillance.


Conflict of interest statement

H.C., M.M.S., R.K., and G.P.P. are co-inventors on a provisional patent application filed on RETRA-Seq.

Figures

Fig. 1
Fig. 1. Prospective study of P. aeruginosa populations from mechanically ventilated patients during acute respiratory tract infection.
a Prospective study design describing the enrollment strategy of mechanically ventilated patients in the ICU. Of 87 patients screened, 49 eligible patients were identified, from which 31 consented to enrollment. We focused on 2 pilot patients sampled at only day 1, and 7 patients sampled serially across 4–11 days that exhibited predominant P. aeruginosa growth in both samples. b Sampling sputum and stool across patients (y-axis) over time (x-axis) from the onset of symptoms. Day 1 sputum sample (teal box) were collected in all patients, and a follow-up sputum (dark blue box) were collected in 7 patients between day 5 and day 12, i.e. 4–11 days after day 1. Stool samples (brown box) with confirmed P. aeruginosa growth were collected in 2 patients. Asterisk: patients with prior P. aeruginosa infection. Treatment with anti-pseudomonal antibiotics are indicated by horizontal lines: piperacillin/tazobactam (weighted black), cefepime (thin black), ceftazidime (dotted black), ciprofloxacin (dotted blue), meropenem (weighted pink). c Samples (sputum or stool) were cultured on cetrimide agar in serial dilutions. A single isolate from day 1 sputum of each patient was used to construct a patient-specific reference genome using long-read sequencing. From each sample, 24 isolates were randomly selected for short-read whole-genome sequencing and phenotyping.
Fig. 2
Fig. 2. Patient infection history impacts genomic diversity of P. aeruginosa at the onset of infection.
a Phylogenetic trees of P. aeruginosa populations in pilot patients A and E* rooted with an Outgroup (Methods). Numbers (rows) correspond to tree leaves (teal) representing an isolate. Scale: mutational events (single nucleotide polymorphisms (SNPs) and indels) from the most recent common ancestor (MRCA) in each patient. Select branches are labeled with mutated genes. b Comparing the initial pathogen diversity of patients (dots) based on prior history of P. aeruginosa infection. Frequency of polymorphic loci (y-axis; calculated as number of unique SNP or indel positions divided by genome size) in patients with no prior P. aeruginosa history vs. in patients with clinically documented infection history (x-axis). Significance: P = 0.007, two-sided t-test. c Relation between the estimated colonization time of the pathogen in each patient (days, y-axis; Methods) and time to the last clinically documented infection (days, x-axis). Spearman correlation (two-sided), r = 0.93, P = 0.003. d Pathways (y-axis) found in mutations of coding regions at day 1 (x-axis) across all patients. e Altered twitching phenotype in isolates with single point mutations in genes of the pil locus. Isolates (x-axis) assayed for twitching diameter (cm, y-axis; Methods), from left to right: PAO1 reference strain, E-11 isogenic control, E-9 singleton pilG mutant, E-22 pilJ singleton mutant. Each assay was conducted across 3 technical replicates (dots), representative of 3 biologically independent replicates. Bars show median; error bars, standard error (s.e.). Significance: Tukey’s multiple comparisons test (E-11 vs. E-9, P = 0.001; E-11 vs. E-22, P = 0.001; adjusted P-values).
Fig. 3
Fig. 3. Phylogenetic analyses of P. aeruginosa populations within each patient and their corresponding antibiotic resistance profiles.
a–g Left: Phylogenetic trees of P. aeruginosa populations in serially sampled patients: patient B (a), patient C (b), patient D (c), patient F* (d), patient G* (e), patient H* (f), patient I* (g). Numbers (rows) correspond to tree leaves that represent an isolate (day 1 sputum in teal, follow-up sputum in dark blue, stool in brown). Scale: mutational events (single nucleotide polymorphisms (SNPs) and indels) from the most recent common ancestor (MRCA) in each patient. A subset of branches associated with antibiotic resistance are marked with red symbols. Middle: Antibiotic resistance profiles (horizontal gray bars) in units of minimum inhibitory concentration (log2(MIC); µg/mL) of individual isolates (rows) aligned to the isolate’s position on the tree, shown for levofloxacin (LEV), meropenem (MER), cefepime (CFP), and ceftazidime (CFZ). Right: distance to the MRCA (<dMRCA>, x-axis) of isolates (gray dots) at each time point (y-axis, days of infection). Mean (horizontal bars) and standard error (error bars) calculated over n = 24 biologically independent isolates per sputum or stool sample (exception: n = 12 isolates in Day 5 sputum of patient B (a)). Significance, one-tailed permutation test: P = 0.03 (a), P = 0.001 (b), P = 0.009 (d), P = 0.001 (f), P < 10−4 (g). NS not significant. g Far right, bottom: schematic showing the relative copy number (y-axis) of a ~34 kb duplicated chromosomal region (x-axis) that encodes, among others, genes of the pyoverdine pathway (bottom).
Fig. 4
Fig. 4. Treatment-associated dynamics of low-frequency resistance mutations.
a Workflow of resistance-targeted deep amplicon sequencing (RETRA-Seq) as a diagnostic for monitoring resistance mutation frequencies. Total DNA is extracted from clinical sputum and prepared as sequencing libraries via PCR using primers that contain sequencing adapters (green, red) and unique molecular identifiers (UMIs; blue) composed of 8 degenerate nucleotides (N). Amplicon libraries are sequenced on a next-generation sequencing platform and aligned to a reference genome to determine polymorphic frequencies. Images created with BioRender.com. bd Mutation frequencies (y-axis) across time (x-axis) of select resistance loci within each patient, measured by RETRA-Seq (solid pink) and by the fraction of culture-based isolates (dashed gray). Axis labels (y-axis) indicate the gene name and the mutation type (pink superscript): non-synonymous substitution, insertion (ins), or deletion (Δ). Error bars: Wilson Score interval of UMI counts (amplicon sequencing) or discrete counts (isolate sampling; Methods). Three types of changes in resistance frequencies: expansion of pre-existing mutations that were undetected by culture-based assay (b), expansion of presumed de novo mutations (c), and extinction of mutations (d). e Select non-synonymous mapped on protein structures of homologs of PA0810 (Protein Data Bank ID: 3UMC), AnmK (3QBW), NalD (5DAJ), and MexR (3ECH). Shades of gray indicate distinct monomers and pink/green spheres indicate mutated residues. f Distribution of cefepime MIC (µg/mL; y-axis) in individual isolates (dots) from day 1 (teal) and follow-up (dark blue) sputum samples, with mean value (horizontal read line). Ranges of resistance/intermediate susceptibility (R; gray) and sensitive (S; white) shown on the right and by background color, according to breakpoints defined by the Clinical Laboratory Standards Institute (CLSI). Significance (two-sided Mann–Whitney test): P = 7.5 × 10−4 (patient D), P = 2.2 × 10−5 (patient F), P = 0.004 (patient G), P < 10−5 (patient I). NS – not significant. g Relationship between cefepime resistance and clinical history of patient therapy. Fold change in mean cefepime MIC (y-axis) vs. the duration of β-lactam antibiotics administered to each patient during the study period (x-axis), shown for serially sampled patients (dots). Pearson’s correlation (two-sided), r = 0.936, P = 0.002.

References

    1. Levy SB, Marshall B. Antibacterial resistance worldwide: causes, challenges and responses. Nat. Med. 2004;10:S122–S129. - PubMed
    1. Lieberman TD, et al. Parallel bacterial evolution within multiple patients identifies candidate pathogenicity genes. Nat. Genet. 2011;43:1275–1280. - PMC - PubMed
    1. Lieberman TD, et al. Genetic variation of a bacterial pathogen within individuals with cystic fibrosis provides a record of selective pressures. Nat. Genet. 2014;46:82–87. - PMC - PubMed
    1. Markussen T, et al. Environmental heterogeneity drives within-host diversification and evolution of Pseudomonas aeruginosa. MBio. 2014;5:e01592–14. - PMC - PubMed
    1. Marvig RL, Sommer LM, Molin S, Johansen HK. Convergent evolution and adaptation of Pseudomonas aeruginosa within patients with cystic fibrosis. Nat. Genet. 2015;47:57–64. - PubMed

Publication types

MeSH terms

Substances