. 2022 Mar 9;13(1):1238.
doi: 10.1038/s41467-022-28908-2.

The flavonoid corylin exhibits lifespan extension properties in mouse

Affiliations

The flavonoid corylin exhibits lifespan extension properties in mouse

Tong-Hong Wang et al. Nat Commun. .

Abstract

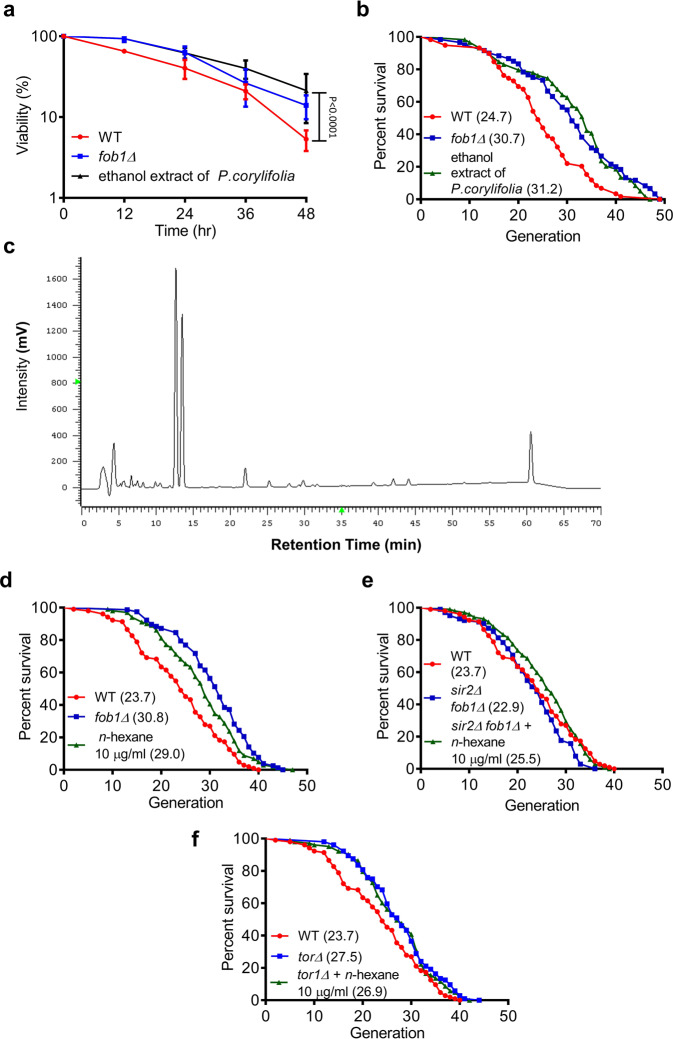
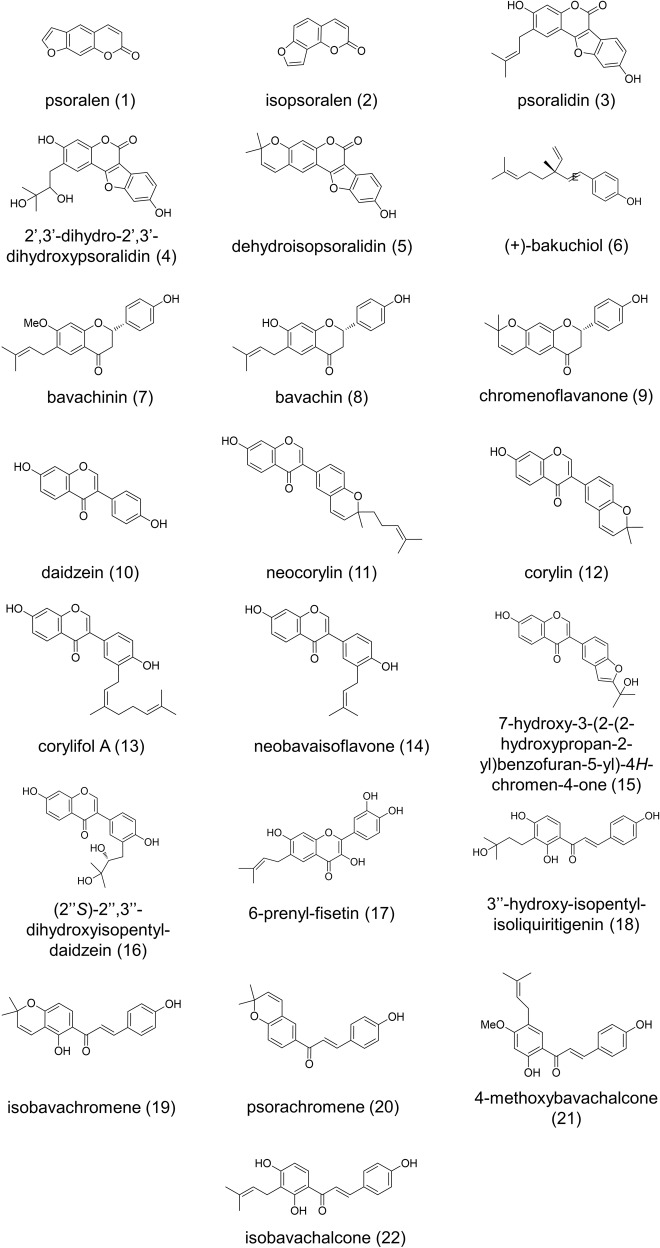
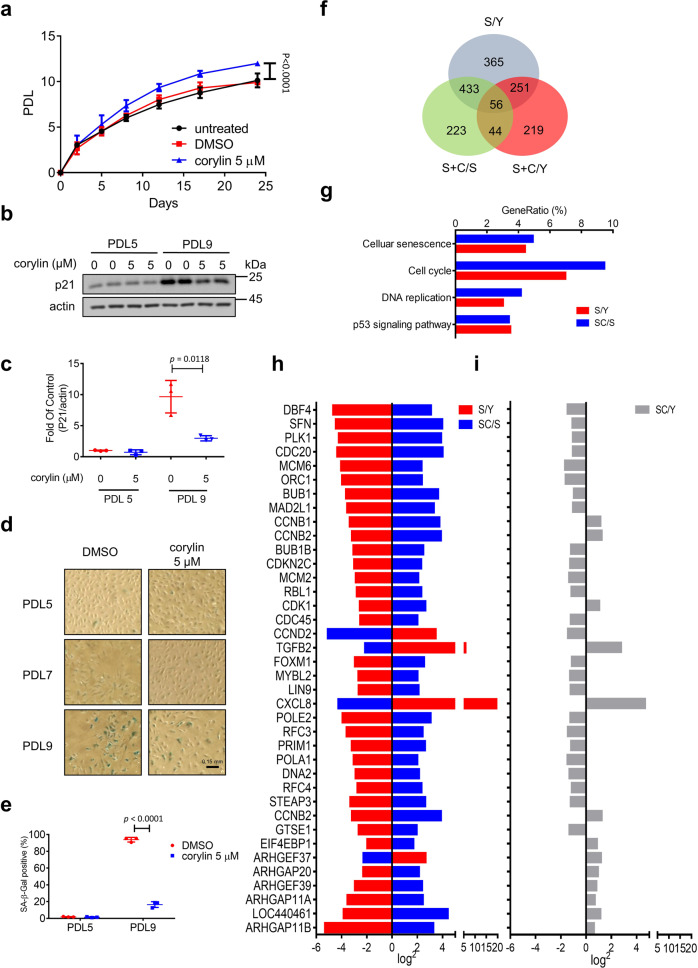
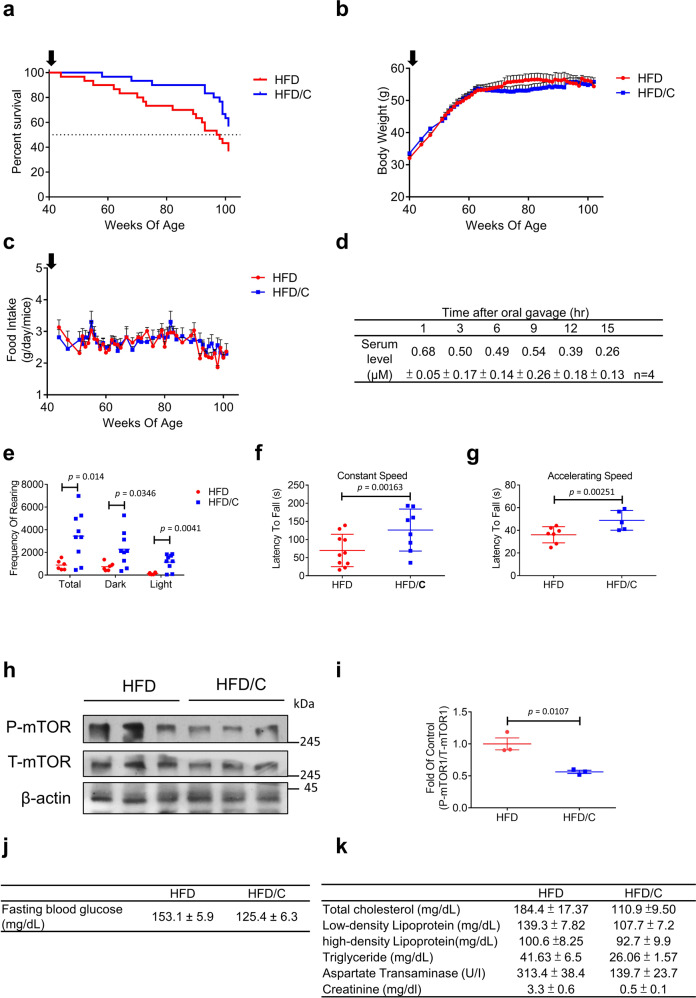
In the long history of traditional Chinese medicine, single herbs and complex formulas have been suggested to increase lifespan. However, the identification of single molecules responsible for lifespan extension has been challenging. Here, we collected a list of traditional Chinese medicines with potential longevity properties from pharmacopeias. By utilizing the mother enrichment program, we systematically screened these traditional Chinese medicines and identified a single herb, Psoralea corylifolia, that increases lifespan in Saccharomyces cerevisiae. Next, twenty-two pure compounds were isolated from Psoralea corylifolia. One of the compounds, corylin, was found to extend the replicative lifespan in yeast by targeting the Gtr1 protein. In human umbilical vein endothelial cells, RNA sequencing data showed that corylin ameliorates cellular senescence. We also examined an in vivo mammalian model, and found that corylin extends lifespan in mice fed a high-fat diet. Taken together, these findings suggest that corylin may promote longevity.


Conflict of interest statement

The authors declare no competing interests.

Figures

Fig. 1
Fig. 1. Ethanol extract of Psoralea corylifolia extends the replicative lifespan of Saccharomyces cerevisiae.
a Viability curve of the haploid MEP strain ZHY1 in liquid with a 10 μg/ml ethanol extract of P.corylifolia or DMSO, the mutation of fob1Δ is known to increase RLS (n = 3). b The RLS was determined by micromanipulating individual yeast cells on YEPD with or without the ethanol extract of P. corylifolia. The mean for WT = 24.7 generations (n = 59); fob1Δ = 30.7 generations (n = 60); and the P. corylifolia ethanol extract at 10 μg/ml = 31.2 generations (n = 59). c Column: MIGHTYSIL RP-18, 5 μm. Eluents: solvent A: 0.1% formic acid—acetonitrile and solvent B: 0.1% formic acid–water. Elution profile: 0–20 min, 60–50% B (40–50% A); 20–35 min, 50–40% B (50–60% A); 35–45 min, 40–30% B (60–70% A); 45–55 min, 30–20% B (70–80% A); 55–60 min, 60–50% B (40–50% A); 70 min, stop. Detection: UV at 245 nm. The RLS was determined by micromanipulating individual yeast cells on YEPD with or without the n-hexane extract of P. corylifolia. d The mean for WT = 23.7 generations (n = 104); fob1Δ = 30.8 generations (n = 78); and the n-hexane extract of P. corylifolia at 10 μg/ml = 29.0 generations (n = 96). e The mean for WT = 23.7 generations (n = 104); sir2Δ fob1Δ double deletion strain (sir2Δ fob1Δ) = 22.9 generations (n = 102); and sir2Δfob1Δ double deletion strain with the n-hexane extract of P. corylifolia at 10 μg/ml (sir2Δ fob1Δ+ n-hexane) = 25.5 generations (n = 102). f The mean for WT = 23.7 generations (n = 104); tor1Δ = 27.5 generations (n = 104); and tor1Δ with the n-hexane extract of P. corylifolia at 10 μg/ml (torΔ+ n-hexane) = 26.9 generations (n = 103). Data presented as mean ± SD from at least three biologically independent experiments. a p values were determined by two-way ANOVA (multiple comparisons). b, df p values were determined by the Gehan–Breslow–Wilcoxon test (see also Supplementary Fig. 14). Source data are provided as a Source data file.
Fig. 2
Fig. 2. Pure compounds isolated from the n-hexane extract of Psoralea corylifolia.
The compounds were classified according to their structure: coumarins (1–5), benzenoids (6) and flavonoids (7–22). The flavonoid group was further divided into four subgroups according to their structure: flavanones (7–9), isoflavones (10–16), flavonol (17) and chalcones (18–22). Source data are provided as a Source data file.
Fig. 3
Fig. 3. MEP assay of the pure compounds from the hexane extract of Psoralea corylifolia.
ai Visualization curve of haploid MEP strain ZHY1 in liquid YEPD containing (1) psoralen (n = 4), (2) isopsoralen (n = 4), (3) psoralidin (n = 5), (4) 2′,3′-dihydro-2′,3′-dihydroxypsoralidin (n = 5), (5) dehydroisopsoralidin (n = 7), (6) (+)-bakuchiol (n = 6), (7) bavachinin (n = 5), (8) bavachin (n = 5), (9) chromenoflavanone (n = 5), (10) daidzen (n = 6), (11) neocorylin (n = 6), (12) corylin (n = 6), (13) corylifol A (n = 6), (14) neobavaisoflavone (n = 5), (15) 7-hydroxy-3(2-(2-hydroxypropan-2-yl)benzofuran-5-yl)-4H-chromen-4-one (n = 6), (16) (2″S)-2″,3″-dihydroxyisopentyl-daidzein (n = 6), (17) 6-prenyl-fisetin (n = 6), (18) 3″-hydroxy-isopentyl-isoliquiritigenin (n = 3), (19) isobavachromene (n = 3), (20) psorachromene (n = 3), (21) 4-methoxybavachalcone (n = 5), and (22) isobavachalcone (n = 4). Cultures were incubated at 30 °C for 60 h. The viability is presented as CFUs per 500 μl, and this value was determined by harvesting samples at the indicated time points. Data presented as mean ± SD from at least three independent experiments. p values were determined by one-way ANOVA (multiple comparisons). Source data are provided as a Source data file.
Fig. 4
Fig. 4. Corylin extends the replicative lifespan by regulating Tor1 in Saccharomyces cerevisiae.
RLS were determined by micromanipulating individual yeast cells on YEPD with or without corylin. a The mean for WT = 26.4 generations (n = 65); fob1Δ = 30.5 generations (n = 43); 15 μM corylin = 31 generations (n = 66). b The mean for WT = 24.6 generations (n = 72); 15 μM corylin = 30.9 generations (n = 78); sir2Δ fob1Δ double deletion (sir2Δ fob1Δ) = 24.6 generations (n = 78); sir2Δ fob1Δ double deletion with corylin 15 μM (sir2Δ fob1Δ+ corylin) = 28.4 generations (n = 75). c The mean for WT = 25 generations (n = 97); 15 μM corylin = 29.4 generations (n = 77); tor1Δ deletion = 27.8 generations (n = 104); tor1Δ deletion plus 15 μM corylin (torΔ+ corylin) = 27.9 generations (n = 100) from at least three biologically independent experiments. d Msn2-GFP cells were treated with various concentrations of corylin and caloric restriction conditions (CR; 0.5 and 0.1%) for 1 h. cells were treated with various concentrations of corylin and CR conditions (0.1%) for 1 h. e Quantification of MSN2 (n = 5 biologically independent experiments). f Pnc1-GFP cells was performed by immunofluorescence microscopy. g Immunoblotting was performed using anti-GFP and anti-PGK1 antibodies The Pnc1-GFP expression level was normalized to PGK1 (n = 7 biologically independent experiments). h Intracellular NAD+ concentration was detected using the BY4741 strain with or without corylin and the CR condition (0.1%) for 2 h (n = 6 biologically independent experiments). i RLS were determined by micromanipulating individual yeast cells on YEPD with or without corylin. The mean for WT = 25 generations (n = 102); 15 μM corylin = 29.2 generations (n = 101); CR = 29 generations (n = 104); CR with 15 μM corylin (CR + corylin) = 28.5 generations (n = 99). Data presented as mean ± SD. ac, i, p values were determined by the Gehan–Breslow–Wilcoxon test (see also Supplementary Fig. 14); e, g, h, p values were determined by two-tailed unpaired Student’s t-test. Source data are provided as a Source data file.
Fig. 5
Fig. 5. Corylin docked with Gtr1 to inactivate the TOR1 pathway.
a A docking model of corylin in the N-terminal domain of Gtr1 shown as a ribbon (PDB ID: 3R7W). Ligand–protein interactions with the binding residues of Gtr1 (light gray) and corylin (blue). b Ligand–protein interactions with the binding residues of Gtr1 and corylin. The green dashed lines indicate hydrogen bonds and the pink dashed lines indicate π-interactions. c The peptide sequence for the chemical shift assay. d The Gtr1/Rag A sequence 159–180 in various species. e 1H NMR spectrum of peptide in the presence or absence of corylin. The arrows indicate the upfield chemical shift in the presence of corylin at a molar ratio of corylin and peptide of 1:1. f The RLS was determined by micromanipulating individual yeast cells on YEPD with or without corylin. The mean for WT = 24.3 generations (n = 77); 15 μM corylin = 29.7 generations (n = 75); gtr1Δ = 29.5 generations (n = 78); and gtr1Δ with 15 μM corylin (gtr1Δ+ corylin) = 29.5 generations (n = 78). g The mean for WT = 25 generations (n = 26); 30 μM corylin = 31.6 generations (n = 26); 60 μM corylin = 30.1 generations (n = 26); gtr1Δ = 29.8 generations (n = 26); gtr1Δ+ 30 μM corylin = 29.3 generations (n = 26); gtr1Δ+ 60 μM corylin = 29.7 generations (n = 26). h Immunoblotting was performed using anti-GFP and anti-PGK1 antibodies, and the pGAL-Gtr1 strain was cultured in YEPD and YEPG. i The RLS was determined by micromanipulating individual pGAL-Gtr1 yeast cells on YEPD with or without corylin. The mean for WT = 25.1 generations (n = 51); 15 μM corylin = 30.8 generations (n = 52); pGAL-GTR1 = 28.2 generations (n = 52); and pGAL-Gtr1 with 15 μM corylin (pGAL-Gtr1+ corylin) = 27.8 generations (n = 51). j pGAL-Gtr1 yeast cells were cultured on YEPG to conduct a micromanipulation assay. The mean for WT = 26 generations (n = 47); 15 μM corylin = 29.9 generations (n = 46); pGAL-Gtr1 = 24.7 generations (n = 51); and pGAL-Gtr1 with 15 μM corylin (pGAL-Gtr1 + corylin) = 25.2 generations (n = 51) from at least three biologically independent experiments. f, g, i, j, p values were determined by the Gehan–Breslow–Wilcoxon test (see also Supplementary Fig. 14). Source data are provided as a Source data file.
Fig. 6
Fig. 6. Corylin alleviates cellular senescence in HUVECs.
a Measurement of the proliferative capacity of cells cultured with or without corylin (5 μM). Cells were passaged at regular intervals and counted. Cell numbers were used to establish a growth curve, displaying cumulative population doublings. The population doubling level (PDL) of human umbilical vein endothelial cells (HUVECs) was assessed (n = 3 biologically independent experiments). b, c Cell lysates were prepared from different PDLs of HUVECs that were cultured with or without corylin, and immunoblotting was performed using anti-p21. Quantification was normalized with actin (n = 3 biologically independent experiments). d SA-β-GAL staining was performed at PDL 5, 7, and 9 to detect senescent cells (scale bar = 0.15 mm). e Quantification of senescence was performed by calculating the ratio of SA-β-gal-positive cells. At least 100 cells were calculated per group in the experiment (n = 3 biologically independent experiments). f The possible overlapping and nonoverlapping transcripts in three comparison groups. g KEGG was enriched in the shared senescence signatures between S/Y and SC/S (Y young cells, S senescence cells, SC senescence cells + corylin). h The shared senescence signatures between S/Y and SC/S. i SC/Y, involving the pathway from top to bottom, Senescence marker; cell cycle; DNA replication; p53 signaling pathway. Data presented as mean ± SD from at least 3 biologically independent experiments. a p values were determined by two-way ANOVA (multiple comparisons); c, e p values were determined by two-tailed unpaired Student’s t-test. Source data are provided as a Source data file.
Fig. 7
Fig. 7. Corylin prolongs lifespan in aged HFD-fed mice.
Forty-week-old male mice were fed a HFD with or without corylin treatment (n = 30 per group). a Survival curves of mice fed a HFD versus 1%(v/v) corylin (HFD/C) show a significant (Gehan–Breslow–Wilcoxon test χ2 = 4.887 and p = 0.0271) improving lifespan. b, c The bodyweight of mice after started fed with HFD or HFD/C and food consumption (The start point to fed corylin indicated by a black arrow, n = 30 at start point). d Circulating level of corylin (n = 4 biologically independent samples). e Rearing behavior was analyzed in obese mice fed a HFD with or without corylin for 35 weeks under dim and bright light conditions (HFD: n = 6; HFD/C n = 9 biologically independent animals). Latency to falling in the f constant rotarod and (HFD: n = 10; HFD/C: n = 8 biologically independent animals) g accelerating rotarod tests (HFD: n = 7; HFD/C: n = 5 biologically independent animals). h Western of total muscle for Phospho-mTOR Ser2448 (P-mTOR), total-mTOR (T-mTOR) and β-Actin (n = 3). i Quantification was normalized with T-mTOR (n = 3 biologically independent samples). j Fasting blood glucose level result (n = 9 biologically independent samples, p = 0.0058). k Serum biochemical marker results (n = 5 biologically independent samples, total cholesterol p = 0.0037, low-density lipoprotein p = 0.0151, triglyceride p = 0.0486, aspartate transaminase p = 0.0006, creatinine p < 0.0001). Values are expressed as the mean ± SEM. a p values were determined by the Gehan–Breslow–Wilcoxon test. eg, ik p values were determined by two-tailed unpaired Student’s t-test. Source data are provided as a source data file.

References

    1. Casella G, et al. Transcriptome signature of cellular senescence. Nucleic Acids Res. 2019;47:7294–7305. - PMC - PubMed
    1. Madeo F, et al. Caloric restriction mimetics against age-associated disease: targets, mechanisms, and therapeutic potential. Cell Metab. 2019;29:592–610. - PubMed
    1. Hatakeyama R, et al. Spatially distinct pools of TORC1 balance protein homeostasis. Mol. Cell. 2019;73:325–338.e8. - PubMed
    1. Saxton RA, Sabatini DM. mTOR signaling in growth, metabolism, and disease. Cell. 2017;168:960–976. - PMC - PubMed
    1. Tang BL. Sirt1 and the Mitochondria. Mol. Cells. 2016;39:87–95. - PMC - PubMed

Publication types