. 2022 Mar 9;12(1):3836.
doi: 10.1038/s41598-022-05837-0.

Normalization of clonal diversity in gene therapy studies using shape constrained splines

Affiliations

Normalization of clonal diversity in gene therapy studies using shape constrained splines

L Del Core et al. Sci Rep. .

Abstract

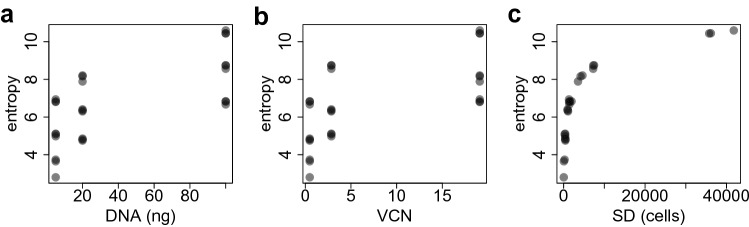
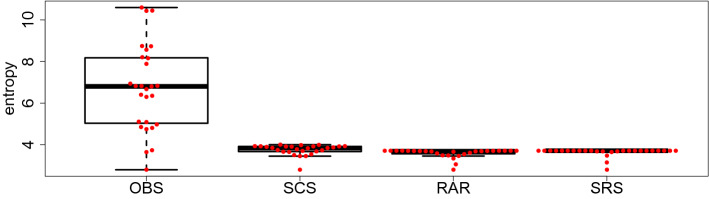
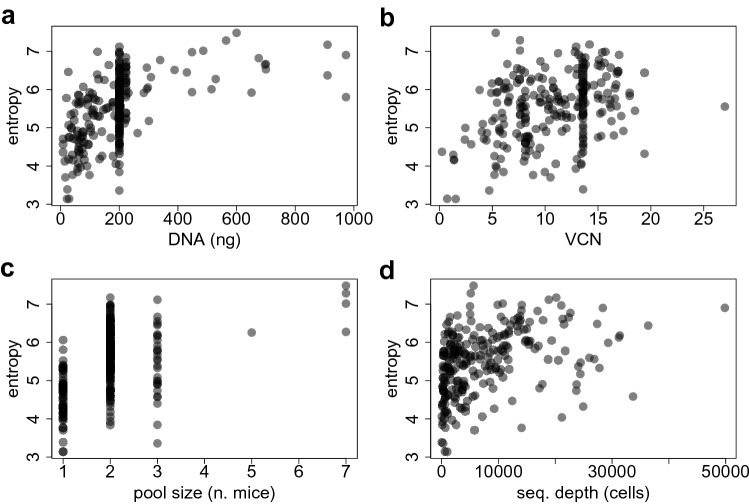
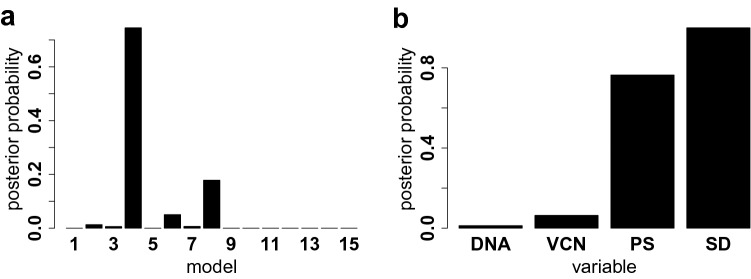
Viral vectors are used to insert genetic material into semirandom genomic positions of hematopoietic stem cells which, after reinfusion into patients, regenerate the entire hematopoietic system. Hematopoietic cells originating from genetically modified stem cells will harbor insertions in specific genomic positions called integration sites, which represent unique genetic marks of clonal identity. Therefore, the analysis of vector integration sites present in the genomic DNA of circulating cells allows to determine the number of clones in the blood ecosystem. Shannon diversity index is adopted to evaluate the heterogeneity of the transduced population of gene corrected cells. However, this measure can be affected by several technical variables such as the DNA amount used and the sequencing depth of the library analyzed and therefore the comparison across samples may be affected by these confounding factors. We developed an advanced spline-regression approach that leverages on confounding effects to provide a normalized entropy index. Our proposed method was first validated and compared with two state of the art approaches in a specifically designed in vitro assay. Subsequently our approach allowed to observe the expected impact of vector genotoxicity on entropy level decay in an in vivo model of hematopoietic stem cell gene therapy based on tumor prone mice.


Conflict of interest statement

The authors declare no competing interests.

Figures

Figure 1
Figure 1
From left to right: Scatter plot of the Shannon entropy index against the DNA amount, the vector copy number (VCN) and the sequencing depth (SD) for all the samples included in the in-vitro assay. Only a single amount of DNA has been taken for every sample. The total amount of integrations found in a sample, namely the total number of sample’s sequencing reads, has been used as proxy for the sample’s sequencing depth (SD).
Figure 2
Figure 2
Observed (left) and SCS-rescaled (right) entropies (dot symbols) as a function of the confounders, together with the corresponding shape constrained (bivariate) splines (green surface). Top panels show the slices for the DNA and the VCN. Bottom panels show the slices for the SD and the VCN.
Figure 3
Figure 3
Each panel shows the absolute value of the Spearman’s rank ρ correlation coefficient ρ(h,confounder) (y-axis) between a confounder and the observed or rescaled Shannon entropies (different bars). For every correlation coefficient, we performed the two-sided Spearman’s rank correlation test of Eq. (30) for checking the hypotheses H0:ρ(h,confounder)=0vsH1:ρ(h,confounder)0. The number of leading zeros after the decimal point of the p-values are reported on top of each bar as white stars.
Figure 4
Figure 4
Box-plot (minimum, maximum, median, first quartile and third quartile) of the observed (OBS) and rescaled Shannon entropies using the SCS, RAR and SRS approaches.
Figure 5
Figure 5
Observed Shannon entropies (y-axis) over time (x-axis) in each treatment (different colors), along with a simple spline without any shape constraints and confounder adjustments for every combination of cell marker and viral vector. Quadratic splines are fitted using the standard lm() and bs() R functions.
Figure 6
Figure 6
From top left to bottom right: Scatter plot of the raw (unscaled) Shannon entropy index computed from the entire dataset (n=242 IS samples) versus the DNA amount, the vector copy number(VCN), the pool size (PS) and the sequencing depth (SD).
Figure 7
Figure 7
Approximated posterior distribution distribution (left) of the 15 candidate models according to the frequentist model averaging method of Eqs. (24)–(25), and the marginal posterior probabilities of the 4 potential confounders (right).
Figure 8
Figure 8
Rescaled Shannon entropies (y-axis) over time (x-axis) for every combination of cell marker (panels) and viral vector treatment (colors) together with the corresponding SCS-fitted decay splines.

References

    1. Dunbar CE, High KA, Joung JK, Kohn DB, Ozawa K, Sadelain M. Gene therapy comes of age. Science. 2018;359(6372):eaan4672. - PubMed
    1. Aiuti A, et al. Lentiviral hematopoietic stem cell gene therapy in patients with Wiskott–Aldrich Syndrome. Science. 2013 doi: 10.1126/science.1233151. - DOI - PMC - PubMed
    1. Biffi A, et al. Lentiviral hematopoietic stem cell gene therapy benefits Metachromatic Leukodystrophy. Science. 2013 doi: 10.1126/science.1233158. - DOI - PubMed
    1. Cesana D, et al. Retrieval of vector integration sites from cell-free DNA. Nat. Med. 2021;27:1458–1470. - PubMed
    1. Kohn DB, et al. Lentiviral gene therapy for X-linked chronic granulomatous disease. Nat. Med. 2020;26(2):200–206. - PMC - PubMed

Publication types