. 2022 Mar 9;12(1):3816.
doi: 10.1038/s41598-022-06720-8.

Impact of urban structure on infectious disease spreading

Affiliations

Impact of urban structure on infectious disease spreading

Javier Aguilar et al. Sci Rep. .

Abstract

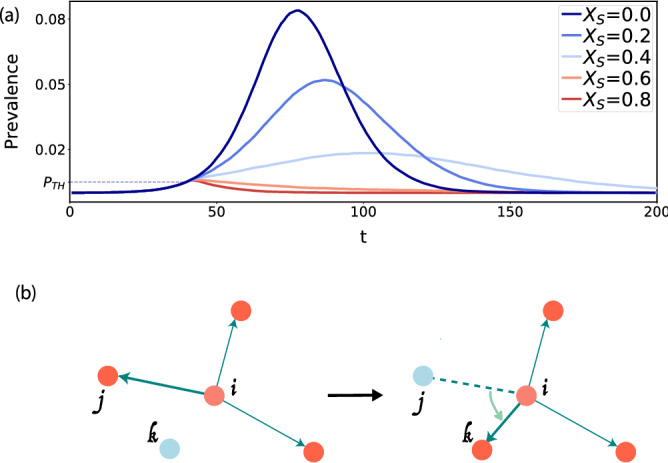
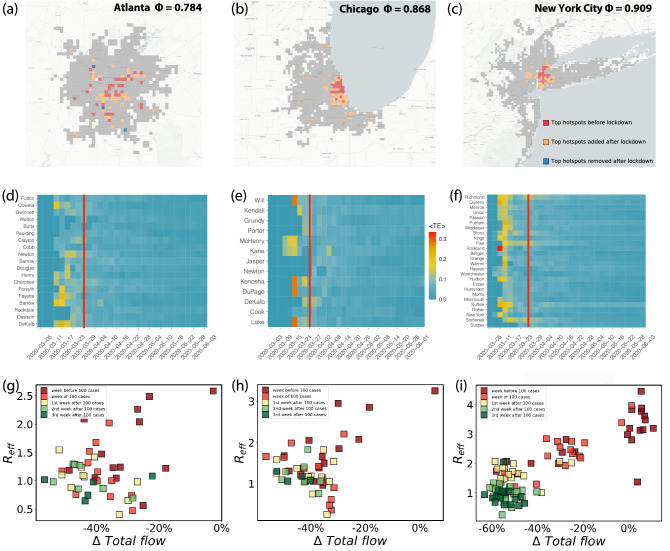
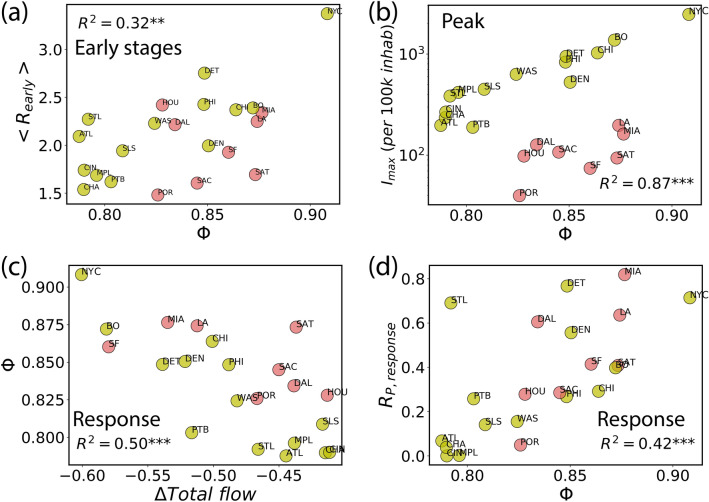
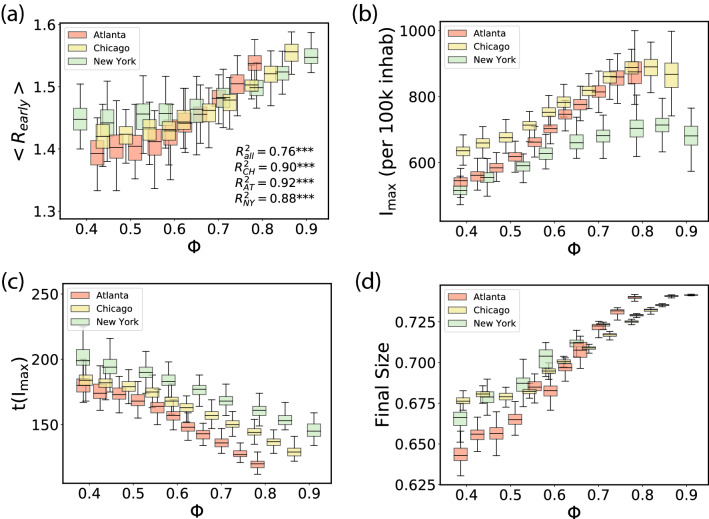
The ongoing SARS-CoV-2 pandemic has been holding the world hostage for several years now. Mobility is key to viral spreading and its restriction is the main non-pharmaceutical interventions to fight the virus expansion. Previous works have shown a connection between the structural organization of cities and the movement patterns of their residents. This puts urban centers in the focus of epidemic surveillance and interventions. Here we show that the organization of urban flows has a tremendous impact on disease spreading and on the amenability of different mitigation strategies. By studying anonymous and aggregated intra-urban flows in a variety of cities in the United States and other countries, and a combination of empirical analysis and analytical methods, we demonstrate that the response of cities to epidemic spreading can be roughly classified in two major types according to the overall organization of those flows. Hierarchical cities, where flows are concentrated primarily between mobility hotspots, are particularly vulnerable to the rapid spread of epidemics. Nevertheless, mobility restrictions in such types of cities are very effective in mitigating the spread of a virus. Conversely, in sprawled cities which present many centers of activity, the spread of an epidemic is much slower, but the response to mobility restrictions is much weaker and less effective. Investing resources on early monitoring and prompt ad-hoc interventions in more vulnerable cities may prove helpful in containing and reducing the impact of future pandemics.


Conflict of interest statement

The authors declare no competing interests.

Figures

Figure 1
Figure 1
Modeling disease spread in a city. In (a) representative prevalence curves for different values of XS, the fraction of susceptible individuals that do not participate in the infection process, mimicking the effect of isolation and stay-at-home orders. The curves show the case for the mobility in Atlanta at the resolution of S2 cells as geographical units. In (b) a sketch showing the reshuffling procedure to obtain different values of Φ
Figure 2
Figure 2
Types of cities and COVID-19 spreading. Maps with the changes in mobility hotspots before and after the lockdown in three cities with different mobility hierarchy (higher Φ indicates more hierarchical cities): (ac) Atlanta, Chicago and New York City, respectively, in the week of February 2 for pre-lockdown mobility and the week April 5 for the post-lockdown. (df) The average Transfer Entropy TE, capturing the influence of an administrative division (county) to drive infection-spread as a function of time. Vertical red lines mark the date of the official lockdown. After lockdown, the ability of a single region to drive infection spread dissipates, and the transmission evolves independently in each area. (gi) The temporal evolution of the effective reproduction number before and after lockdown versus the mobility change one week before Reff is measured. Each symbol represents a county of the city. While sprawled cities like Atlanta have regions responding independently, in centralized New York City, we see a clear synchronized and monotonically decreasing reduction in Reff as a function of mobility reduction.
Figure 3
Figure 3
Connecting hierarchy with epidemic features and mitigation efforts. Shown are the 22 cities in the United States, as of June 14, 2020 in terms of the pandemic situation. Cities in pale yellow have already peaked, while infections continue to grow in those marked in red. The figure suggests the extent of spread is strongly correlated with centralization. (a) Average observed Reff over three weeks after the onset of 100 cases as a function of Φ, namely Rearly. Initial observed transmission increased with centralization. (b) Accumulated number of reported new cases per capita two weeks before the maximum incidence Imax. In (c), Φ versus observed relative decrease in total flow. Mobility reductions were much more drastic in hierarchical cities. (d) Synchronization of mobility reduction and contagion spread among city counties measured through the Pearson coefficient of plots as those shown in Fig. 2g–i for Atlanta, Chicago and NYC. Response to mitigation was more sensitive in cities with higher Φ.
Figure 4
Figure 4
Spreading by type of city. Simulations are run in each city with different values of Φ, obtained by the randomization procedure described in the text. Each box reflects 100 runs and displays the median, quartiles, the 5% and 95% confidence intervals. In (a), Rearly (obtained over three weeks after the onset of 104 cases) as a function of Φ, as in Fig. 3a. The peak incidence Imax is shown in (b), the time to the peak since the beginning of the simulation, t(Imax), in (c) and the final epidemic size in (d), all as a function of Φ. All four panels correspond to the baseline mobility before lockdown.
Figure 5
Figure 5
Modeling response of cities to mitigation measures. Results of a metapopulation model using the S2 cells as basic geographical units. Simulations are run in each city with different values of Φ, obtained by the randomization procedure described in the text. Each box reflects 100 runs and displays the median, quartiles, the 5% and 95% confidence intervals. We explore the pandemic size for different lockdown scenarios: a strong lockdown, XS=0.8, for πth=5×10⁻³ in (a); a soft lockdown, XS=0.4, at the same prevalence in (b); another soft but earlier lockdown XS=0.4 and πth=10-3 in (c); and finally, in (d), a systematic exploration with XS for πth=5×10⁻³ in Atlanta.

References

    1. Zhou P, et al. A pneumonia outbreak associated with a new coronavirus of probable bat origin. Nature. 2020;579:270–273. - PMC - PubMed
    1. Wu F, et al. A new coronavirus associated with human respiratory disease in China. Nature. 2020;579:265–269. - PMC - PubMed
    1. Fang, H., Wang, L. & Yang, Y. Human mobility restrictions and the spread of the novel coronavirus (2019-ncov) in China (Technical Report, National Bureau of Economic Research, 2020). - PMC - PubMed
    1. Haug N, et al. Ranking the effectiveness of worldwide COVID-19 government interventions. Nat. Hum. Behav. 2020;4:1303–1312. - PubMed
    1. Pepe E, et al. Covid-19 outbreak response, a dataset to assess mobility changes in Italy following national lockdown. Sci. Data. 2020;7:1–7. - PMC - PubMed

Publication types