. 2022 Mar 9;12(1):3866.
doi: 10.1038/s41598-022-07863-4.

Structural connectivity of the sensorimotor network within the non-lesioned hemisphere of children with perinatal stroke

Affiliations

Structural connectivity of the sensorimotor network within the non-lesioned hemisphere of children with perinatal stroke

Brandon T Craig et al. Sci Rep. .

Abstract

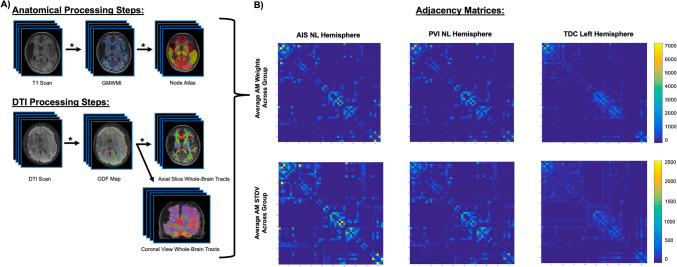
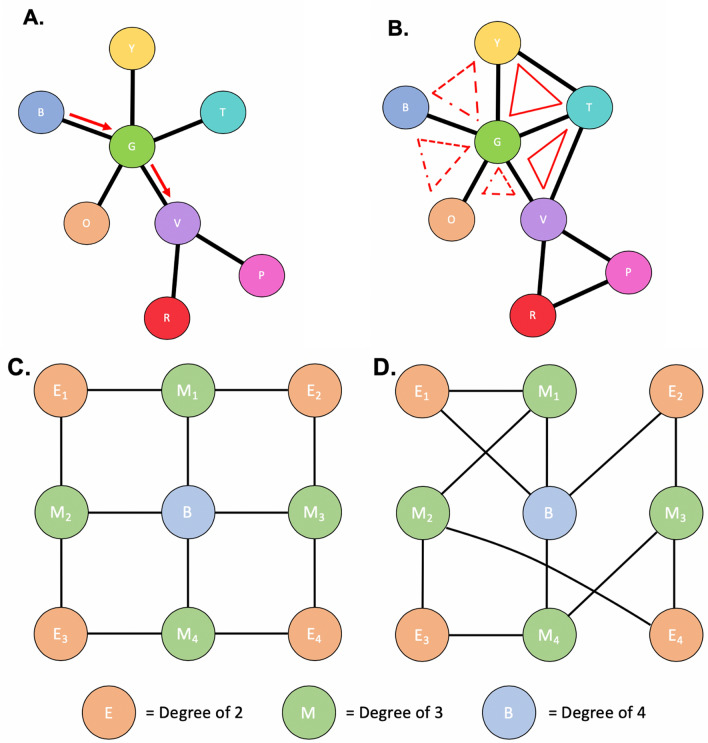
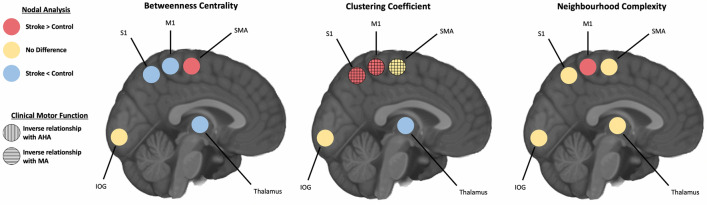
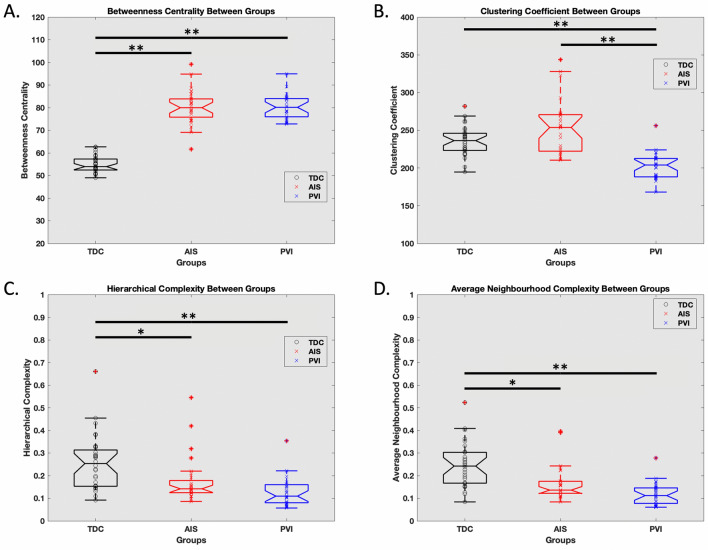
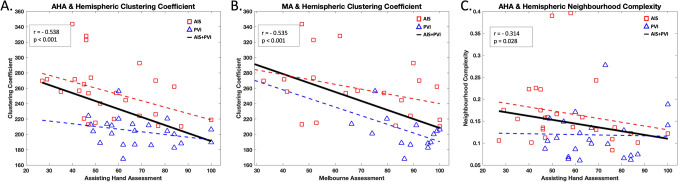
Perinatal stroke occurs early in life and often leads to a permanent, disabling weakness to one side of the body. To test the hypothesis that non-lesioned hemisphere sensorimotor network structural connectivity in children with perinatal stroke is different from controls, we used diffusion imaging and graph theory to explore structural topology between these populations. Children underwent diffusion and anatomical 3T MRI. Whole-brain tractography was constrained using a brain atlas creating an adjacency matrix containing connectivity values. Graph theory metrics including betweenness centrality, clustering coefficient, and both neighbourhood and hierarchical complexity of sensorimotor nodes were compared to controls. Relationships between these connectivity metrics and validated sensorimotor assessments were explored. Eighty-five participants included 27 with venous stroke (mean age = 11.5 ± 3.7 years), 26 with arterial stroke (mean age = 12.7 ± 4.0 years), and 32 controls (mean age = 13.3 ± 3.6 years). Non-lesioned primary motor (M1), somatosensory (S1) and supplementary motor (SMA) areas demonstrated lower betweenness centrality and higher clustering coefficient in stroke groups. Clustering coefficient of M1, S1, and SMA were inversely associated with clinical motor function. Hemispheric betweenness centrality and clustering coefficient were higher in stroke groups compared to controls. Hierarchical and average neighbourhood complexity across the hemisphere were lower in stroke groups. Developmental plasticity alters the connectivity of key nodes within the sensorimotor network of the non-lesioned hemisphere following perinatal stroke and contributes to clinical disability.


Conflict of interest statement

The authors declare no competing interests.

Figures

Figure 1
Figure 1
Neuroimage processing steps. (A) Anatomical images were segmented based on tissue type and combined to create a gray matter-white matter interface (GMWMI) image. The AAL2 atlas (node atlas) was co-registered into patient diffusion space. For DTI images, eddy currents and small head motion was corrected. ODF maps were then generated and whole-brain tracts were reconstructed (restricted to only white matter using the GMWMI image) and seeded using the co-registered node atlas to generate an undirected 47 × 47 node adjacency matrix containing number of streamlines between node pairs (network weights). Network weights in the non-lesioned hemispheres were compared between groups of children with perinatal stroke (AIS, PVI) and the left hemisphere in controls. Asterisks highlight steps where quality assurance was performed by two authors. (B) Group average adjacency matrices for AIS, PVI and TDC participants as well as matrices containing standard deviations to visually illustrate variances between the groups. Images in (A) were generated using MRTrix3 (https://www.mrtrix.org/) and images in (B) were generated using MATLAB (https://www.mathworks.com/products/matlab.html). DTI diffusion tensor image, ODF orientation density function, AIS arterial ischemic stroke, PVI periventricular venous infarction, TDC typically developing controls.
Figure 2
Figure 2
Graph theory application. Figure depicts various topological representations to help explain graph theory concepts. Circles represent a node, whereas the lines represent the edge or weight between each node. In (A), the arrow represents the shortest path from node B to node V. In (B), the red triangles represent closed triplets, whereas the dashed triangles represent possible triplets.
Figure 3
Figure 3
Sensorimotor network node analysis. Sensorimotor node differences between the dominant hemisphere of controls to the non-lesioned, intact hemisphere of both stroke groups are shown. For the simplicity of the diagram, both arterial and venous strokes were combined as they displayed no differences from each other in any of the nodes. Red circles represent the nodes where both stroke groups showed higher values compared to controls, yellow representing no difference, and blue representing nodes of lower values compared to controls. Vertical lines represent an inverse relationship between the respective graph theory metric at the node of interest and the AHA. Horizontal lines represent the same inverse relationship with the node, but in relationship to MA instead. S1 primary sensory cortex, M1 primary motor cortex, SMA supplementary motor area, IOG inferior occipital gyrus, AHA assisting hand assessment, MA Melbourne assessment.
Figure 4
Figure 4
Hemispheric network metrics between group comparisons. (A) Betweenness centrality was higher in AIS and PVI compared to TDC. (B) Clustering coefficient was higher in TDC and AIS compared to PVI. Hierarchical complexity, (C) average neighbourhood complexity, (D) were higher in TDC compared to AIS and PVI. **p < 0.001, *p < 0.01.
Figure 5
Figure 5
Hemispheric graph theory metrics and clinical motor function. (A) Hemispheric clustering coefficient was inversely related to AHA (A) and MA (B). The average neighbourhood complexity across the hemisphere was also inversely related to AHA (C). AHA assisting hand assessment, MA Melbourne assessment, AIS arterial ischemic stroke, PVI periventricular venous infarction.

References

    1. Dunbar M, et al. Population based birth prevalence of disease-specific perinatal stroke. Pediatrics. 2020 doi: 10.1542/peds.2020-013201. - DOI - PubMed
    1. Kirton A, deVeber G. Life after perinatal stroke. Stroke. 2013;44:3265–3271. doi: 10.1161/STROKEAHA.113.000739. - DOI - PubMed
    1. Kirton A, et al. Perinatal stroke: Mapping and modulating developmental plasticity. Nat. Rev. Neurol. 2021;17:415–432. doi: 10.1038/s41582-021-00503-x. - DOI - PubMed
    1. Dunbar M, Kirton A. Perinatal stroke. Semin. Pediatr. Neurol. 2019;32:100767. doi: 10.1016/j.spen.2019.08.003. - DOI - PubMed
    1. Craig BT, et al. Developmental neuroplasticity of the white matter connectome in children with perinatal stroke. Neurology. 2020;95:e2476–e2486. doi: 10.1212/WNL.0000000000010669. - DOI - PMC - PubMed

Publication types

Grants and funding