

Buffering the impacts of extreme climate variability in the highly engineered Tigris Euphrates river system
- PMID: 35264678
- PMCID: PMC8907168
- DOI: 10.1038/s41598-022-07891-0
Buffering the impacts of extreme climate variability in the highly engineered Tigris Euphrates river system
Abstract
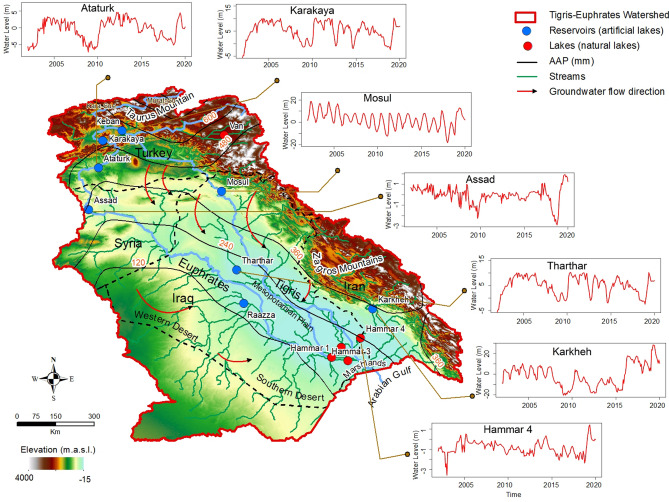
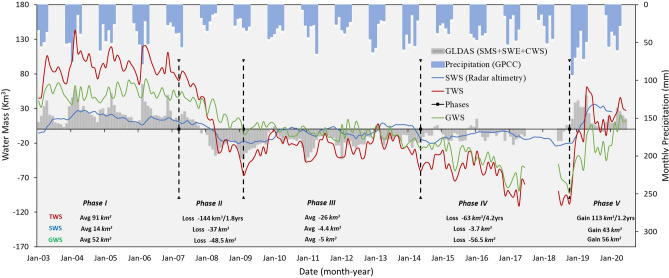
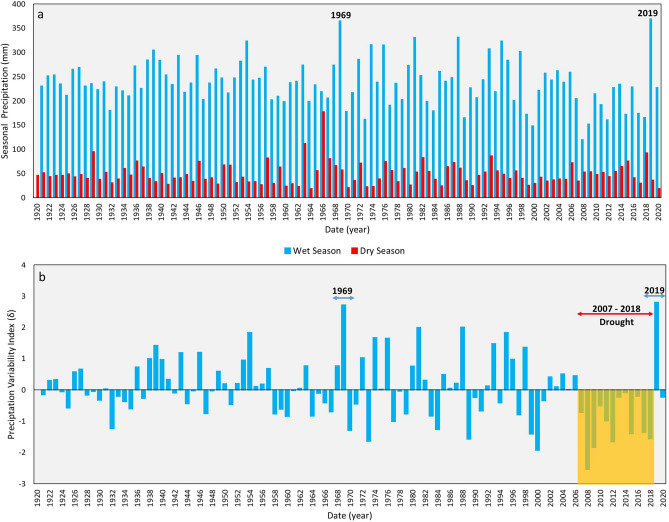
More extreme and prolonged floods and droughts, commonly attributed to global warming, are affecting the livelihood of major sectors of the world's population in many basins worldwide. While these events could introduce devastating socioeconomic impacts, highly engineered systems are better prepared for modulating these extreme climatic variabilities. Herein, we provide methodologies to assess the effectiveness of reservoirs in managing extreme floods and droughts and modulating their impacts in data-scarce river basins. Our analysis of multiple satellite missions and global land surface models over the Tigris-Euphrates Watershed (TEW; 30 dams; storage capacity: 250 km3), showed a prolonged (2007-2018) and intense drought (Average Annual Precipitation [AAP]: < 400 km3) with no parallels in the past 100 years (AAP during 1920-2020: 538 km3) followed by 1-in-100-year extensive precipitation event (726 km3) and an impressive recovery (113 ± 11 km3) in 2019 amounting to 50% of losses endured during drought years. Dam reservoirs captured water equivalent to 40% of those losses in that year. Additional studies are required to investigate whether similar highly engineered watersheds with multi-year, high storage capacity can potentially modulate the impact of projected global warming-related increases in the frequency and intensity of extreme rainfall and drought events in the twenty-first century.
© 2022. The Author(s).
Conflict of interest statement
The authors declare no competing interests.
Figures

References
-
- Trenberth KE. Changes in precipitation with climate change. Clim. Res. 2011;47:123–138.
-
- Dai A, Rasmussen RM, Liu C, Ikeda K, Prein AF. A new mechanism for warm-season precipitation response to global warming based on convection-permitting simulations. Clim. Dyn. 2020;55:343–368.
-
- Sharma A, Wasko C, Lettenmaier DP. If precipitation extremes are increasing, why aren’t floods? Water Resour. Res. 2018;54:8545–8551.
-
- Dai A. Hydroclimatic trends during 1950–2018 over global land. Clim. Dyn. 2021;56:4027–4049.
-
- Papalexiou SM, Montanari A. Global and regional increase of precipitation extremes under global warming. Water Resour. Res. 2019;55:4901–4914.
Publication types
MeSH terms
LinkOut - more resources
Full Text Sources
Medical
Miscellaneous
