. 2022 Mar;603(7901):477-481.
doi: 10.1038/s41586-022-04475-w. Epub 2022 Mar 9.

A non-canonical tricarboxylic acid cycle underlies cellular identity

Affiliations

A non-canonical tricarboxylic acid cycle underlies cellular identity

Paige K Arnold et al. Nature. 2022 Mar.

Abstract

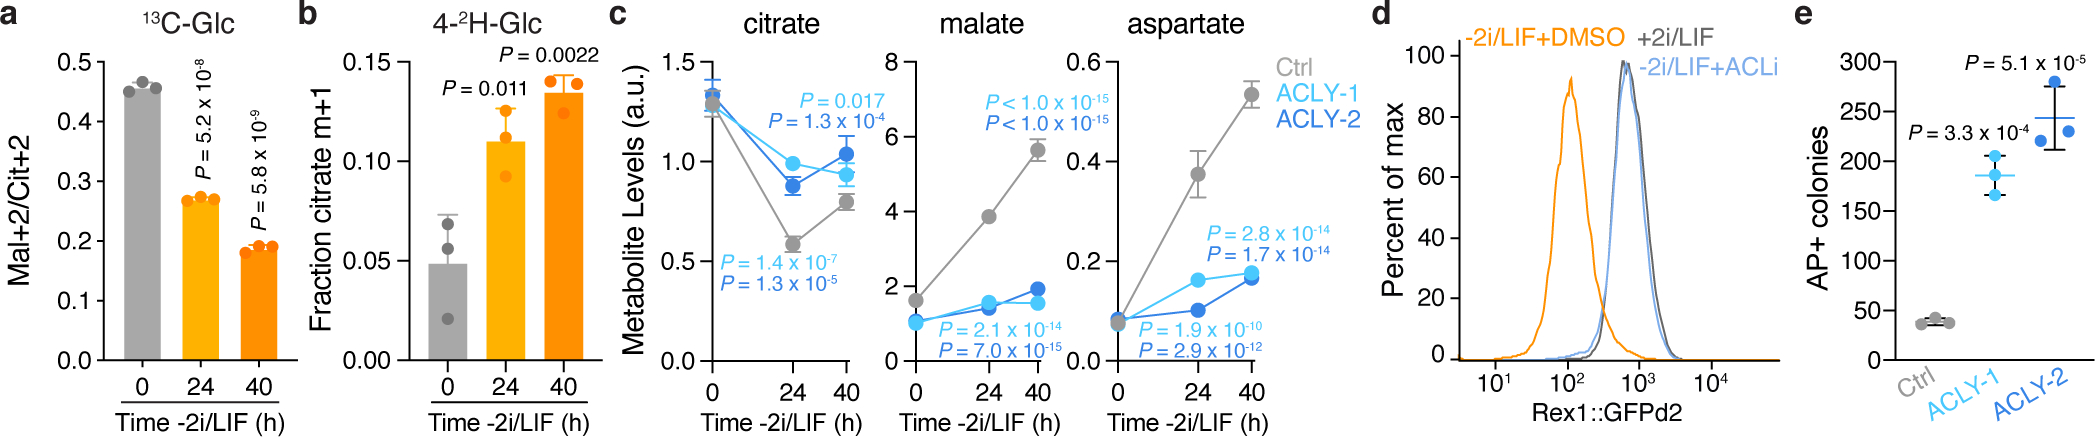
The tricarboxylic acid (TCA) cycle is a central hub of cellular metabolism, oxidizing nutrients to generate reducing equivalents for energy production and critical metabolites for biosynthetic reactions. Despite the importance of the products of the TCA cycle for cell viability and proliferation, mammalian cells display diversity in TCA-cycle activity1,2. How this diversity is achieved, and whether it is critical for establishing cell fate, remains poorly understood. Here we identify a non-canonical TCA cycle that is required for changes in cell state. Genetic co-essentiality mapping revealed a cluster of genes that is sufficient to compose a biochemical alternative to the canonical TCA cycle, wherein mitochondrially derived citrate exported to the cytoplasm is metabolized by ATP citrate lyase, ultimately regenerating mitochondrial oxaloacetate to complete this non-canonical TCA cycle. Manipulating the expression of ATP citrate lyase or the canonical TCA-cycle enzyme aconitase 2 in mouse myoblasts and embryonic stem cells revealed that changes in the configuration of the TCA cycle accompany cell fate transitions. During exit from pluripotency, embryonic stem cells switch from canonical to non-canonical TCA-cycle metabolism. Accordingly, blocking the non-canonical TCA cycle prevents cells from exiting pluripotency. These results establish a context-dependent alternative to the traditional TCA cycle and reveal that appropriate TCA-cycle engagement is required for changes in cell state.


Conflict of interest statement

Competing interests. P.K.A., B.T.J. and L.W.S.F. are inventors on a provisional patent application (U.S. Provisional Application No. 63/272,940) filed by Memorial Sloan Kettering Cancer Center. The patent application covers the use of ACL inhibitors to modify self-renewal potential of ESCs. The remaining authors declare no conflicts of interest.

Figures

Extended Data Fig. 1:
Extended Data Fig. 1:. Metabolic gene essentiality correlations across cancer cell lines.
Heatmap depicting hierarchical clustering of pairwise gene essentiality score correlations of core metabolic pathway genes derived from four GO terms: tricarboxylic acid (TCA) cycle, canonical glycolysis, one-carbon metabolic process and fatty-acyl-CoA metabolic process. Genes are color coded to the left of the heatmap according to the GO term. TCA cycle genes are highlighted (red) in the dendrogram. Gene names and correlation scores can be found in Supplementary Table 1.
Extended Data Fig. 2:
Extended Data Fig. 2:. Effect of ACL inhibition on 13C labeling of TCA cycle metabolites.
a, Two-dimensional network diagram representing gene essentiality score correlations between TCA cycle genes and their top co-dependencies. The strength of the correlation between genes is represented by both the length and thickness of the connecting edge. Correlation scores are shown in Supplementary Table 1. b, c, Fractional enrichment of citrate (left) and malate (right) in three non-small cell lung cancer (NSCLC) cell lines cultured in medium containing [U-13C]glucose (b) or [U-13C]glutamine (c) and treated with vehicle or 50 μM BMS-303141(ACLi) for 24 h. d, Schematic depicting [U-13C]asparagine labeling of aspartate and citrate in cells expressing guinea pig asparaginase (ASNase). Asparagine-derived aspartate will generate m+4 labeled citrate. Top, m+4 labeled citrate metabolized via the canonical TCA cycle will lose two labeled carbons as CO2, ultimately regenerating citrate that retains two labeled carbons (m+2). Bottom, m+4 labeled citrate metabolized by ACL will yield m+4 labeled oxaloacetate that will ultimately regenerate m+4 labeled citrate. e, f, Fractional labeling of aspartate (left) and citrate (right) (e) or citrate m+2 relative to citrate m+4 (Cit+2/Cit+4) (f) in ASNase-expressing 143B human osteosarcoma cells cultured in medium containing [U-13C]asparagine and treated with vehicle or 50 μM ACLi for 24 h. Data are mean ± SD, n = 3 independent replicates. Significance was assessed in comparison to vehicle treatment by two-way ANOVA with Sidak’s multiple comparisons post-test (b-c, e) or using unpaired two-tailed Student’s t-test (f).
Extended Data Fig. 3:
Extended Data Fig. 3:. ACO2 and ACL disruption in embryonic stem cells.
a, Fractional m+2 enrichment of citrate and malate in mouse ESCs cultured in medium containing [U-13C]glucose. b, Fractional enrichment of malate m+2 relative to citrate m+2 (Mal+2/Cit+2) derived from [U-13C]glucose in ESCs following treatment with vehicle or 50 μM BMS-303141 (ACLi) for 24 h. c, d, Immunoblot of clonal mouse embryonic stem cells (ESCs) in which CRISPR/Cas9-mediated editing was used to target either a non-genic region of chromosome 8 (Ctrl) and Acly (ACLY-1 and ACLY-2) (c) or Aco2 (ACO2–1 and ACO2–2) (d). e, f, Assessment of the [U-13C]glucose-derived Mal+2/Cit+2 ratio (e) or steady-state levels of TCA cycle metabolites represented as the fold change (expressed in log2) relative to Ctrl (f) in control and Aco2-edited ESCs. g, h, j, k, Fractional m+1 enrichment of NADH (g), lactate (h), fumarate (j) and succinate (k) in control and Acly-edited ESCs cultured in medium containing [4-2H]glucose. i, Schematic depicting deuterium transfer from [4-2H]glucose first onto malate in the cytoplasm then onto TCA cycle metabolites in the mitochondria. l, Quantification of the lactate over pyruvate ratio in control and Acly-edited ESCs. m, The baseline oxygen consumption rate (OCR) in control and Acly-edited ESCs normalized to protein content. Twelve technical replicates were averaged for each of three independent experiments. Data are mean ± SD, n = 3 independent replicates unless otherwise noted. Significance was assessed using unpaired two-tailed Student’s t-test (a, b) or in comparison to control cells by one-way ANOVA with Sidak’s multiple comparisons post-test for all other panels.
Extended Data Fig. 4:
Extended Data Fig. 4:. SLC25A1 and MDH1 contribute to TCA cycle metabolism in embryonic stem cells.
a, b, Immunoblot of clonal mouse embryonic stem cells (ESCs) in which CRISPR/Cas9-mediated editing was used to target either a non-genic region of chromosome 8 (Ctrl) and Slc25a1 (SLC25A1–1 and SLC25A1–2) (a) or Mdh1 (MDH1–1 and MDH1–2) (b). c, d, Fractional m+1 enrichment of malate (Mal), fumarate (Fum), aspartate (Asp) and citrate (Cit) in control (Ctrl) and Slc25a1-edited ESCs (c) or Mdh1-edited ESCs (d) cultured in medium containing [4-2H]glucose. e, f, Fractional m+2 enrichment of citrate, fumarate, malate and aspartate derived from [U-13C]glucose in control and Slc25a1-edited (e) or Mdh1-edited (f) ESCs. g, Steady-state levels of TCA cycle metabolites in Slc25a1-edited or Mdh1-edited ESCs. Levels are represented as the fold change (expressed in log2) relative to chromosome 8-targeted control cells. Data are mean ± SD, n = 3 independent replicates. Significance was assessed in comparison to control cells by two-way ANOVA (c-f) with Sidak’s multiple comparisons post-test.
Extended Data Fig. 5:
Extended Data Fig. 5:. Effect of myogenic differentiation on 13C-glucose labeling of TCA cycle intermediates.
a, Immunoblot comparing expression of myogenesis markers MYOG and MYH3 between proliferating (Prolif) and 100% confluent (Conf) myoblasts and myotubes differentiated for 3, 5 or 7 days. b, Fractional labeling of citrate (left) and malate (right) in proliferating and confluent myoblasts and myotubes differentiated for 3, 5 or 7 days cultured in medium containing [U-13C]glucose. c, Fractional m+1 enrichment from [4-2H]glucose of malate (Mal), fumarate (Fum), aspartate (Asp) and citrate (Cit) in myoblasts and myotubes differentiated for 5 days. d, Immunoblot comparing expression of ACL and ACO2 in C2C12 cells expressing doxycycline-inducible shRNAs targeting Acly (shAcly-1 and shAcly-2), Aco2 (shAco2–1 and shAco2–2) or Renilla luciferase (shRen, used as a control). Cells were cultured on doxycycline for two days to induce shRNA expression. e-h, Fractional m+2 enrichment of citrate (left) and malate (right) or malate m+2 relative to citrate m+2 (Mal+2/Cit+2) in myoblasts (e, f) or myotubes (g, h) expressing doxycycline-inducible shRNAs targeting Acly, Aco2 or Renilla luciferase cultured in medium containing [U-13C]glucose. Myoblasts and myotubes were cultured on doxycycline for two or four days, respectively, to induce shRNA expression. Data are mean ± SD, n = 3 independent replicates. In b, significance was assessed using one-way ANOVA with Sidak’s multiple comparisons post-test to compare total metabolite fraction labeled relative to proliferating myoblasts. In remaining panels, significance was assessed by two-way ANOVA in comparison to myoblasts (c) or by one-way ANOVA in comparison to shRen-expressing myoblasts (e-f) or myotubes (g-h) with Sidak’s multiple comparisons post-test.
Extended Data Fig. 6:
Extended Data Fig. 6:. Transcriptional profiles associated with TCA cycle choice.
a, Gene set enrichment analysis showing that genes positively correlated with fractional enrichment of malate m+2 relative to citrate m+2 (Mal+2/Cit+2) derived from [U-13C]glucose in 68 non-small cell lung cancer (NSCLC) are enriched for KEGG citric acid (TCA) cycle-associated genes. b, c, Fractional m+2 enrichment of citrate (Cit), fumarate (Fum), malate (Mal) and aspartate (Asp) (b) or Mal+2/Cit+2 (c) derived from [U-13C]glucose in mouse embryonic stem cells (ESCs) following treatment with vehicle, 5 mM DCA or 10 μM MPCi for 24 h. Data are mean ± SD, n = 3 independent samples. In b-c, significance was assessed in comparison to vehicle treatment by two-way ANOVA (b) or one-way ANOVA (c) with Sidak’s multiple comparisons post-test.
Extended Data Fig. 7:
Extended Data Fig. 7:. ACL loss blunts exit from naïve pluripotency.
a, Experimental setup for cell fate transitions. Mouse embryonic stem cells (ESCs) cultured in serum and leukemia inhibitory factor (LIF) are a heterogenous population that can be converted to the naïve, ground state of pluripotency by addition of MEK and GSK3β inhibitors (2i) in either serum replete (serum/LIF+2i, d-f) or serum-free (2i/LIF, g-i) media formulations. Transition to serum-free medium lacking 2i/LIF (−2i/LIF) induces exit from the naïve pluripotent state, enabling ESCs to gain differentiation competence. b, qRT-PCR of pluripotency-associated (Nanog, Esrrb, Klf2, Rex1 and Oct4) and early differentiation-associated (Fgf5, Otx2 and Sox1) genes in 2i/LIF-cultured ESCs subjected to 2i/LIF withdrawal for 12, 24 or 40 h. Levels are represented as the fold change (expressed in log2) relative to naïve, 2i/LIF-cultured ESCs (0 h). c, Quantification of alkaline phosphatase (AP)-positive colonies representing ESCs that failed to exit from the pluripotent state. 2i/LIF-cultured ESCs were subjected to 2i/LIF withdrawal for 0, 12, 24 or 40 h and then reseeded at clonal density into medium containing 2i and LIF. d-f, Fractional labeling of citrate (Cit), malate (Mal) and aspartate (Asp) in serum/LIF+2i-cultured ESCs incubated with [U-13C]glucose (d), [U-13C]glutamine (e) or [4-2H]glucose (f) subjected to exit from pluripotency for the indicated times. g, Fractional enrichment of glucose-derived malate m+2 relative to citrate m+2 (Mal+2/Cit+2) in 2i/LIF-cultured ESCs subjected to 2i/LIF withdrawal for the indicated times. h, i, Fractional labeling of citrate, malate and aspartate in 2i/LIF-cultured ESCs cultured in medium containing [U-13C]glucose (h) or [U-13C]glutamine (i) subjected to 2i/LIF withdrawal for the indicated times. j, Immunoblot of polyclonal ESCs in which CRISPR/Cas9-mediated editing was used to target either a non-genic region of chromosome 8 (sgChr8) or Tcf7l1 (sgTcf7l1). k, qRT-PCR of pluripotency-associated (Nanog,Esrrb, and Rex1) and early differentiation-associated (Sox1) genes in control and Tcf7l1-edited ESCs adapted to the naïve, ground state and subjected to 2i/LIF withdrawal for the indicated times. Levels are represented as the fold change (expressed in log2) relative to chromosome 8-targeted control cells in the naïve, ground state (0 h). l, m, Fractional labeling of citrate (left) and malate (right) (l) and glucose-derived Mal+2/Cit+2 ratio (m) in chromosome 8-targeted control or Tcf7l1-edited ESCs cultured in medium containing [U-13C]glucose subjected to 2i/LIF withdrawal for the indicated times. Data are mean ± SD, n = 3 independent replicates. In d-e, h-i, and l, significance was assessed using one-way ANOVA (d-e, h-i) or two-way ANOVA (l) with Sidak’s multiple comparisons post-test to compare total metabolite fraction labeled relative to the 0 h timepoint (d-e, h-i) or control cells (l). In remaining panels, significance was assessed relative to the 0 h timepoint using one-way ANOVA (c, f-g) or chromosome 8-targeted control cells at each time point using two-way ANOVA (k, m) with Sidak’s multiple comparisons post-test.
Extended Data Fig. 8:
Extended Data Fig. 8:. Acetate does not reverse the effects of ACL loss on exit from pluripotency.
a, b, Fractional labeling of citrate (Cit), malate (Mal) and aspartate (Asp) in control and Acly-edited ESCs cultured in medium containing [U-13C]glucose (a) or [U-13C]glutamine (b) following 40 h of 2i/LIF withdrawal. c, d, Fractional enrichment of malate m+2 relative to citrate m+2 (Mal+2/Cit+2) derived from [U-13C]glucose (c) or steady-state levels of TCA cycle metabolites (d) in naïve, 2i-adapted control (Ctrl) and Acly-edited (ACLY-1 and ACLY-2) ESCs. Steady-state levels are represented as the fold change (expressed in log2) relative to control cells. e, f, Assessment of the [U-13C]glucose-derived Mal+2/Cit+2 ratio (e) and steady-state levels of TCA cycle metabolites (f) in control and Acly-edited ESCs subjected to 2i/LIF withdrawal for 40 h. g, Relative viability (measured by PI exclusion) of control and Acly-edited ESCs maintained in the naïve pluripotent state (+2i/LIF, left) or subjected to 2i/LIF withdrawal for 40 h (−2i/LIF, right). h, Immunoblot showing expression of ACSS2, the enzyme that converts acetate to acetyl-CoA in the cytosol, in naïve, ground state ESCs subjected to 2i/LIF withdrawal for the indicated times. i, Fractional labeling of palmitate in control and Acly-edited ESCs cultured in medium containing [U-13C]acetate following 40 h of 2i/LIF withdrawal. Each bar represents one independent sample. j, Immunoblot comparing levels of acetylation (ac) at indicated histone lysine residues in control and Acly-edited ESCs subjected to 2i/LIF withdrawal for 40 h in the presence of vehicle or 5 mM sodium acetate. k, Relative viability of control and Acly-edited ESCs subjected to 2i/LIF withdrawal for 40 h in the presence of vehicle or 5 mM sodium acetate. l, Quantification of GFP mean fluorescence intensity (MFI) encoded by the Rex1::GFPd2 reporter in ESCs subjected to 2i/LIF withdrawal for 40 h in the presence of vehicle or 50 μM BMS-303141 (ACLi). Naïve ESCs (+2i/LIF) are included as a control. Representative histograms are shown in Fig. 4d. m, qRT-PCR of pluripotency-associated (Nanog, Esrrb and Rex1) and early differentiation-associated (Sox1) genes in control and Acly-edited ESCs subjected to 2i/LIF withdrawal for 40 h. Levels are represented as the fold change (expressed in log2) relative to chromosome 8-targeted control cells. n, Alkaline phosphatase (AP) staining of colony formation assay representing control and Acly-edited ESCs that failed to exit the naïve pluripotent state. 2i-adapted ESCs were subjected to 2i/LIF withdrawal for 40 h and then reseeded at clonal density into medium containing 2i/LIF. Quantification is shown in Fig. 4e. o, qRT-PCR of pluripotency-associated genes in control and Acly-edited ESCs subjected to 2i/LIF withdrawal for 40 h in the presence of vehicle or 5 mM sodium acetate. p, Quantification of GFP MFI encoded by the Rex1::GFPd2 reporter in ESCs subjected to 2i/LIF withdrawal for 40 h in the presence of DMSO or 50 μM BMS-303141(ACLi) and vehicle or 5 mM sodium acetate. q, Quantification of AP-positive colonies representing control and Acly-edited ESCs that failed to exit from the pluripotent state. ESCs were subjected to 2i/LIF withdrawal for 40 h in the presence of vehicle or 5 mM sodium acetate prior to reseeding at clonal density into medium containing 2i and LIF. Data are mean ± SD, n = 5 (p), n = 4 (g, k, l) or n = 3 (all other experiments) independent replicates. In a-b, significance was assessed using one-way ANOVA with Sidak’s multiple comparisons post-test to compare total metabolite fraction labeled relative to control cells. In remaining panels, significance was assessed by two-way ANOVA relative to control cells (k, q) or DMSO treatment (p) with Sidak’s multiple comparisons post-test, or by one-way ANOVA in comparison to control cells (c, e, g) with Sidak’s multiple comparisons post-test or in the indicated comparisons (l) with Tukey’s multiple comparisons post-test.
Extended Data Fig. 9:
Extended Data Fig. 9:. Effect of SLC25A1 and MDH1 loss in exit from naïve pluripotency.
a, b, Relative viability (measured by PI exclusion) of control and Slc25a1-edited (left) and Mdh1-edited (right) ESCs maintained in the naïve pluripotent state (+2i/LIF, a) or subjected to 2i/LIF withdrawal for 40 h (−2i/LIF, b). c, Steady-state levels of TCA cycle metabolites in control and Slc25a1-edited (left) and Mdh1-edited (right) ESCs subjected to 2i/LIF withdrawal for 40 h. Steady-state levels are represented as the fold change (expressed in log2) relative to control cells. d, e, Relative O-propargyl-puromycin (OP-puro) mean fluorescence intensity (MFI) in control, Slc25a1-edited, Acly-edited and Mdh1-edited ESCs that have been maintained in the naïve pluripotent state (d) or subjected to 2i/LIF withdrawal for 40 h (e). Dotted line represents OP-puro MFI following cycloheximide (CHX) treatment as a control. f, g, Population doublings of control, Slc25a1-edited, Acly-edited and Mdh1-edited ESCs that have been maintained in the naïve pluripotent state (f) or subjected to 2i/LIF withdrawal for 40 h (g). h, i, qRT-PCR of pluripotency-associated (Nanog, Esrrb and Rex1) and early differentiation-associated (Sox1) genes in control and Slc25a1-edited (h) and Mdh1-edited (i) ESCs subjected to 2i/LIF withdrawal for 40 h. Data are mean ± SD, n = 3 independent samples. Significance was assessed in comparison to control cells by one-way ANOVA with Sidak’s multiple comparisons post-test.
Extended Data Fig. 10:
Extended Data Fig. 10:. Mode of TCA cycle engagement regulates cell fate.
a, Population doublings of control and Aco2-edited ESCs cultured in metastable (serum/LIF) conditions. b, Cumulative population doublings over the indicated passages of control and Aco2-edited ESCs upon conversion to the naïve, ground state of pluripotency via addition of MEK and GSK3β inhibitors (+2i). c, qRT-PCR of pluripotency-associated genes at the indicated passages in control and Aco2-edited ESCs following addition of 2i. Gene expression at every passage was normalized to passage 0 (p0). Data are mean ± SD, n = 1 (b) or n = 3 (a, c) independent replicates. Significance was assessed in comparison to control cells by one-way ANOVA with Sidak’s multiple comparisons post-test (a) or relative to control cells at each timepoint with P values colored according to comparison by two-way ANOVA with Sidak’s multiple comparisons post-test (c).
Fig. 1:
Fig. 1:. Genetic co-essentiality mapping of metabolic enzymes reveals two TCA cycle modules.
a, Two-dimensional network diagram representing gene essentiality score correlations between genes from indicated pathways (GO terms: TCA cycle, canonical glycolysis, one-carbon metabolic process and fatty-acyl-CoA metabolic process). Correlation strength is depicted by the length and thickness of the connecting edge. b, Schematic representing two TCA cycle modules that emerge from gene clustering in a. Left, cluster 2 genes annotated on the traditional TCA cycle in bold. Right, cluster 1 genes annotated on a ‘non-canonical’ TCA cycle in which citrate is exported to the cytoplasm and cleaved by ACL to liberate acetyl-CoA and regenerate oxaloacetate, which can yield malate for mitochondrial import and oxaloacetate regeneration. Genes are colored according to their GO term or grey (no significant correlation). c, Schematic depicting possible fates for citrate containing 2 carbons derived from [U-13C]glucose. Top, m+2 labeled citrate metabolized by aconitase in the traditional TCA cycle generates m+2 labeled malate. Bottom, m+2 labeled citrate cleaved in the cytoplasm by ACL loses two heavy-labeled carbons, producing unlabeled four-carbon derivatives. d, Fractional m+2 enrichment of TCA cycle intermediates in 82 non-small cell lung cancer (NSCLC) cell lines cultured with [U-13C]glucose for 6 h. Data mined from Chen et al., 2019. e, Fractional enrichment of glucose-derived malate m+2 relative to citrate m+2 (Mal+2/Cit+2) in NSCLC cell lines following incubation with vehicle or 50 μM BMS-303141 (ACLi) for 24 h. Data are mean ± SD, n = 3 independent replicates. Significance was assessed in comparison to citrate by one-way ANOVA (d) or vehicle-treated cells by two-way ANOVA (e) with Sidak’s multiple comparisons post-test.
Fig. 2:
Fig. 2:. ACL loss disrupts TCA cycle metabolism in ESCs.
a, b, Fractional m+2 enrichment of citrate (Cit), fumarate (Fum), malate (Mal) and aspartate (Asp) (a) or malate m+2 relative to citrate m+2 (Mal+2/Cit+2) (b) in control (Ctrl) and Acly-edited (ACLY-1 and ACLY-2) mouse ESCs cultured in medium containing [U-13C]glucose. c, Steady-state levels of TCA cycle metabolites in Acly-edited mouse ESCs. Levels are represented as the fold change (expressed in log2) relative to control cells. d, Schematic depicting deuterium label transfer from [4-2H]glucose first onto NADH during glycolysis and subsequently onto either malate or lactate in the cytoplasm through MDH1 or LDH activity, respectively. Following mitochondrial import, deuterium-labeled malate can be converted to fumarate. The symmetry of fumarate allows the deuterium label to be scrambled, enabling generation of deuterium-labeled citrate. e, f, Fractional m+1 enrichment of malate (e) or citrate (f) in control and Acly-edited ESCs cultured in medium containing [4-2H]glucose. g, h, Mal+2/Cit+2 derived from [U-13C]glucose in control and Slc25a1-edited (g) or Mdh1-edited (h) ESCs. Data are mean ± SD, n = 3 independent replicates. Significance was assessed using two-way ANOVA (a) or one-way ANOVA (b, e-h) with Sidak’s multiple comparisons post-test relative to controls.
Fig. 3:
Fig. 3:. Engagement of the non-canonical TCA cycle is cell-state dependent.
a, Fractional enrichment of malate m+2 relative to citrate m+2 (Mal+2/Cit+2) derived from [U-13C]glucose in proliferating and confluent myoblasts and myotubes differentiated for 3, 5 or 7 days. b, Measurement of steady-state levels of citrate (Cit), fumarate (Fum), malate (Mal) and aspartate (Asp), expressed as the log2 fold change relative to shRenilla, in myoblasts (top) and myotubes (bottom). Myoblasts and myotubes expressing doxycycline-inducible shRNAs targeting Acly (shAcly-1 and shAcly-2), Aco2 (shAco2–1 and shAco2–2) or Renilla luciferase (shRen, used as a control) were cultured on doxycycline for two or four days, respectively, to induce shRNA expression. c, RNA-seq of TCA cycle-associated genes in myoblasts and myotubes differentiated for 5 days. Levels are represented as the log2 fold change relative to the row mean. n = 3 independently derived samples. d, e, Fractional m+2 enrichment (d) or the Mal+2/Cit+2 ratio (e) derived from [U-13C]glucose in myoblasts following treatment with vehicle (Ctrl), 5 mM dichloroacetic acid (DCA) or 10 μM UK-5099 (MPCi) for 24 h. Data are mean ± SD, n = 3 independent replicates. Significance was assessed in comparison to proliferating myoblasts (a) or vehicle treatment (d, e) by one-way ANOVA (a, e) or two-way ANOVA (d) with Sidak’s multiple comparisons post-test.
Fig. 4:
Fig. 4:. Exit from naïve pluripotency requires engagement of the non-canonical TCA cycle.
a, b, Fractional enrichment of malate m+2 relative to citrate m+2 (Mal+2/Cit+2) derived from [U-13C]glucose (a) or citrate m+1 derived from [4-2H]glucose (b) in ESCs subjected to 2i/LIF withdrawal for the indicated times. c, Steady-state levels of metabolites in control and Acly-edited ESCs grown −2i/LIF for the indicated times. d, Representative histogram of GFP intensity encoded by the Rex1::GFPd2 reporter in ESCs subjected to 2i/LIF withdrawal for 40 h in the presence of vehicle or 50 μM BMS-303141 (ACLi). Naïve ESCs (+2i/LIF) are included as a control. e, Quantification of alkaline phosphatase positive (AP+) colonies representing control and Acly-edited ESCs that failed to exit the naïve pluripotent state. 2i-adapted ESCs subjected to 2i/LIF withdrawal for 40 h were reseeded at clonal density into medium containing 2i/LIF. One histogram representative of 4 replicates with similar results shown in (d). All other panels depict data as mean ± SD, n = 3 independent replicates. Significance was assessed by two-way ANOVA with Sidak’s multiple comparisons post-test relative to control cells at each timepoint with P values colored according to comparison (c), or by one-way ANOVA in comparison to 0 h (a-b) or control cells (e) with Sidak’s multiple comparisons post-test.

Comment in

Similar articles

Cited by

References

    1. DeBerardinis RJ & Chandel NS Fundamentals of cancer metabolism. Sci Adv 2, e1600200, doi:10.1126/sciadv.1600200 (2016). - DOI - PMC - PubMed
    1. Kim J & DeBerardinis RJ Mechanisms and Implications of Metabolic Heterogeneity in Cancer. Cell metabolism 30, 434–446, doi:10.1016/j.cmet.2019.08.013 (2019). - DOI - PMC - PubMed
    1. Muir A, Danai LV & Vander Heiden MG Microenvironmental regulation of cancer cell metabolism: implications for experimental design and translational studies. Dis Model Mech 11, doi:10.1242/dmm.035758 (2018). - DOI - PMC - PubMed
    1. Tsherniak A et al. Defining a Cancer Dependency Map. Cell 170, 564–576 e516, doi:10.1016/j.cell.2017.06.010 (2017). - DOI - PMC - PubMed
    1. Wainberg M et al. A genome-wide almanac of co-essential modules assigns function to uncharacterized genes. bioRxiv, 827071, doi:10.1101/827071 (2019). - DOI - PMC - PubMed

Publication types